 Multi-family
1411 Upton Ave N · Minneapolis, MN
Flood risk 5/10 · Moderate
- FEMA flood zone
- X (unshaded)
- Chance of flooding over 30 yrs
- 0.48%
- Est. flood insurance / yr
- $473 – $860
Fire risk 1/10 · Minimal
- Est. fire insurance / yr
- $888 – $1,650
Heat risk 2/10 · Minimal
- Hot days now (above 99°F)
- 7 days/yr
- Hot days in 30 yrs
- 14 days/yr
Wind risk 2/10 · Minimal
- Chance of severe wind over 30 yrs
- —
Air-quality risk 2/10 · Minimal
- Unhealthy air days now
- 1 days/yr
- Unhealthy air days in 30 yrs
- 1 days/yr
Risk factors via First Street. Map © Google.
Why this score? — see what drove the B+ grade
The composite is a weighted blend of 9 inputs, each scored 0–100. Each bar is that input's sub-score; the figure is the points it added to the 100-point composite (weight × sub-score).
- Cash flow +30.0/30.0
- ARV discount +15.0/15.0
- DSCR +10.0/10.0
- 1% rule +9.1/10.0
- Rent growth +4.3/5.0
- Livability +3.9/5.0
- Schools +3.5/10.0
- Condition / age +2.5/5.0
- Appreciation +0.0/10.0
$269,900
🖨 Deal sheet (PDF) 📄 Offer letter ✓ Due diligence
Multi-family units
County records classify this as Multi-Family (5+ Unit). Listing-text estimate: 1 unit. estimate disagrees with records
5+ unit building — per-unit beds/baths from public records are typically unavailable; the breakdown below (if shown) is an estimate from the listing text.
Listing remarks MLS
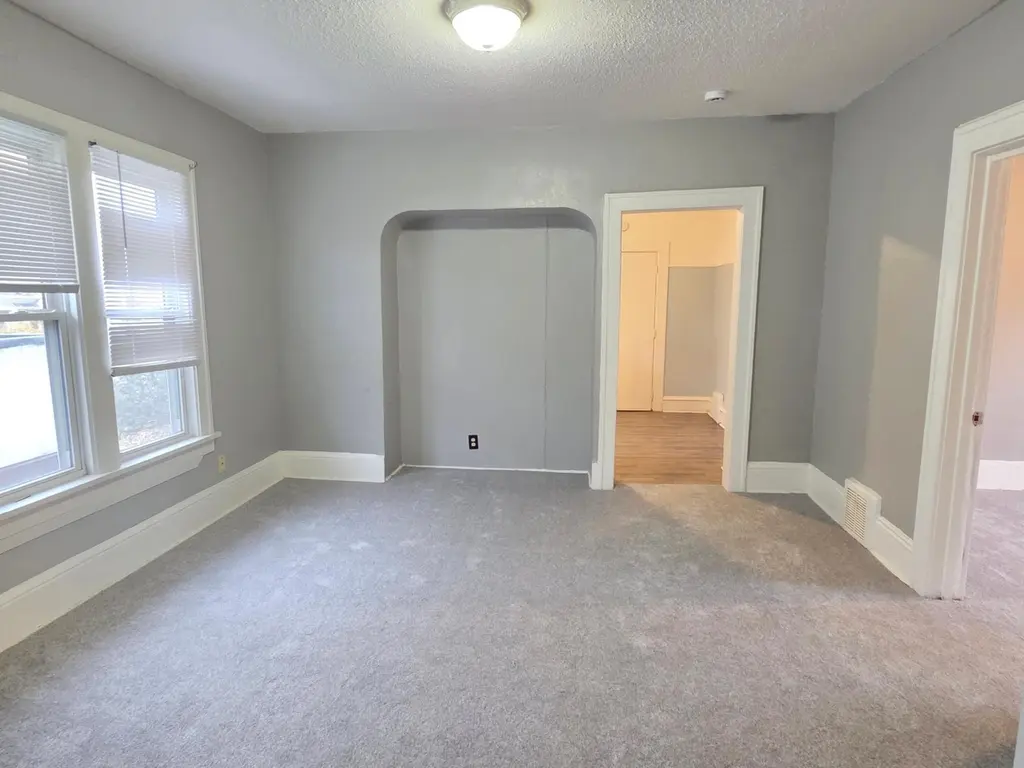
Welcome to this fantastic live in or investment opportunity! Both the upper and lower units feature identical layouts with 3 bedrooms and a full bath each. The upper unit is vacant, newly remodeled, and move in ready or easily rentable if preferred!
Key facts
- 5,227 sq ft lot
- Built 1921
- Listed 205 days
Neighborhood map
What this means for you Summary
Snapshot
- This is a 4-bed/2.0-bath multifamily listed at $270k.
Deal economics
- At list price, monthly cash flow is $1k ($17k/yr) — positive.
- The deal already cash-flows at list — no discount required.
- Meets the 1% rule at list price ($4k rent vs $270k).
- Recommended offer: $238k (12.0% below list) — sets the bar for market timing.
- Cap rate 12.5% vs local median 3.1% in Minneapolis — top-decile yield for the area; either an underpriced asset or a hidden risk that comps aren't pricing in. Stress-test before assuming the spread holds.
Location & tenants
- Location reads 78/100 on livability (#110 in MN, #2,525 nationally) — a middle-class / working-renter tenant base. Strengths: amenities A+, commute A+, housing A+; Watch: cost of living C-, crime F.
- Minneapolis Public School District (urban): math 35% / reading 46% proficiency, ranked #217 of 301 in MN (top 72%) — families likely to look elsewhere, expect single-tenant / working-renter base with shorter leases.
- Market conditions: Rents rising fast (+7.3%/yr); 132 active listings in the ZIP; 8 comparable units currently listed for rent nearby; rentals at typical pace (median 23d on market — plan ~3-4 weeks tenant-placement turnaround); 4,651 units permitted in Hennepin County in 2024 (2,443 in 5+ unit buildings).
- At $3,817/mo this rent would consume 76% of the median local household income ($60k/yr) (locally 1826% of renters already pay >50% of income on rent) — very limited rent-growth headroom before tenants either downsize or default.
Forward outlook
- Local home prices are declining (-3.0%/yr); year-one equity from $2k of loan paydown is wiped out by about $8k of value loss. Plan a longer hold.
- Hennepin County population projected at +30% by 2050 — long-run rental-demand tailwind backs the buy-and-hold thesis.
- At projected returns (-3.0% appreciation + 7.3% rent growth), your $76k cash investment doubles in ~5 years — after that, you're playing with house money.
Negotiation context
- It's been on market 205 days — a 12% lower offer ($238k) is reasonable based on typical stale-listing flexibility.
- 8 sale attempts since 22y ago with the ask held roughly flat each time — persistent listings suggest the price (not the market) is what's stuck; bring a comps-based counter.
- Current owner paid $165k; list at $270k implies a 64% gain — meaningful room to come down on a strong offer.
Risks & watch-outs
- Watch-outs: built in 1921 — expect roof / HVAC / electrical / plumbing capex.
- Climate carrying-cost: moderate flood risk — expect insurance premiums to compound above CPI over the hold.
Questions for the listing agent
- It's been on market 205 days. Have you received any prior offers? Is the seller open to a 12% concession, seller financing, or rate buy-down credit?
- Built in 1921 — when were the roof, HVAC, electrical panel, plumbing, and water heater last replaced?
- Why hasn't it sold? Are there any deal-killer items the seller is aware of (foundation, flood, title, zoning, code violations)?
- Is there a deadline driving the sale (1031 exchange, divorce, estate, relocation)? That informs how much negotiation room exists.
- Crime grade is F in this area — have there been break-ins, vandalism, or insurance claims at this property in the last 3 years? What carrier currently insures it and at what premium?
- What's the average days-on-market for RENTAL listings here right now (not sales)? A rising rental-DOM trend means longer vacancies and softer asking-rent achievability than the comps imply.
- What's the recent tenant-quality profile in this submarket — average credit score on applications, eviction rate, late-payment / NSF rate, and stable-employment percentage? A property-management company in the area should have these aggregated.
- How much new apartment / multifamily construction is in the pipeline within 1–3 miles? Heavy new supply (>2% of stock underway) typically softens rents 12–24 months out; light construction supports rent growth.
Investment metrics
- 1% rule
- 1.41% ✓
- Cap rate
- 12.50%
- Cash-on-cash
- 22.16%
- DSCR
- 1.99
- GRM
- 5.9
CMA / ARV
- ARV (median comp)
- $398,471
- List price
- $269,900
- Delta
- -32.27%
- Verdict
- UNDERPRICED
- Comps
- 1 within 2.0 mi
Projected returns pro-forma
-3.0% appreciation · 7.35% rent growth · sell at horizon
- IRR
- 19.4%
- Equity multiple
- 1.83×
- Total profit
- $62,478
- Equity at exit
- $40,243
- IRR
- 30.3%
- Equity multiple
- 4.27×
- Total profit
- $246,746
- Equity at exit
- $23,336
Cash invested: $75,572 (down + closing). Projections, not guarantees.
Landlord ↔ Tenant lean methodology
- Overall (CITY)
- 34 Tenant-Leaning
- State Minnesota
- 46 Balanced · D+2
- County
- — inherits STATE
- City Minneapolis
- 34 Tenant-Leaning · D+50
ZIP-level market 55411
- Home prices YoY
- -8.7%
- Rents YoY
- 7.3%
- Active inventory
- 132
- Price-to-rent
- 11.8×
Monthly cashflow live
- Estimated rent
- $3,817 high interval (Pro) →
- Mortgage (P&I)
- −$1,415
- Tax from tax record
- −$92 /mo · $1,107/yr
- Insurance
- −$112
- HOA
- −$0
- Vacancy / Maint / Mgmt
- −$802
- Net cashflow
- $1,395
Break-even live
Sensitivity live
| Price | -10% $1,548 | -5% $1,472 | +0% $1,395 | +5% $1,319 | +10% $1,243 |
|---|---|---|---|---|---|
| Rent | -10% $1,094 | -5% $1,245 | +0% $1,395 | +5% $1,546 | +10% $1,697 |
| Rate | -1.0pp $1,531 | -0.5pp $1,464 | base $1,395 | +0.5pp $1,325 | +1.0pp $1,254 |
2-unit breakdown (identical units grouped — click to expand)
| Units | Beds | Baths | Est. rent |
|---|---|---|---|
| 2× units | 3 | 1 | $3,818 |
| #1 | 3 | 1 | $1,909 |
| #2 | 3 | 1 | $1,909 |
| Total (2 units) | $3,817 | ||
UW: 25.0% down · 7.5% · 30yr · 1.5% tax · 5.0% vac · 8.0% maint · 8.0% mgmt
Financing live
Cash to close
- Down payment
- $67,475
- Closing costs
- $8,097
- Reserves months
- —
- Total cash needed
- —
Loan-product check · same deal, 3 products live
Conventional
25% down · 7.5% · 30yr
- Down + closing
- —
- Monthly P&I
- —
- Monthly cashflow
- —
- DSCR
- —
- Eligible?
- —
Personal DTI + credit; lowest rate.
DSCR
20% down · 8.5% · 30yr
- Down + closing
- —
- Monthly P&I
- —
- Monthly cashflow
- —
- DSCR
- —
- Eligible?
- —
No personal income docs; deal must DSCR.
Hard money
10% down · 12.0% · 12mo
- Down + closing
- —
- Monthly P&I
- —
- Monthly cashflow
- —
- DSCR
- —
- Eligible?
- —
Short-term bridge; refi at stabilization.
Rent comps 8 comps
| Address | Beds | Baths | Sqft | Rent | $/sqft | DOM | Units | Dist |
|---|---|---|---|---|---|---|---|---|
| 1504 Queen Ave N Minneapolis, MN | 3.0 | 1.5 | 1746 | $2,800 | $1.60 | 2d | 1 | 0.28mi |
| 1239 Knox Ave N Minneapolis, MN | 4.0 | 1.0 | 1944 | $2,400 | $1.23 | 4d | 1 | 0.66mi |
| 1414 Golden Valley Rd Unit 2 Minneapolis, MN | 5.0 | 2.0 | 2000 | $2,595 | $1.30 | 44d | 1 | 0.86mi |
| 522 N Newton Ave Unit 1 Minneapolis, MN | 4.0 | 2.0 | 2000 | $2,100 | $1.05 | 44d | 1 | 0.87mi |
| 1611 Glenwood Ave #2 Minneapolis, MN | 3.0 | 2.0 | 1800 | $2,100 | $1.17 | 15d | 1 | 1.13mi |
| 1113 N 25th Ave Minneapolis, MN | 5.0 | 2.0 | 2295 | $2,695 | $1.17 | 18d | 1 | 1.23mi |
| 2819 Girard Ave N Minneapolis, MN | 5.0 | 2.0 | 1718 | $2,300 | $1.34 | 44d | 1 | 1.37mi |
| 2923 Girard Ave N Minneapolis, MN | 5.0 | 2.0 | 1760 | $2,795 | $1.59 | 22d | 1 | 1.43mi |
Listing history 36 events
-
2026-06-18days on market $269,900 Active 205 DOM
-
2026-06-17days on market $269,900 Active 204 DOM
-
2026-06-16days on market $269,900 Active 203 DOM
-
2026-06-15days on market $269,900 Active 202 DOM
-
2026-06-13days on market $269,900 Active 200 DOM
-
2026-06-09days on market $269,900 Active 196 DOM
-
2026-06-08days on market $269,900 Active 195 DOM
-
2026-06-07days on market $269,900 Active 194 DOM
-
2026-06-04days on market $269,900 Active 191 DOM
-
2026-06-03days on market $269,900 Active 190 DOM
-
2026-06-02days on market $269,900 Active 189 DOM
-
2026-06-01days on market $269,900 Active 188 DOM
-
2026-05-31days on market $269,900 Active 187 DOM
-
2026-05-14price $269,900 249-char remark
Show marketing remark (249 chars)
Welcome to this fantastic live in or investment opportunity! Both the upper and lower units feature identical layouts with 3 bedrooms and a full bath each. The upper unit is vacant, newly remodeled, and move in ready or easily rentable if preferred!
-
2026-01-21status Active 249-char remark
Show marketing remark (249 chars)
Welcome to this fantastic live in or investment opportunity! Both the upper and lower units feature identical layouts with 3 bedrooms and a full bath each. The upper unit is vacant, newly remodeled, and move in ready or easily rentable if preferred!
-
2025-12-17historical Contingent - Subject to Financing 249-char remark
Show marketing remark (249 chars)
Welcome to this fantastic live in or investment opportunity! Both the upper and lower units feature identical layouts with 3 bedrooms and a full bath each. The upper unit is vacant, newly remodeled, and move in ready or easily rentable if preferred!
-
2025-11-24$279,900 Active 249-char remark
Show marketing remark (249 chars)
Welcome to this fantastic live in or investment opportunity! Both the upper and lower units feature identical layouts with 3 bedrooms and a full bath each. The upper unit is vacant, newly remodeled, and move in ready or easily rentable if preferred!
-
2019-08-08soldstatus $165,000
-
2014-10-15soldstatus $149,900 Sold 261-char remark
Show marketing remark (261 chars)
BIG TIME OPPORTUNITY FOR SERIOUS INVESTOR OR OWNER OCCUPANT. REMODELED W/ FRESH PAINT, NEW FLOORING & APPLIANCES. NEW ROOF 2011. NEW FURNACES & AC'S 2009. LG BDRMS, BEAUTIFUL SPACIOUS UNITS - EASY TO RENT! PREVIOUS TENANTS WERE LONG TERM $850 EACH UNIT.
-
2014-10-15soldstatus $149,900
Show marketing remark (261 chars)
BIG TIME OPPORTUNITY FOR SERIOUS INVESTOR OR OWNER OCCUPANT. REMODELED W/ FRESH PAINT, NEW FLOORING & APPLIANCES. NEW ROOF 2011. NEW FURNACES & AC'S 2009. LG BDRMS, BEAUTIFUL SPACIOUS UNITS - EASY TO RENT! PREVIOUS TENANTS WERE LONG TERM $850 EACH UNIT.
-
2014-10-01status Pending 261-char remark
Show marketing remark (261 chars)
BIG TIME OPPORTUNITY FOR SERIOUS INVESTOR OR OWNER OCCUPANT. REMODELED W/ FRESH PAINT, NEW FLOORING & APPLIANCES. NEW ROOF 2011. NEW FURNACES & AC'S 2009. LG BDRMS, BEAUTIFUL SPACIOUS UNITS - EASY TO RENT! PREVIOUS TENANTS WERE LONG TERM $850 EACH UNIT.
-
2014-09-23historical Contingent - Inspection 261-char remark
Show marketing remark (261 chars)
BIG TIME OPPORTUNITY FOR SERIOUS INVESTOR OR OWNER OCCUPANT. REMODELED W/ FRESH PAINT, NEW FLOORING & APPLIANCES. NEW ROOF 2011. NEW FURNACES & AC'S 2009. LG BDRMS, BEAUTIFUL SPACIOUS UNITS - EASY TO RENT! PREVIOUS TENANTS WERE LONG TERM $850 EACH UNIT.
-
2014-09-04$149,900 Active 261-char remark
Show marketing remark (261 chars)
BIG TIME OPPORTUNITY FOR SERIOUS INVESTOR OR OWNER OCCUPANT. REMODELED W/ FRESH PAINT, NEW FLOORING & APPLIANCES. NEW ROOF 2011. NEW FURNACES & AC'S 2009. LG BDRMS, BEAUTIFUL SPACIOUS UNITS - EASY TO RENT! PREVIOUS TENANTS WERE LONG TERM $850 EACH UNIT.
-
2014-09-04$149,900
Show marketing remark (261 chars)
BIG TIME OPPORTUNITY FOR SERIOUS INVESTOR OR OWNER OCCUPANT. REMODELED W/ FRESH PAINT, NEW FLOORING & APPLIANCES. NEW ROOF 2011. NEW FURNACES & AC'S 2009. LG BDRMS, BEAUTIFUL SPACIOUS UNITS - EASY TO RENT! PREVIOUS TENANTS WERE LONG TERM $850 EACH UNIT.
-
2009-02-26soldstatus $135,000
-
2008-08-11soldstatus $45,000
-
2008-07-25historical
-
2008-07-10$45,000
-
2006-11-28soldstatus $245,000
-
2006-11-18historical
-
2006-11-17soldstatus $245,000
-
2006-10-31$260,000
-
2005-04-21historical
-
2004-12-01$189,000
ⓘ Source: listings_history table (triggers on properties + properties_extension) + one-shot
backfill from property_details.listing_events for pre-trigger history.
Tax reassessment forecast MN · Partial reset (capped growth)
- Current annual tax
- $1,107 · $92/mo
- Projected year-2 tax
- $2,065 · $172/mo
- Expected delta
- +$958/yr (+$80/mo · 86.5%)
ⓘ Screening estimate from a state-policy table — verify with the county assessor before closing.
Climate risk First Street
- Flood 5/10 Major FEMA zone X (unshaded) · 48% chance over 30 yrs
- Wildfire 1/10 Low
- Heat 2/10 Low 7 d/yr ≥99°F today · 14 d/yr by 30 yrs out
- Wind 2/10 Low
- Air quality 2/10 Low 1 unhealthy d/yr today · 1 by 30 yrs out
Nearby sold comps map
Loading sold comps map…
Walkable amenities ~0.75 mi
Loading nearby amenities…
Taxation est. · year 1
- Rental income
- $45,804
- − Mortgage interest
- −$15,119
- − Property taxes
- −$1,107
- − Insurance
- −$1,350
- − Repairs & maintenance
- −$3,664
- − Management
- −$3,664
- − Depreciation
- −$7,852
- Taxable income
- $13,049
- Est. tax owed @ 24.0%
- −$3,132
- After-tax cash flow
- $13,612/yr
For passive investors: Depreciation is non-cash, so a rental often shows a tax loss while cash-flowing — sheltering income. Rental losses are passive: they offset passive income freely, and up to $25,000/yr can offset ordinary (W-2) income if you actively participate and your MAGI is under $100k (phasing out to $0 by $150k); unused losses carry forward. On sale, claimed depreciation is recaptured at up to 25%, and gains may owe capital-gains tax (a 1031 exchange can defer both). Figures are a year-1 estimate at your 24.0% rate — not tax advice; consult a CPA.
Schools (NCES district)
- District
- Minneapolis Public School District
- NCES district ID
- 2721240
- Math proficiency
- 35% ▼ -7.00%
- Reading proficiency
- 46% ▼ -1.00%
- Median HH income
- $50,521
- Composite
- 34.92/100
- National rank
- #5067
- State rank
- #217 of 301 in MN
Livability — Minneapolis
- Score
- 78/100
- State rank
- #110
- US rank
- #2525
Category grades
Schools grade is shown separately in the Schools card above.
Census & demographics
- Census place
- Minneapolis, MN
- County
- Hennepin County · 1,150,272 people
- City population
- 417,555
- Metro
- Minneapolis-St. Paul-Bloomington, MN-WI
- Population (ZIP)
- 27,741
- Household income
- $60,225
- Rent vs Own
- Severe rent burden
- 1826.0
Population outlook (Hennepin County) Hauer SSP2
- Today (2025)
- 1,405,227 people
- By 2030
- 1,492,650 · +6.2%
- By 2040
- 1,660,157 · +18.1%
- By 2050
- 1,823,498 · +29.8%
- By 2075
- 2,221,283 · +58.1%
- By 2100
- 2,509,976 · +78.6%
Race, ethnicity, and origin ACS 2023
- Neighborhood character
- Diverse neighborhood (Simpson 0.68)
- Race & ethnicity
- Black 49% White 23% Two or more races 11% Hispanic / Latino 11% Asian 9%
- Hispanic origin (detail)
- Mexican 7% Puerto Rican 1%
- Common ancestry
- Portuguese 3% Lithuanian 2% Italian 1%
- Foreign-born
- 19% · Canada, Guatemala
- Languages at home
- 68% English-only · Other Asian/Pacific 8% Spanish 8%
Political lean MEDSL · Hennepin
- 2024 margin
- Solid D (+42.6) · D 70.2% · R 27.5% · Other 2.3%
- 2008→2024 swing
- +14.0pp toward D · 2008: 28.6pp · 2024: 42.6pp
- All cycles
- 2024: D+42.6 2020: D+43.2 2016: D+35.3 2012: D+27.1 2008: D+28.6
Not yet ingested
- Civics
- —
Market trends
- HPI YoY
- ▼ -33.91%
- Current HPI
- 356.6758
- Rent YoY
- ▲ 7.35%
- Metro
- Minneapolis-St. Paul-Bloomington, MN-WI
- State GDP YoY
- ▲ 2.41%
- F500 in state
- 34
Industry mix (Fortune 500 HQ in MN)
| Industry | F500 HQs | Revenue |
|---|---|---|
| Healthcare | 2 | $407B |
|
||
| Retail | 2 | $150B |
|
||
| Consumer Goods | 2 | $32B |
|
||
| Industrial Machinery | 2 | $6B |
|
||
| Agriculture | 1 | $40B |
|
||
| Healthcare / Medical Devices | 1 | $32B |
|
||
Price history
+42.8% since first listed23 events — show timeline
- 2026-05-14 Price Changed $269,900 NORTHSTARMLS as Distributed by MLS Grid
- 2026-01-21 Relisted — NORTHSTARMLS as Distributed by MLS Grid
- 2025-12-17 Contingent — NORTHSTARMLS as Distributed by MLS Grid
- 2025-11-24 Listed $279,900 NORTHSTARMLS as Distributed by MLS Grid
- 2019-08-08 Sold (Public Records) $165,000 Public Records
- 2014-10-15 Sold (MLS) $149,900 LSAR
- 2014-10-15 Sold (MLS) $149,900 RASM
- 2014-10-15 Sold (MLS) $149,900 NORTHSTARMLS as Distributed by MLS Grid
- 2014-10-01 Pending — NORTHSTARMLS as Distributed by MLS Grid
- 2014-09-23 Contingent — NORTHSTARMLS as Distributed by MLS Grid
- 2014-09-04 Listed $149,900 NORTHSTARMLS as Distributed by MLS Grid
- 2014-09-04 Listed $149,900 LSAR
- 2014-09-04 Listed $149,900 RASM
- 2009-02-26 Sold (Public Records) $135,000 Public Records
- 2008-08-11 Sold (MLS) $45,000 NORTHSTARMLS as Distributed by MLS Grid
- 2008-07-25 Listing Removed — NORTHSTARMLS as Distributed by MLS Grid
- 2008-07-10 Listed $45,000 NORTHSTARMLS as Distributed by MLS Grid
- 2006-11-28 Sold (Public Records) $245,000 Public Records
- 2006-11-18 Listing Removed — NORTHSTARMLS as Distributed by MLS Grid
- 2006-11-17 Sold (MLS) $245,000 NORTHSTARMLS as Distributed by MLS Grid
- 2006-10-31 Listed $260,000 NORTHSTARMLS as Distributed by MLS Grid
- 2005-04-21 Listing Removed — NORTHSTARMLS as Distributed by MLS Grid
- 2004-12-01 Listed $189,000 NORTHSTARMLS as Distributed by MLS Grid
Property tax history
-3.5%/yrLatest (2025): $1,107 · -50.9% YoY. Source: county tax records.
Cash-flow waterfall
monthlySold comps — $/sqft
last 12 mo · ≤1 miLoading sold comps…