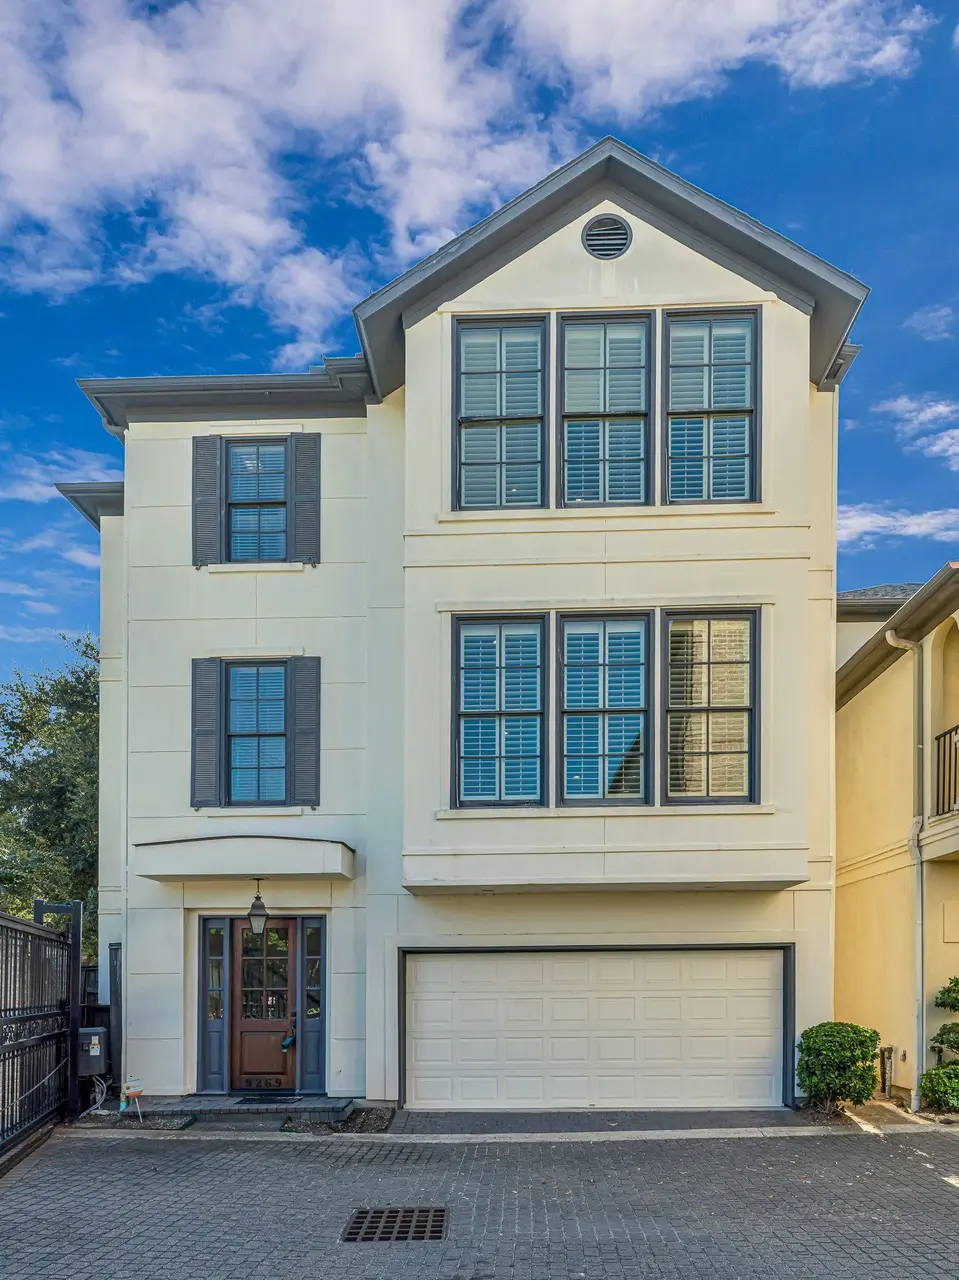
9269 Buffalo Speedway · Houston, TX
Flood risk 6/10 · Moderate
- FEMA flood zone
- X (shaded)
- Chance of flooding over 30 yrs
- 0.69%
- Est. flood insurance / yr
- $507 – $1,088
Fire risk 1/10 · Minimal
- Est. fire insurance / yr
- $1,222 – $2,270
Heat risk 9/10 · Severe
- Hot days now (above 109°F)
- 7 days/yr
- Hot days in 30 yrs
- 25 days/yr
Wind risk 9/10 · Severe
- Chance of severe wind over 30 yrs
- 99.0%
Air-quality risk 2/10 · Minimal
- Unhealthy air days now
- 2 days/yr
- Unhealthy air days in 30 yrs
- 2 days/yr
Risk factors via First Street. Map © Google.
Why this score? — see what drove the D- grade
The composite is a weighted blend of 9 inputs, each scored 0–100. Each bar is that input's sub-score; the figure is the points it added to the 100-point composite (weight × sub-score).
- ARV discount +11.9/15.0
- Cash flow +10.0/30.0
- 1% rule +4.8/10.0
- Livability +3.7/5.0
- DSCR +2.9/10.0
- Schools +2.7/10.0
- Condition / age +2.5/5.0
- Rent growth +1.5/5.0
- Appreciation +0.0/10.0
$425,000
🖨 Deal sheet (PDF) 📄 Offer letter ✓ Due diligence
Listing remarks MLS
MOTIVATED SELLER! MAKE US AN OFFER! Interior improvements just completed! New flooring and fresh interior paint. Professional cleaning coming soon. This exceptional property combines style, comfort, and convenience. Located in a gated subdivision with a security code for enhanced privacy, it offers easy access to highways 6–10, the Medical Center, downtown, and major sports venues. Inside, you'll find three generously sized bedrooms, three and a half bathrooms, and a dedicated home office. The layout is thoughtfully designed to balance functionality and comfort. Interior highlights include recently polished hardwood floors, granite countertops, stainless steel appliances, premium Brookhaven cabinetry with under cabinet lighting, and zoned air conditioning with thermostats on every level. Recent Updates: Outside A/C units replaced in 2018 Range replaced in 2017 The POA fee conveniently includes the water bill.
Key facts
- Gated subdivision
- Security code
- Granite countertops
Tags
Neighborhood map
What this means for you Summary
Snapshot
- This is a 3-bed/3.5-bath single-family listed at $425k.
Deal economics
- At list price, monthly cash flow is $-254 ($-3k/yr) — negative.
- To cash-flow at today's rent, offer at most $380k (10.6% below list).
- To meet the 1% rule (rent ≥ 1% of price), the offer needs to be $416k (2.2% below list).
- Recommended offer: $380k (10.6% below list) — sets the bar for cash-flow.
- Cap rate 5.6% vs local median 3.2% in Houston — top-decile yield for the area; either an underpriced asset or a hidden risk that comps aren't pricing in. Stress-test before assuming the spread holds.
Location & tenants
- Location reads 74/100 on livability (#184 in TX, #4,771 nationally) — a middle-class / working-renter tenant base. Strengths: amenities A+, cost of living A+, housing A+; Watch: crime F.
- Houston ISD (urban): math 27% / reading 35% proficiency, ranked #593 of 826 in TX (top 72%) — families likely to look elsewhere, expect single-tenant / working-renter base with shorter leases; 71% free/reduced lunch — lower-income household profile, screen leases tightly.
- Zoned schools: Longfellow El (math 12% / reading 27%, grade F, #3,583 of 4,322 statewide, top 86%, 682 students, 75% FRL); Pershing Middle (math 36% / reading 49%, grade D-, #553 of 1,662 statewide, top 34%, 1,390 students, 60% FRL); Bellaire H S (math 45% / reading 62%, grade C-, #428 of 1,632 statewide, top 27%, 3,170 students, 48% FRL).
- Market conditions: Rents falling (-3.9%/yr); 234 active listings in the ZIP; 9 comparable units currently listed for rent nearby; rentals lingering (median 46d on market — plan ~5-8 weeks vacancy on turnover, expect pricing pressure); 56% of comp listings sitting > 30 days — soft ceiling on asking rent; solid renter incomes; 29,883 units permitted in Harris County in 2024 (8,621 in 5+ unit buildings).
- At $4,155/mo this rent would consume 62% of the median local household income ($81k/yr) (locally 2502% of renters already pay >50% of income on rent) — very limited rent-growth headroom before tenants either downsize or default.
Forward outlook
- Local home prices are declining (-3.0%/yr); year-one equity from $3k of loan paydown is wiped out by about $13k of value loss. Plan a longer hold.
- Harris County population projected at +47% by 2050 — long-run rental-demand tailwind backs the buy-and-hold thesis.
Negotiation context
- It's been on market 88 days — a 6% lower offer ($400k) is reasonable based on typical stale-listing flexibility.
- 7 sale attempts since 17y ago with the ask held roughly flat each time — persistent listings suggest the price (not the market) is what's stuck; bring a comps-based counter.
Risks & watch-outs
- Watch-outs: property tax is 2.5% of price.
- Climate carrying-cost: major flood risk; severe wind risk, 99% chance of damaging wind over 30y; extreme-heat days projected 7→25/yr by 2055 (HVAC capex compounding) — expect insurance premiums to compound above CPI over the hold.
Questions for the listing agent
- What do current leases actually rent for vs. the listed asking? Can we see a recent rent roll and the last 12 months of T-12 income?
- It's been on market 88 days. Have you received any prior offers? Is the seller open to a 11% concession, seller financing, or rate buy-down credit?
- Property tax is high relative to price — has the assessment been appealed recently, and will the sale trigger a re-assessment?
- What does the HOA fee cover, when was the last increase, and are there any pending special assessments or reserve-fund shortfalls?
- Why hasn't it sold? Are there any deal-killer items the seller is aware of (foundation, flood, title, zoning, code violations)?
- Is there a deadline driving the sale (1031 exchange, divorce, estate, relocation)? That informs how much negotiation room exists.
- Schools are D-rated, which usually means shorter tenancies and higher turnover. Who's the typical renter profile here, and what's been the actual vacancy rate?
- Crime grade is F in this area — have there been break-ins, vandalism, or insurance claims at this property in the last 3 years? What carrier currently insures it and at what premium?
- The area grade is low — what's the realistic commute time and amenity access for the typical tenant pool here? Any planned neighborhood developments (good or bad) we should know about?
- What's the average days-on-market for RENTAL listings here right now (not sales)? A rising rental-DOM trend means longer vacancies and softer asking-rent achievability than the comps imply.
- What's the recent tenant-quality profile in this submarket — average credit score on applications, eviction rate, late-payment / NSF rate, and stable-employment percentage? A property-management company in the area should have these aggregated.
- How much new for-sale + rental construction is in the pipeline within 1–3 miles? Heavy new supply typically softens prices + rents 12–24 months out; constrained supply supports both.
Investment metrics
- 1% rule
- 0.98% ✗
- Cap rate
- 5.57%
- Cash-on-cash
- -2.57%
- DSCR
- 0.89
- GRM
- 8.5
CMA / ARV
- ARV (median comp)
- $470,919
- List price
- $425,000
- Delta
- -9.75%
- Verdict
- FAIR
- Comps
- 20 within 1.0 mi
Show comp detail 12 sales within ~0.75 mi
| Address | Dist | Beds/Ba | Sqft | Sold | Price | $/sf | Match |
|---|---|---|---|---|---|---|---|
| 9281 Buffalo Speedway | 0.03mi | 3/3.5 | 2,731 (+1%) | 3mo | $449,900 | $165 | 95 |
| 3227 N Pemberton Circle Dr | 0.22mi | 4/3.5 (+1) | 2,782 (+3%) | 1mo | $534,500 | $192 | 79 |
| 3427 Gannett St | 0.30mi | 4/3.0 (+1) | 2,650 (-2%) | 1mo | $675,000 | $255 | 75 |
| 3219 N Pemberton Circle Dr | 0.20mi | 4/3.5 (+1) | 2,861 (+6%) | 4mo | $500,000 | $175 | 72 |
| 3115 Castlewood St | 0.35mi | 3/2.5 | 2,612 (-4%) | 8mo | $995,000 | $381 | 67 |
| 3641 Timberside Circle Dr | 0.54mi | 3/2.5 | 2,765 (+2%) | 7mo | $625,000 | $226 | 62 |
| 3510 N Braeswood Blvd | 0.65mi | 3/2.5 | 2,797 (+3%) | 1mo | $450,000 | $161 | 60 |
| 8707 Linkmeadow Ln | 0.66mi | 4/3.0 (+1) | 2,708 (-0%) | 7mo | $750,000 | $277 | 56 |
| 9910 Orchard Ct | 0.68mi | 3/3.5 | 2,540 (-6%) | 4mo | $350,000 | $138 | 54 |
| 3026 Fairhope St | 0.44mi | 3/2.5 | 2,356 (-13%) | 4mo | $366,000 | $155 | 51 |
| 3715 Latma Dr | 0.72mi | 4/3.0 (+1) | 2,620 (-3%) | 5mo | $479,000 | $183 | 50 |
| 9210 Linkmeadow Ln | 0.70mi | 3/2.0 | 2,391 (-12%) | 8mo | $629,000 | $263 | 35 |
Match score weights: distance 35% · size 25% · config 20% · recency 20%. Top-matched comps best support the ARV.
Projected returns pro-forma
-3.0% appreciation · 0.0% rent growth · sell at horizon
- IRR
- -24.6%
- Equity multiple
- 0.19×
- Total profit
- $-96,819
- Equity at exit
- $63,369
- IRR
- -36.8%
- Equity multiple
- -0.26×
- Total profit
- $-150,482
- Equity at exit
- $36,746
Cash invested: $119,000 (down + closing). Projections, not guarantees.
Landlord ↔ Tenant lean methodology
- Overall (STATE)
- 87 Strongly Landlord-Friendly
- State Texas
- 87 Strongly Landlord-Friendly · R+5
- County
- — inherits STATE
- City
- — inherits STATE
ZIP-level market 77025
- Rents YoY
- -3.9%
- Active inventory
- 234
- Price-to-rent
- 8.5×
Monthly cashflow live
- Estimated rent
- $4,155 high interval (Pro) →
- Mortgage (P&I)
- −$2,229
- Tax from tax record
- −$889 /mo · $10,670/yr
- Insurance
- −$177
- HOA
- −$242
- Vacancy / Maint / Mgmt
- −$873
- Net cashflow
- $-254
Break-even live
Sensitivity live
| Price | -10% $-14 | -5% $-134 | +0% $-254 | +5% $-375 | +10% $-495 |
|---|---|---|---|---|---|
| Rent | -10% $-583 | -5% $-419 | +0% $-254 | +5% $-90 | +10% $74 |
| Rate | -1.0pp $-40 | -0.5pp $-146 | base $-254 | +0.5pp $-365 | +1.0pp $-477 |
UW: 25.0% down · 7.5% · 30yr · 1.5% tax · 5.0% vac · 8.0% maint · 8.0% mgmt
Financing live
Cash to close
- Down payment
- $106,250
- Closing costs
- $12,750
- Reserves months
- —
- Total cash needed
- —
Loan-product check · same deal, 3 products live
Conventional
25% down · 7.5% · 30yr
- Down + closing
- —
- Monthly P&I
- —
- Monthly cashflow
- —
- DSCR
- —
- Eligible?
- —
Personal DTI + credit; lowest rate.
DSCR
20% down · 8.5% · 30yr
- Down + closing
- —
- Monthly P&I
- —
- Monthly cashflow
- —
- DSCR
- —
- Eligible?
- —
No personal income docs; deal must DSCR.
Hard money
10% down · 12.0% · 12mo
- Down + closing
- —
- Monthly P&I
- —
- Monthly cashflow
- —
- DSCR
- —
- Eligible?
- —
Short-term bridge; refi at stabilization.
Rent comps 9 comps
| Address | Beds | Baths | Sqft | Rent | $/sqft | DOM | Units | Dist |
|---|---|---|---|---|---|---|---|---|
| 8314 Greenbush St Unit 1019557P Houston, TX | 3.0 | 2.0 | 1948 | $16,712 | $8.58 | 26d | 1 | 0.45mi |
| 8314 Greenbush St Houston, TX | 3.0 | 2.0 | 1952 | $9,500 | $4.87 | 45d | 1 | 0.45mi |
| 9715 Riddlewood Ln Houston, TX | 3.0 | 4.0 | 2285 | $3,200 | $1.40 | 45d | 1 | 0.85mi |
| 3838 N Braeswood Blvd Houston, TX | 1.0–3.0 | 1.0–2.0 | 1266 | $3,213 | $2.54 | 3d | 35 | 0.88mi |
| 9016 Bayview Cove Dr Houston, TX | 3.0 | 3.0 | 2245 | $4,200 | $1.87 | 20d | 1 | 0.97mi |
| 7510 Brompton Rd Houston, TX | 1.0–3.0 | 1.0–2.0 | 1338 | $2,775 | $2.07 | 0d | 162 | 0.98mi |
| 3027 Blue Bonnet Blvd Houston, TX | 3.0 | 2.0 | 2045 | $2,730 | $1.33 | 45d | 1 | 1.06mi |
| 9306 Bassoon Dr Unit 1024979P Houston, TX | 4.0 | 2.0 | 1819 | $13,361 | $7.35 | 45d | 1 | 1.31mi |
| 9306 Bassoon Dr Houston, TX | 4.0 | 2.0 | 1824 | $9,750 | $5.35 | 45d | 1 | 1.31mi |
HOA detail
- Monthly dues
- $242 · $2,904/yr
- Likely covers
- watersecurity
Listing history 36 events
-
2026-06-21days on market $425,000 Active 88 DOM
-
2026-06-18days on market $425,000 Active 85 DOM
-
2026-06-17days on market $425,000 Active 84 DOM
-
2026-06-16days on market $425,000 Active 83 DOM
-
2026-06-15price $425,000 Active 82 DOM
-
2026-06-15days on market $445,000 Active 82 DOM
-
2026-06-13days on market $445,000 Active 80 DOM
-
2026-06-10days on market $445,000 Active 76 DOM
-
2026-06-08days on market $445,000 Active 75 DOM
-
2026-06-07days on market $445,000 Active 74 DOM
-
2026-06-04days on market $445,000 Active 71 DOM
-
2026-06-01days on market $445,000 Active 68 DOM
-
2026-05-31days on market $445,000 Active 67 DOM
-
2026-03-25$445,000 Active 934-char remark
Show marketing remark (934 chars)
MOTIVATED SELLER! MAKE US AN OFFER! Interior improvements just completed! New flooring and fresh interior paint. Professional cleaning coming soon. This exceptional property combines style, comfort, and convenience. Located in a gated subdivision with a security code for enhanced privacy, it offers easy access to highways 6–10, the Medical Center, downtown, and major sports venues. Inside, you'll find three generously sized bedrooms, three and a half bathrooms, and a dedicated home office. The layout is thoughtfully designed to balance functionality and comfort. Interior highlights include recently polished hardwood floors, granite countertops, stainless steel appliances, premium Brookhaven cabinetry with under cabinet lighting, and zoned air conditioning with thermostats on every level. Recent Updates: Outside A/C units replaced in 2018 Range replaced in 2017 The POA fee conveniently includes the water bill.
-
2026-02-19historical
-
2025-12-26price $445,000
-
2025-09-10price $465,000
-
2025-07-26price $475,000
-
2025-05-31price $490,000
-
2025-05-31$499,000 Active
-
2025-05-30historical
-
2025-02-12price $499,500
-
2024-12-11$525,000 Active
-
2013-09-30soldstatus
-
2013-09-27soldstatus Sold
-
2013-08-04status Pending, Continue to Show
-
2013-07-22status Option Pending
-
2013-07-10status Active
-
2013-06-26status Option Pending
-
2013-05-31$399,000 Active
-
2009-12-28soldstatus
-
2009-12-21soldstatus
-
2009-11-06historical
-
2009-08-13$395,000
-
2009-08-10historical
-
2009-04-02$399,900
ⓘ Source: listings_history table (triggers on properties + properties_extension) + one-shot
backfill from property_details.listing_events for pre-trigger history.
Tax reassessment forecast TX · Resets to sale price
- Current annual tax
- $10,670 · $889/mo
- Projected year-2 tax
- $10,670 · $889/mo
- Expected delta
- $0/yr ($0/mo · 0.0%)
ⓘ Screening estimate from a state-policy table — verify with the county assessor before closing.
Climate risk First Street
- Flood 6/10 Major FEMA zone X (shaded) · 69% chance over 30 yrs
- Wildfire 1/10 Low
- Heat 9/10 Extreme 7 d/yr ≥109°F today · 25 d/yr by 30 yrs out
- Wind 9/10 Extreme 99% chance of damaging wind over 30 yrs
- Air quality 2/10 Low 2 unhealthy d/yr today · 2 by 30 yrs out
Nearby sold comps map
Loading sold comps map…
Walkable amenities ~0.75 mi
Loading nearby amenities…
Taxation est. · year 1
- Rental income
- $49,862
- − Mortgage interest
- −$23,807
- − Property taxes
- −$10,670
- − Insurance
- −$2,125
- − Repairs & maintenance
- −$3,989
- − Management
- −$3,989
- − HOA
- −$2,904
- − Depreciation
- −$12,364
- Taxable loss
- −$9,985
- Est. tax savings @ 24.0%
- +$2,396
- After-tax cash flow
- $-657/yr
For passive investors: Depreciation is non-cash, so a rental often shows a tax loss while cash-flowing — sheltering income. Rental losses are passive: they offset passive income freely, and up to $25,000/yr can offset ordinary (W-2) income if you actively participate and your MAGI is under $100k (phasing out to $0 by $150k); unused losses carry forward. On sale, claimed depreciation is recaptured at up to 25%, and gains may owe capital-gains tax (a 1031 exchange can defer both). Figures are a year-1 estimate at your 24.0% rate — not tax advice; consult a CPA.
Schools (NCES district)
- District
- Houston ISD
- NCES district ID
- 4823640
- Math proficiency
- 27% ▼ -18.00%
- Reading proficiency
- 35% ▼ -6.00%
- Median HH income
- $46,054
- Composite
- 26.63/100
- National rank
- #7173
- State rank
- #593 of 826 in TX
Livability — Houston
- Score
- 74/100
- State rank
- #184
- US rank
- #4771
Category grades
Schools grade is shown separately in the Schools card above.
Census & demographics
- Census place
- Houston, TX
- County
- Harris County · 4,702,590 people
- City population
- 3,226,434
- Metro
- Houston-The Woodlands-Sugar Land, TX
- Population (ZIP)
- 29,715
- Household income
- $81,008
- Rent vs Own
- Severe rent burden
- 2502.0
Population outlook (Harris County) Hauer SSP2
- Today (2025)
- 5,571,493 people
- By 2030
- 6,089,821 · +9.3%
- By 2040
- 7,142,806 · +28.2%
- By 2050
- 8,185,864 · +46.9%
- By 2075
- 10,574,329 · +89.8%
- By 2100
- 12,109,958 · +117.4%
Race, ethnicity, and origin ACS 2023
- Neighborhood character
- Highly diverse neighborhood (Simpson 0.74)
- Race & ethnicity
- White 42% Hispanic / Latino 20% Asian 17% Black 15% Two or more races 13% Native American 1%
- Hispanic origin (detail)
- Mexican 11%
- Common ancestry
- Slovak 3% Lithuanian 2% Romanian 2%
- Foreign-born
- 29% · Canada, China, Vietnam
- Languages at home
- 60% English-only · Spanish 16% Other Indo-European 7% Chinese 6%
Political lean MEDSL · Harris
- 2024 margin
- Lean D (+5.5) · D 52.0% · R 46.4% · Other 1.6%
- 2008→2024 swing
- +3.9pp toward D · 2008: 1.6pp · 2024: 5.5pp
- All cycles
- 2024: D+5.5 2020: D+13.3 2016: D+12.4 2012: D+0.1 2008: D+1.6
Not yet ingested
- Civics
- —
Market trends
- HPI YoY
- ▼ -363.31%
- Current HPI
- 187.5872
- Rent YoY
- ▼ -3.93%
- Metro
- Houston-The Woodlands-Sugar Land, TX
- State GDP YoY
- ▲ 3.95%
- F500 in state
- 110
Industry mix (Fortune 500 HQ in TX)
| Industry | F500 HQs | Revenue |
|---|---|---|
| Energy | 16 | $1,198B |
|
||
| Technology | 5 | $198B |
|
||
| Engineering / Construction | 4 | $72B |
|
||
| Energy Services | 3 | $60B |
|
||
| Utilities | 3 | $41B |
|
||
| Healthcare | 2 | $330B |
|
||
Price history
+11.3% since first listed23 events — show timeline
- 2026-03-25 Listed $445,000 HARMLS
- 2026-02-19 Listing Removed — HARMLS
- 2025-12-26 Price Changed $445,000 HARMLS
- 2025-09-10 Price Changed $465,000 HARMLS
- 2025-07-26 Price Changed $475,000 HARMLS
- 2025-05-31 Price Changed $490,000 HARMLS
- 2025-05-31 Listed $499,000 HARMLS
- 2025-05-30 Listing Removed — HARMLS
- 2025-02-12 Price Changed $499,500 HARMLS
- 2024-12-11 Listed $525,000 HARMLS
- 2013-09-30 Sold (Public Records) — Public Records
- 2013-09-27 Sold (MLS) — HARMLS
- 2013-08-04 Pending — HARMLS
- 2013-07-22 Pending — HARMLS
- 2013-07-10 Relisted — HARMLS
- 2013-06-26 Pending — HARMLS
- 2013-05-31 Listed $399,000 HARMLS
- 2009-12-28 Sold (Public Records) — Public Records
- 2009-12-21 Sold (MLS) — HARMLS
- 2009-11-06 Listing Removed — HARMLS
- 2009-08-13 Listed $395,000 HARMLS
- 2009-08-10 Listing Removed — HARMLS
- 2009-04-02 Listed $399,900 HARMLS
Property tax history
+3.6%/yrLatest (2025): $10,670 · +2.9% YoY. Source: county tax records.
Cash-flow waterfall
monthlySold comps — $/sqft
last 12 mo · ≤1 miLoading sold comps…