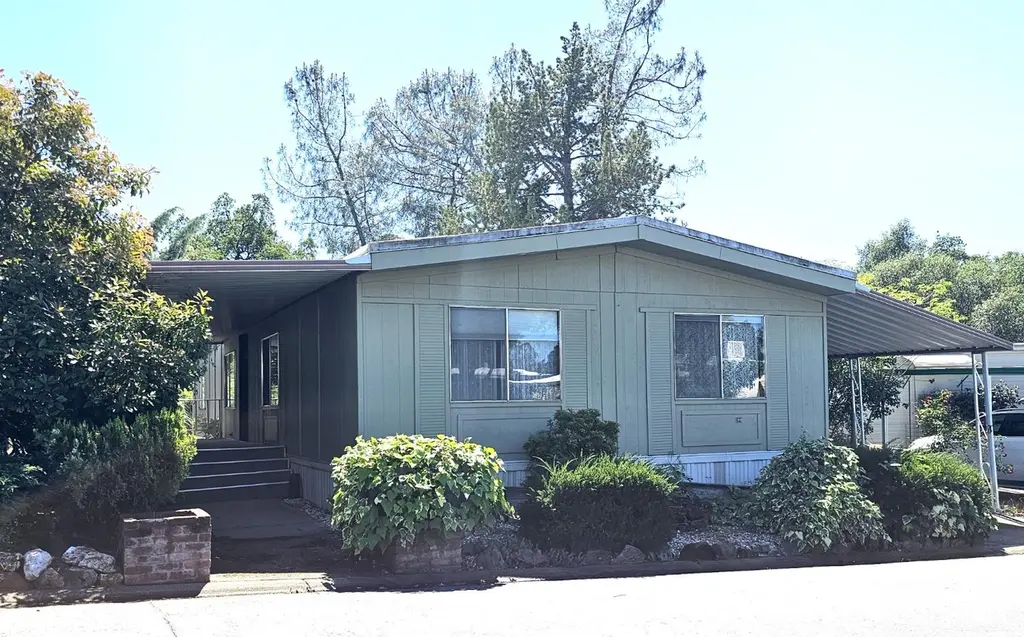
12104 Hemlock Dr · North Auburn, CA
Flood risk 1/10 · Minimal
- FEMA flood zone
- X (unshaded)
- Chance of flooding over 30 yrs
- 0.0%
- Est. flood insurance / yr
- $507 – $1,088
Fire risk 10/10 · Severe
- Est. fire insurance / yr
- $659 – $1,223
Heat risk 6/10 · Moderate
- Hot days now (above 99°F)
- 5 days/yr
- Hot days in 30 yrs
- 12 days/yr
Wind risk 1/10 · Minimal
- Chance of severe wind over 30 yrs
- —
Air-quality risk 10/10 · Severe
- Unhealthy air days now
- 34 days/yr
- Unhealthy air days in 30 yrs
- 41 days/yr
Risk factors via First Street. Map © Google.
Why this score? — see what drove the C+ grade
The composite is a weighted blend of 9 inputs, each scored 0–100. Each bar is that input's sub-score; the figure is the points it added to the 100-point composite (weight × sub-score).
- Cash flow +30.0/30.0
- 1% rule +10.0/10.0
- DSCR +10.0/10.0
- Schools +4.9/10.0
- Rent growth +3.1/5.0
- Livability +3.1/5.0
- Condition / age +2.2/5.0
- ARV discount +0.2/15.0
- Appreciation +0.0/10.0
$139,000
🖨 Deal sheet 📄 Offer letter ✓ Due diligence
Listing remarks
Welcome to this spacious 1,440 sq ft manufactured home located in the desirable Woodside Village 55+ senior community. This 3-bedroom, 2-bath layout offers excellent potential for buyers looking to bring their vision and make it their own. Inside, you'll find a comfortable living room with a fireplace and a separate family room featuring a built-in wet bar, a great foundation for creating warm and inviting living spaces with your personal updates. Enjoy the charm of the covered front porch, and make the most of the private area at the rear of the home, a great spot for gardening, outdoor seating, or quiet relaxation. This home offers a fantastic chance to add your personal touch and build e
Key facts
- Covered front porch
- Private area at rear
- Pool
Tags
Property features AI
Finance
- Other: Directions: Highway 49 to Luther Road; left into Woodside Village; continue to first stop sign; left on Hemlock; property is on the left; guest parking nearby.
- Financial info: Land lease: No (listed land lease amount present)
- HOA & community: No homeowners association; Senior community
Exterior
- Parking: Attached parking; Covered parking; Boat storage; Guest parking available
- Utilities: Individual electric meter; Natural gas connected; Public water; Public sewer
- Home design: Manufactured home (double wide) located in a park; Golden West make; Vinyl skirting; Built in 1976
- Construction: Elastomeric roof
- Exterior features: Carport awning; Porch awning; Storage area; Storage shed(s); Greenbelt nearby; See remarks for additional lot details
Interior
- Kitchen: Built-in electric oven; Gas cook top; Range hood; Ice maker; Dishwasher; Double oven; Pantry closet; Laminate countertops
- Bedrooms: 3 bedrooms (including master bedroom)
- Flooring: Carpet; Linoleum
- Bathrooms: 2 full bathrooms; Sunken tub; Tub with shower over; Shower stall(s)
- Heating & cooling: Central heating; Fireplace(s) (wood burning, living room); Ceiling fan(s); Central cooling
- Interior features: Wet bar; Carpeted porch; Porch
- Laundry & utility: Washer and dryer included; Laundry room inside; 220V outlet in laundry
Neighborhood map
What this means for you Summary
Snapshot
- This is a 3-bed/2.0-bath manufactured listed at $139k. Condition is rated fair.
Deal economics
- At list price, monthly cash flow is $1k ($13k/yr) — positive.
- The deal already cash-flows at list — no discount required.
- Meets the 1% rule at list price ($3k rent vs $139k).
- Recommended offer: $131k (6.0% below list) — sets the bar for market timing.
- Cap rate 15.5% vs local median 2.6% in North Auburn — top-decile yield for the area; either an underpriced asset or a hidden risk that comps aren't pricing in. Stress-test before assuming the spread holds.
Location & tenants
- Location reads 61/100 on livability (#519 in CA) — a middle-class / working-renter tenant base. Strengths: employment A-, housing A-; Watch: schools F, crime D-, amenities F.
- Placer Union High (suburban): math 39% / reading 72% proficiency, ranked #98 of 517 in CA (top 19%) — acceptable for families but not a draw, mixed tenant base, ~2y average lease.
- Market conditions: Rents rising (+2.3%/yr); 204 active listings in the ZIP; 2 comparable units currently listed for rent nearby; solid renter incomes; 3,535 units permitted in Placer County in 2024 (689 in 5+ unit buildings).
- This rent runs 36% of the median local income ($85k/yr) — at the standard rent-burdened threshold; future hikes will face affordability resistance.
Forward outlook
- Local home prices are declining (-3.0%/yr); year-one equity from $961 of loan paydown is wiped out by about $4k of value loss. Plan a longer hold.
- Placer County population projected at +20% by 2050 — long-run rental-demand tailwind backs the buy-and-hold thesis.
- At projected returns (-3.0% appreciation + 2.3% rent growth), your $39k cash investment doubles in ~4 years — after that, you're playing with house money.
Negotiation context
- It's been on market 72 days — a 6% lower offer ($131k) is reasonable based on typical stale-listing flexibility.
Risks & watch-outs
- Climate carrying-cost: severe wildfire risk; extreme-heat days projected 5→12/yr by 2055 (HVAC capex compounding) — expect insurance premiums to compound above CPI over the hold.
Questions for the listing agent
- It's been on market 72 days. Have you received any prior offers? Is the seller open to a 6% concession, seller financing, or rate buy-down credit?
- Have any recent inspections been done? Can we get a copy of the seller's disclosures and any deferred-maintenance estimates?
- Built in 1976 — when were the roof, HVAC, electrical panel, plumbing, and water heater last replaced?
- Why hasn't it sold? Are there any deal-killer items the seller is aware of (foundation, flood, title, zoning, code violations)?
- Is there a deadline driving the sale (1031 exchange, divorce, estate, relocation)? That informs how much negotiation room exists.
- Schools are F-rated, which usually means shorter tenancies and higher turnover. Who's the typical renter profile here, and what's been the actual vacancy rate?
- Crime grade is D in this area — have there been break-ins, vandalism, or insurance claims at this property in the last 3 years? What carrier currently insures it and at what premium?
- What's the average days-on-market for RENTAL listings here right now (not sales)? A rising rental-DOM trend means longer vacancies and softer asking-rent achievability than the comps imply.
- What's the recent tenant-quality profile in this submarket — average credit score on applications, eviction rate, late-payment / NSF rate, and stable-employment percentage? A property-management company in the area should have these aggregated.
- How much new for-sale + rental construction is in the pipeline within 1–3 miles? Heavy new supply typically softens prices + rents 12–24 months out; constrained supply supports both.
Investment metrics
- 1% rule
- 1.85% ✓
- Cap rate
- 15.54%
- Cash-on-cash
- 33.03%
- DSCR
- 2.47
- GRM
- 4.5
CMA / ARV
- ARV (on-the-fly)
- $119,520
- Comps found
- 12
Show comp detail 12 sales within ~0.75 mi
| Address | Dist | Beds/Ba | Sqft | Sold | Price | $/sf | Match |
|---|---|---|---|---|---|---|---|
| 1564 Cottonwood Cir | 0.09mi | 3/2.0 | 1,440 (0%) | 9mo | $95,000 | $66 | 89 |
| 12326 Pepperwood Cir #200 | 0.24mi | 2/2.0 (-1) | 1,440 (0%) | 1mo | $165,000 | $115 | 83 |
| 12318 Pepperwood Cir #228 | 0.22mi | 2/2.0 (-1) | 1,440 (0%) | 3mo | $115,000 | $80 | 82 |
| 12369 Pepperwood Cir | 0.15mi | 2/2.0 (-1) | 1,440 (0%) | 8mo | $130,000 | $90 | 81 |
| 1605 Grass Valley Hwy #62 | 0.30mi | 2/2.0 (-1) | 1,440 (0%) | 1mo | $55,000 | $38 | 80 |
| 12019 Hemlock Dr #150 | 0.05mi | 3/2.0 | 1,344 (-7%) | 9mo | $121,000 | $90 | 79 |
| 12180 Laurel Dr | 0.05mi | 3/2.0 | 1,560 (+8%) | 9mo | $129,000 | $83 | 76 |
| 12339 Pepperwood #12339 | 0.17mi | 2/2.0 (-1) | 1,344 (-7%) | 2mo | $112,000 | $83 | 74 |
| 1605 Grass Valley Hwy #73 | 0.30mi | 3/2.0 | 1,536 (+7%) | 5mo | $110,000 | $72 | 71 |
| 5 Lily Ave | 0.47mi | 3/2.0 | 1,440 (0%) | 9mo | $39,900 | $28 | 71 |
| 1605 Grass Valley Hwy #46 | 0.30mi | 2/2.0 (-1) | 1,344 (-7%) | 2mo | $47,000 | $35 | 68 |
| 12366 Pepperwood Cir #182 | 0.13mi | 2/2.0 (-1) | 1,248 (-13%) | 3mo | $110,000 | $88 | 64 |
Match score weights: distance 35% · size 25% · config 20% · recency 20%. Top-matched comps best support the ARV.
Projected returns pro-forma
-3.0% appreciation · 2.34% rent growth · sell at horizon
- IRR
- 27.5%
- Equity multiple
- 2.13×
- Total profit
- $44,057
- Equity at exit
- $20,725
- IRR
- 34.6%
- Equity multiple
- 4.07×
- Total profit
- $119,520
- Equity at exit
- $12,018
Cash invested: $38,920 (down + closing). Projections, not guarantees.
Landlord ↔ Tenant lean methodology
- Overall (STATE)
- 18 Strongly Tenant-Friendly
- State California
- 18 Strongly Tenant-Friendly · D+13
- County
- — inherits STATE
- City
- — inherits STATE
ZIP-level market 95603
- Rents YoY
- 2.3%
- Active inventory
- 204
- Price-to-rent
- 4.5×
Monthly cashflow live
- Estimated rent
- $2,572 medium interval (Pro) →
- Mortgage (P&I)
- −$729
- Tax est. 1.5%
- −$174 /mo · $2,085/yr
- Insurance
- −$58
- HOA
- −$0
- Vacancy / Maint / Mgmt
- −$540
- Net cashflow
- $1,071
Break-even live
UW: 25.0% down · 7.5% · 30yr · 1.5% tax · 5.0% vac · 8.0% maint · 8.0% mgmt
Financing live
Cash to close
- Down payment
- $34,750
- Closing costs
- $4,170
- Reserves months
- —
- Total cash needed
- —
Loan-product check · same deal, 3 products live
Conventional
25% down · 7.5% · 30yr
- Down + closing
- —
- Monthly P&I
- —
- Monthly cashflow
- —
- DSCR
- —
- Eligible?
- —
Personal DTI + credit; lowest rate.
DSCR
20% down · 8.5% · 30yr
- Down + closing
- —
- Monthly P&I
- —
- Monthly cashflow
- —
- DSCR
- —
- Eligible?
- —
No personal income docs; deal must DSCR.
Hard money
10% down · 12.0% · 12mo
- Down + closing
- —
- Monthly P&I
- —
- Monthly cashflow
- —
- DSCR
- —
- Eligible?
- —
Short-term bridge; refi at stabilization.
Rent comps 2 comps
| Address | Beds | Baths | Sqft | Rent | $/sqft | DOM | Units | Dist |
|---|---|---|---|---|---|---|---|---|
| 630 Shockley Rd Auburn, CA | 3.0 | 2.0 | 1100 | $2,495 | $2.27 | 1d | 1 | 0.99mi |
| 731 Mikkelsen Dr Auburn, CA | 2.0 | 2.0 | 1006 | $2,150 | $2.14 | 1d | 1 | 1.42mi |
Listing history 13 events
-
2026-06-18days on market $139,000 Active 72 DOM
-
2026-06-17days on market $139,000 Active 71 DOM
-
2026-06-16days on market $139,000 Active 70 DOM
-
2026-06-15days on market $139,000 Active 69 DOM
-
2026-06-13days on market $139,000 Active 67 DOM
-
2026-06-13days on market $139,000 Active 66 DOM
-
2026-06-09days on market $139,000 Active 63 DOM
-
2026-06-08days on market $139,000 Active 62 DOM
-
2026-06-07days on market $139,000 Active 61 DOM
-
2026-06-03days on market $139,000 Active 57 DOM
-
2026-06-02days on market $139,000 Active 56 DOM
-
2026-06-01days on market $139,000 Active 55 DOM
-
2026-05-31days on market $139,000 Active 54 DOM
ⓘ Source: listings_history table (triggers on properties + properties_extension) + one-shot
backfill from property_details.listing_events for pre-trigger history.
Climate risk First Street
- Flood 1/10 Low FEMA zone X (unshaded) · 0% chance over 30 yrs
- Wildfire 10/10 Extreme
- Heat 6/10 Major 5 d/yr ≥99°F today · 12 d/yr by 30 yrs out
- Wind 1/10 Low
- Air quality 10/10 Extreme 34 unhealthy d/yr today · 41 by 30 yrs out
Nearby sold comps map
Loading sold comps map…
Walkable amenities ~0.75 mi
Loading nearby amenities…
Taxation est. · year 1
- Rental income
- $30,866
- − Mortgage interest
- −$7,786
- − Property taxes
- −$2,085
- − Insurance
- −$695
- − Repairs & maintenance
- −$2,469
- − Management
- −$2,469
- − Depreciation
- −$4,044
- Taxable income
- $11,318
- Est. tax owed @ 24.0%
- −$2,716
- After-tax cash flow
- $10,141/yr
For passive investors: Depreciation is non-cash, so a rental often shows a tax loss while cash-flowing — sheltering income. Rental losses are passive: they offset passive income freely, and up to $25,000/yr can offset ordinary (W-2) income if you actively participate and your MAGI is under $100k (phasing out to $0 by $150k); unused losses carry forward. On sale, claimed depreciation is recaptured at up to 25%, and gains may owe capital-gains tax (a 1031 exchange can defer both). Figures are a year-1 estimate at your 24.0% rate — not tax advice; consult a CPA.
Condition & rehab AI · 12 photos
This 3-bedroom, 2-bath manufactured home in Woodside Village 55+ senior community requires moderate renovations to improve its condition and value. Key updates include replacing dated kitchen and bathroom fixtures, updating the interior walls, and replacing the carpeting. The home's location and amenities make it a good investment opportunity.
Repairs flagged
- Moderate kitchen cabinets — dated and in need of replacement
- Major bathroom cabinets — severely dated and in poor condition
- Major bathroom flooring — dated and in poor condition
- Moderate kitchen countertops — dated and in need of replacement
- Major bathroom fixtures — dated and in poor condition
Value-add opportunities
- Both update kitchen cabinets and countertops — modernizing the kitchen would improve both resale and rental value
- Both replace bathroom cabinets and fixtures — modernizing the bathroom would improve both resale and rental value
- Both paint interior walls — painting the interior walls would improve the home's curb appeal and value
- Both replace carpeting — replacing the carpeting would improve the home's curb appeal and value
- Both repair/replace windows — repairing or replacing the windows would improve the home's energy efficiency and value
Renovation cost estimate screening
| Repair item | Severity | Est. cost |
|---|---|---|
| kitchen cabinets · dated and in need of replacement | Moderate | $3,000–15,000 |
| bathroom cabinets · severely dated and in poor condition | Major | $15,000–50,000 |
| bathroom flooring · dated and in poor condition | Major | $15,000–50,000 |
| kitchen countertops · dated and in need of replacement | Moderate | $3,000–15,000 |
| bathroom fixtures · dated and in poor condition | Major | $15,000–50,000 |
| Total estimated repair cost · 5 items | $51,000–180,000 |
Value-add ROI direction
- Both update kitchen cabinets and countertops — modernizing the kitchen would improve both resale and rental value ↑
- Both replace bathroom cabinets and fixtures — modernizing the bathroom would improve both resale and rental value ↑
- Both paint interior walls — painting the interior walls would improve the home's curb appeal and value ↑
- Both replace carpeting — replacing the carpeting would improve the home's curb appeal and value ↑
- Both repair/replace windows — repairing or replacing the windows would improve the home's energy efficiency and value ↑
ⓘ Cost ranges are severity-bucket heuristics (US national rule-of-thumb). Get contractor quotes + a written scope before underwriting a rehab budget.
Schools (NCES district)
- District
- Placer Union High
- NCES district ID
- 0630750
- Math proficiency
- 39% ▲ 1.00%
- Reading proficiency
- 72% ▲ 3.00%
- Median HH income
- $69,119
- Composite
- 49.04/100
- National rank
- #2060
- State rank
- #98 of 517 in CA
Livability — North Auburn
- Score
- 61/100
- State rank
- #519
- US rank
- #17512
Category grades
Schools grade is shown separately in the Schools card above.
Census & demographics
- Census place
- North Auburn, CA
- County
- Placer County · 390,510 people
- City population
- 28,195
- Metro
- Sacramento-Roseville-Folsom, CA
- Population (ZIP)
- 28,432
- Household income
- $85,357
- Rent vs Own
- Severe rent burden
- 1017.0
Population outlook (Placer County) Hauer SSP2
- Today (2025)
- 422,709 people
- By 2030
- 444,249 · +5.1%
- By 2040
- 480,192 · +13.6%
- By 2050
- 506,390 · +19.8%
- By 2075
- 550,219 · +30.2%
- By 2100
- 547,760 · +29.6%
Race, ethnicity, and origin ACS 2023
- Neighborhood character
- Predominantly White (73%)
- Race & ethnicity
- White 73% Hispanic / Latino 17% Two or more races 11% Asian 3%
- Hispanic origin (detail)
- Mexican 12%
- Common ancestry
- Italian 3% Slovak 3% Lithuanian 2%
- Foreign-born
- 9% · Canada, South Korea
- Languages at home
- 88% English-only · Spanish 10% Other Indo-European 1% Tagalog/Filipino 1%
Political lean MEDSL · Placer
- 2024 margin
- Lean R (+8.5) · D 44.3% · R 52.8% · Other 2.9%
- 2008→2024 swing
- +2.8pp toward D · 2008: -11.3pp · 2024: -8.5pp
- All cycles
- 2024: R+8.5 2020: R+6.7 2016: R+11.3 2012: R+20.1 2008: R+11.3
Not yet ingested
- Civics
- —
Market trends
- HPI YoY
- ▼ -500.89%
- Current HPI
- 251.4573
- Rent YoY
- ▲ 2.34%
- Metro
- Sacramento-Roseville-Folsom, CA
- State GDP YoY
- ▲ 3.21%
- F500 in state
- 116
Industry mix (Fortune 500 HQ in CA)
| Industry | F500 HQs | Revenue |
|---|---|---|
| Technology | 27 | $1,492B |
|
||
| Financial Services | 3 | $174B |
|
||
| Retail | 3 | $44B |
|
||
| Insurance | 3 | $26B |
|
||
| Media / Entertainment | 2 | $115B |
|
||
| Pharmaceuticals / Biotech | 2 | $62B |
|
||
Cash-flow waterfall
monthlySold comps — $/sqft
last 12 mo · ≤1 miLoading sold comps…