521 Wayne 523 · Wappapello, MO
Flood risk 10/10 · Severe
- FEMA flood zone
- X (unshaded)
- Chance of flooding over 30 yrs
- 0.99%
- Est. flood insurance / yr
- $507 – $1,088
Fire risk 5/10 · Moderate
- Est. fire insurance / yr
- $1,054 – $1,958
Heat risk 5/10 · Moderate
- Hot days now (above 108°F)
- 7 days/yr
- Hot days in 30 yrs
- 20 days/yr
Wind risk 2/10 · Minimal
- Chance of severe wind over 30 yrs
- 3.0%
Air-quality risk 2/10 · Minimal
- Unhealthy air days now
- 1 days/yr
- Unhealthy air days in 30 yrs
- 2 days/yr
Risk factors via First Street. Map © Google.
Why this score? — see what drove the B grade
The composite is a weighted blend of 9 inputs, each scored 0–100. Each bar is that input's sub-score; the figure is the points it added to the 100-point composite (weight × sub-score).
- Cash flow +30.0/30.0
- 1% rule +10.0/10.0
- DSCR +10.0/10.0
- Appreciation +8.1/10.0
- ARV discount +6.6/15.0
- Schools +2.9/10.0
- Rent growth +2.5/5.0
- Livability +2.5/5.0
- Condition / age +2.2/5.0
$48,500
🖨 Deal sheet 📄 Offer letter ✓ Due diligence
Key facts
- 2.9 acre lot
- Garage
- Built 1986
Neighborhood map
What this means for you Summary
Snapshot
- This is a 2-bed/2.0-bath manufactured listed at $48k. Condition is rated fair.
Deal economics
- At list price, monthly cash flow is $405 ($5k/yr) — positive.
- The deal already cash-flows at list — no discount required.
- Meets the 1% rule at list price ($1k rent vs $48k).
Location & tenants
- Location reads: area grade B — affects rentability + tenant quality, not the cash-flow math above.
- Greenville R-II (rural): math 34% / reading 37% proficiency, ranked #228 of 324 in MO (top 70%) — families likely to look elsewhere, expect single-tenant / working-renter base with shorter leases.
- Market conditions: 25 active listings in the ZIP.
Forward outlook
- In year one you build about $3k of equity ($335 loan paydown + $3k appreciation (6.2% local appreciation)).
- Wayne County population projected to shrink 9% by 2050 — rents likely to lag national; underwrite the cash flow, not the appreciation.
- At projected returns (6.2% appreciation + 3.0% rent growth), your $14k cash investment doubles in ~2 years — after that, you're playing with house money.
- By year 9, paydown + projected appreciation supports a ~$30k cash-out refi (75% LTV) — recoverable capital for the next deal without selling this one.
Negotiation context
- Only 1 days on market — expect competitive offers; lowballing is unlikely to land.
Risks & watch-outs
- Watch-outs: flood insurance adds $66/mo.
- Climate carrying-cost: severe flood risk; moderate wildfire risk; extreme-heat days projected 7→20/yr by 2055 (HVAC capex compounding) — expect insurance premiums to compound above CPI over the hold.
Questions for the listing agent
- Have any recent inspections been done? Can we get a copy of the seller's disclosures and any deferred-maintenance estimates?
- What's the actual annual flood-insurance premium (NFIP or private), and is the property in a SFHA with mandatory coverage?
- Is there a deadline driving the sale (1031 exchange, divorce, estate, relocation)? That informs how much negotiation room exists.
- What's the average days-on-market for RENTAL listings here right now (not sales)? A rising rental-DOM trend means longer vacancies and softer asking-rent achievability than the comps imply.
- What's the recent tenant-quality profile in this submarket — average credit score on applications, eviction rate, late-payment / NSF rate, and stable-employment percentage? A property-management company in the area should have these aggregated.
- How much new for-sale + rental construction is in the pipeline within 1–3 miles? Heavy new supply typically softens prices + rents 12–24 months out; constrained supply supports both.
Investment metrics
- 1% rule
- 2.11% ✓
- Cap rate
- 17.97%
- Cash-on-cash
- 41.70%
- DSCR
- 2.86
- GRM
- 4.0
CMA / ARV
- ARV (on-the-fly)
- $47,520
- Comps found
- 1
Show comp detail 1 sale within ~0.75 mi
| Address | Dist | Beds/Ba | Sqft | Sold | Price | $/sf | Match |
|---|---|---|---|---|---|---|---|
| 521 Wayne 523 | 0.00mi | 2/2.0 | 1,980 (0%) | 1mo | $48,500 | $24 | 99 |
Match score weights: distance 35% · size 25% · config 20% · recency 20%. Top-matched comps best support the ARV.
Projected returns pro-forma
6.18% appreciation · 3.0% rent growth · sell at horizon
- IRR
- 46.3%
- Equity multiple
- 3.97×
- Total profit
- $40,396
- Equity at exit
- $31,035
- IRR
- 43.1%
- Equity multiple
- 8.26×
- Total profit
- $98,582
- Equity at exit
- $56,757
Cash invested: $13,580 (down + closing). Projections, not guarantees.
Landlord ↔ Tenant lean methodology
- Overall (STATE)
- 81 Strongly Landlord-Friendly
- State Missouri
- 81 Strongly Landlord-Friendly · R+10
- County
- — inherits STATE
- City
- — inherits STATE
ZIP-level market 63966
- Home prices YoY
- 3.5%
- Active inventory
- 25
- Price-to-rent
- 4.0×
Monthly cashflow live
- Estimated rent
- $1,022 medium interval (Pro) →
- Mortgage (P&I)
- −$254
- Tax est. 1.5%
- −$61 /mo · $728/yr
- Insurance
- −$20
- Flood insurance flood zone
- −$66 /mo · $798/yr
- HOA
- −$0
- Vacancy / Maint / Mgmt
- −$215
- Net cashflow
- $405
Break-even live
UW: 25.0% down · 7.5% · 30yr · 1.5% tax · 5.0% vac · 8.0% maint · 8.0% mgmt
Financing live
Cash to close
- Down payment
- $12,125
- Closing costs
- $1,455
- Reserves months
- —
- Total cash needed
- —
Loan-product check · same deal, 3 products live
Conventional
25% down · 7.5% · 30yr
- Down + closing
- —
- Monthly P&I
- —
- Monthly cashflow
- —
- DSCR
- —
- Eligible?
- —
Personal DTI + credit; lowest rate.
DSCR
20% down · 8.5% · 30yr
- Down + closing
- —
- Monthly P&I
- —
- Monthly cashflow
- —
- DSCR
- —
- Eligible?
- —
No personal income docs; deal must DSCR.
Hard money
10% down · 12.0% · 12mo
- Down + closing
- —
- Monthly P&I
- —
- Monthly cashflow
- —
- DSCR
- —
- Eligible?
- —
Short-term bridge; refi at stabilization.
Listing history 2 events
-
2026-04-21status Pending
-
2026-04-21$48,500 Active
ⓘ Source: listings_history table (triggers on properties + properties_extension) + one-shot
backfill from property_details.listing_events for pre-trigger history.
Climate risk First Street
- Flood 10/10 Extreme FEMA zone X (unshaded) · 99% chance over 30 yrs
- Wildfire 5/10 Major
- Heat 5/10 Major 7 d/yr ≥108°F today · 20 d/yr by 30 yrs out
- Wind 2/10 Low 3% chance of damaging wind over 30 yrs
- Air quality 2/10 Low 1 unhealthy d/yr today · 2 by 30 yrs out
Nearby sold comps map
Loading sold comps map…
Walkable amenities ~0.75 mi
Loading nearby amenities…
Taxation est. · year 1
- Rental income
- $12,260
- − Mortgage interest
- −$2,717
- − Property taxes
- −$728
- − Insurance
- −$1,040
- − Repairs & maintenance
- −$981
- − Management
- −$981
- − Depreciation
- −$1,411
- Taxable income
- $4,403
- Est. tax owed @ 24.0%
- −$1,057
- After-tax cash flow
- $3,809/yr
For passive investors: Depreciation is non-cash, so a rental often shows a tax loss while cash-flowing — sheltering income. Rental losses are passive: they offset passive income freely, and up to $25,000/yr can offset ordinary (W-2) income if you actively participate and your MAGI is under $100k (phasing out to $0 by $150k); unused losses carry forward. On sale, claimed depreciation is recaptured at up to 25%, and gains may owe capital-gains tax (a 1031 exchange can defer both). Figures are a year-1 estimate at your 24.0% rate — not tax advice; consult a CPA.
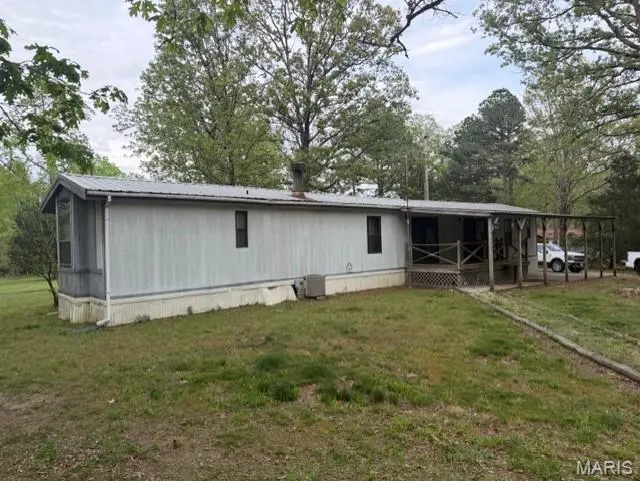
Condition & rehab AI · 8 photos
The home requires significant repairs and maintenance, including a new roof, siding, and HVAC system, as well as landscaping improvements. These updates will significantly increase its resale and rental value.
Repairs flagged
- Major roof — Significant damage and potential leaks.
- Major exterior siding — Peeling and chipping paint, indicating significant wear.
- Major interior walls — Peeling paint and outdated appearance.
- Major HVAC system — Old and may need replacement.
- Major landscaping — Sparse and overgrown, reducing curb appeal.
Value-add opportunities
- Both Paint the exterior siding and interior walls — Fresh paint will improve the home's appearance and increase its value.
- Both Replace the HVAC system — A new HVAC system will improve comfort and energy efficiency, attracting more buyers.
- Both Landscaping and tree trimming — A well-maintained yard will increase the home's curb appeal and attract more buyers/renters.
Renovation cost estimate screening
| Repair item | Severity | Est. cost |
|---|---|---|
| roof · Significant damage and potential leaks. | Major | $15,000–50,000 |
| exterior siding · Peeling and chipping paint, indicating significant wear. | Major | $15,000–50,000 |
| interior walls · Peeling paint and outdated appearance. | Major | $15,000–50,000 |
| HVAC system · Old and may need replacement. | Major | $15,000–50,000 |
| landscaping · Sparse and overgrown, reducing curb appeal. | Major | $15,000–50,000 |
| Total estimated repair cost · 5 items | $75,000–250,000 |
Value-add ROI direction
- Both Paint the exterior siding and interior walls — Fresh paint will improve the home's appearance and increase its value. ↑
- Both Replace the HVAC system — A new HVAC system will improve comfort and energy efficiency, attracting more buyers. ↑
- Both Landscaping and tree trimming — A well-maintained yard will increase the home's curb appeal and attract more buyers/renters. ↑
ⓘ Cost ranges are severity-bucket heuristics (US national rule-of-thumb). Get contractor quotes + a written scope before underwriting a rehab budget.
Schools (NCES district)
- District
- Greenville R-II
- NCES district ID
- 2913380
- Math proficiency
- 34% ▲ 8.00%
- Reading proficiency
- 37% ▼ -5.00%
- Median HH income
- $32,394
- Composite
- 29.08/100
- National rank
- #6599
- State rank
- #228 of 324 in MO
Livability — Wappapello
No livability data for this city. (Only ~50 U.S. cities are tracked.)
Census & demographics
- Population (ZIP)
- 2,183
Population outlook (Wayne County) Hauer SSP2
- Today (2025)
- 13,005 people
- By 2030
- 12,767 · -1.8%
- By 2040
- 12,319 · -5.3%
- By 2050
- 11,828 · -9.1%
- By 2075
- 10,806 · -16.9%
- By 2100
- 9,610 · -26.1%
Race, ethnicity, and origin ACS 2023
- Neighborhood character
- Predominantly White (85%)
- Race & ethnicity
- White 85% Two or more races 13%
- Common ancestry
- Serbian 3% Lithuanian 2% Iranian 1%
- Languages at home
- 99% English-only · Spanish 1%
Political lean MEDSL · Wayne
- 2024 margin
- Solid R (+72.6) · D 13.4% · R 86.0%
- 2008→2024 swing
- -47.6pp toward R · 2008: -25.0pp · 2024: -72.6pp
- All cycles
- 2024: R+72.6 2020: R+70.5 2016: R+64.4 2012: R+34.6 2008: R+25.0
Not yet ingested
- Civics
- —
Market trends
- HPI YoY
- ▲ 6.18%
- Current HPI
- 180.2321
- Rent YoY
- —
- Metro
- —
- State GDP YoY
- ▲ 1.84%
- F500 in state
- 20
Industry mix (Fortune 500 HQ in MO)
| Industry | F500 HQs | Revenue |
|---|---|---|
| Healthcare | 1 | $163B |
|
||
| Insurance | 1 | $21B |
|
||
| Industrial Technology | 1 | $17B |
|
||
| Retail | 1 | $16B |
|
||
| Industrial Distribution | 1 | $10B |
|
||
| Utilities | 1 | $9B |
|
||
Price history
2 events — show timeline
- 2026-04-21 Pending — MARIS as Distributed by MLS Grid
- 2026-04-21 Listed $48,500 MARIS as Distributed by MLS Grid
Cash-flow waterfall
monthlySold comps — $/sqft
last 12 mo · ≤1 miLoading sold comps…