 8-Plex
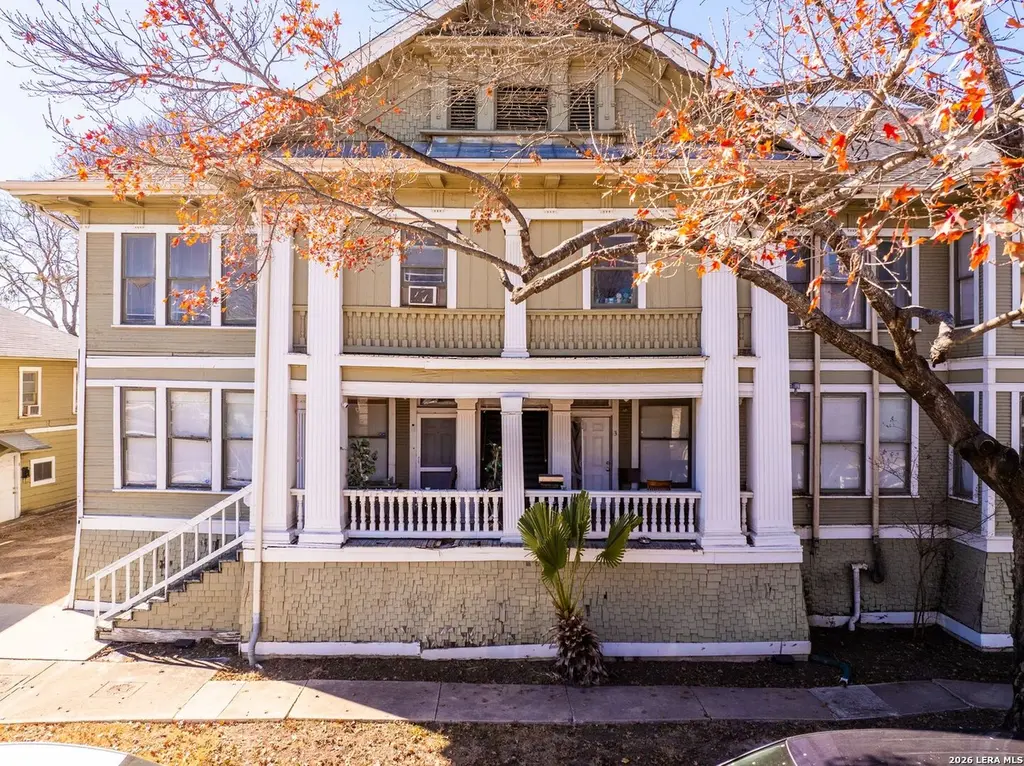
124 E Ashby Pl · San Antonio, TX
Flood risk 1/10 · Minimal
- FEMA flood zone
- X (unshaded)
- Chance of flooding over 30 yrs
- 0.0%
- Est. flood insurance / yr
- $507 – $1,088
Fire risk 1/10 · Minimal
- Est. fire insurance / yr
- $1,222 – $2,270
Heat risk 8/10 · Major
- Hot days now (above 108°F)
- 7 days/yr
- Hot days in 30 yrs
- 21 days/yr
Wind risk 6/10 · Moderate
- Chance of severe wind over 30 yrs
- 77.0%
Air-quality risk 2/10 · Minimal
- Unhealthy air days now
- 1 days/yr
- Unhealthy air days in 30 yrs
- 2 days/yr
Risk factors via First Street. Map © Google.
Why this score? — see what drove the C+ grade
The composite is a weighted blend of 9 inputs, each scored 0–100. Each bar is that input's sub-score; the figure is the points it added to the 100-point composite (weight × sub-score).
- Cash flow +28.5/30.0
- DSCR +10.0/10.0
- 1% rule +7.8/10.0
- ARV discount +7.5/15.0
- Livability +4.0/5.0
- Rent growth +2.7/5.0
- Condition / age +2.5/5.0
- Schools +1.4/10.0
- Appreciation +0.0/10.0
$1,200,000
🖨 Deal sheet 📄 Offer letter ✓ Due diligence
Multi-family units
County records classify this as Multi-Family (5+ Unit). Listing-text estimate: 8 units. confirmed
5+ unit building — per-unit beds/baths from public records are typically unavailable; the breakdown below (if shown) is an estimate from the listing text.
Listing remarks MLS
Welcome to 124 E Ashby - a rare historic 8-unit multifamily property located in the heart of Tobin Hill, one of Downtown San Antonio's most walkable and desirable neighborhoods. Originally a grand historic mansion, this architecturally distinctive property features hardwood floors, soaring ceilings, arched doorways, oversized windows, and spacious layouts - each unit offering its own unique character and charm. This is not a commodity apartment complex - it's a boutique historic asset with irreplaceable architectural appeal. Current rents are potentially under market, presenting a compelling value-add opportunity for investors seeking long-term upside. With 75% occupancy and immediate leasing potential on remaining units, there is a clear path toward stabilization and improved cash flow. A stabilized pro forma supports a 5% cap scenario, offering investors the opportunity to increase rents to market levels while benefiting from one of San Antonio's strongest rental corridors. Located just steps from St. Mary's Strip, residents enjoy walkable access to nightlife, restaurants, and entertainment. The property is also minutes from The Pearl, San Antonio College, and Downtown. This drives consistent tenant demand and long-term appreciation potential. This is a location-driven investment with built-in rental growth opportunity in a neighborhood where historic character and walkability command premium interest. 124 E Ashby is ideal for investors looking to reposition a unique historic asset in a high-growth urban submarket - not just another multifamily property, but a long-term hold with upside!
Key facts
- Spacious layouts
- Soaring ceilings
- Arched doorways
Tags
Neighborhood map
What this means for you Summary
Snapshot
- This is a 8 × 12-bed/8.0-bath units multifamily listed at $1.20M.
Deal economics
- At list price, monthly cash flow is $4k ($47k/yr) — positive. Per door: $492/mo.
- The deal already cash-flows at list — no discount required.
- Meets the 1% rule at list price ($15k rent vs $1.20M).
- Recommended offer: $1.09M (9.0% below list) — sets the bar for market timing.
- Cap rate 10.2% vs local median 3.8% in San Antonio — top-decile yield for the area; either an underpriced asset or a hidden risk that comps aren't pricing in. Stress-test before assuming the spread holds.
Location & tenants
- Location reads 80/100 on livability (#31 in TX, #1,616 nationally) — a professional / high-income tenant draw. Strengths: amenities A+, commute A+, cost of living A+; Watch: schools C-, crime F.
- San Antonio ISD (urban): math 12% / reading 22% proficiency, ranked #805 of 826 in TX (top 98%) — low school quality limits family demand, transient renter base, plan for 1-2y turnover; 80% free/reduced lunch — lower-income household profile, screen leases tightly.
- Market conditions: Rents flat; 175 active listings in the ZIP; 8,308 units permitted in Bexar County in 2024 (2,506 in 5+ unit buildings).
- At $15,345/mo this rent would consume 293% of the median local household income ($63k/yr) (locally 1505% of renters already pay >50% of income on rent) — very limited rent-growth headroom before tenants either downsize or default.
Forward outlook
- Local home prices are declining (-3.0%/yr); year-one equity from $8k of loan paydown is wiped out by about $36k of value loss. Plan a longer hold.
- Bexar County population projected at +50% by 2050 — long-run rental-demand tailwind backs the buy-and-hold thesis.
Negotiation context
- It's been on market 115 days — a 9% lower offer ($1.09M) is reasonable based on typical stale-listing flexibility.
- 2 sale attempts since 11y ago with the ask held roughly flat each time — persistent listings suggest the price (not the market) is what's stuck; bring a comps-based counter.
- Current owner paid $170k; list at $1.20M implies a 605% gain — meaningful room to come down on a strong offer.
Risks & watch-outs
- Watch-outs: built in 1915 — expect roof / HVAC / electrical / plumbing capex.
- Climate carrying-cost: major wind risk, 77% chance of damaging wind over 30y; extreme-heat days projected 7→21/yr by 2055 (HVAC capex compounding) — expect insurance premiums to compound above CPI over the hold.
Questions for the listing agent
- It's been on market 115 days. Have you received any prior offers? Is the seller open to a 9% concession, seller financing, or rate buy-down credit?
- Can we see the unit-by-unit rent roll, current vacancy, and any below-market leases? What's the average tenancy length?
- What capital expenditures (roof, boiler, parking lot, exteriors) have been made in the last 5 years, and what's planned in the next 2?
- Built in 1915 — when were the roof, HVAC, electrical panel, plumbing, and water heater last replaced?
- Why hasn't it sold? Are there any deal-killer items the seller is aware of (foundation, flood, title, zoning, code violations)?
- Is there a deadline driving the sale (1031 exchange, divorce, estate, relocation)? That informs how much negotiation room exists.
- Crime grade is F in this area — have there been break-ins, vandalism, or insurance claims at this property in the last 3 years? What carrier currently insures it and at what premium?
- What's the average days-on-market for RENTAL listings here right now (not sales)? A rising rental-DOM trend means longer vacancies and softer asking-rent achievability than the comps imply.
- What's the recent tenant-quality profile in this submarket — average credit score on applications, eviction rate, late-payment / NSF rate, and stable-employment percentage? A property-management company in the area should have these aggregated.
- How much new apartment / multifamily construction is in the pipeline within 1–3 miles? Heavy new supply (>2% of stock underway) typically softens rents 12–24 months out; light construction supports rent growth.
Investment metrics
- 1% rule
- 1.28% ✓
- Cap rate
- 10.23%
- Cash-on-cash
- 14.06%
- DSCR
- 1.63
- GRM
- 6.5
CMA / ARV
- ARV (median comp)
- $568,084
- List price
- $1,200,000
- Delta
- 111.24%
- Verdict
- OVERPRICED
- Comps
- 3 within 2.0 mi
Projected returns pro-forma
-3.0% appreciation · 0.89% rent growth · sell at horizon
- IRR
- 1.9%
- Equity multiple
- 1.07×
- Total profit
- $24,526
- Equity at exit
- $178,924
- IRR
- 9.4%
- Equity multiple
- 1.65×
- Total profit
- $219,369
- Equity at exit
- $103,754
Cash invested: $336,000 (down + closing). Projections, not guarantees.
Landlord ↔ Tenant lean methodology
- Overall (STATE)
- 87 Strongly Landlord-Friendly
- State Texas
- 87 Strongly Landlord-Friendly · R+5
- County
- — inherits STATE
- City
- — inherits STATE
ZIP-level market 78212
- Home prices YoY
- -25.2%
- Rents YoY
- 0.9%
- Active inventory
- 175
- Price-to-rent
- 52.1×
Monthly cashflow live
- Estimated rent
- $15,345 medium interval (Pro) →
- Mortgage (P&I)
- −$6,293
- Tax from tax record
- −$1,393 /mo · $16,717/yr
- Insurance
- −$500
- HOA
- −$0
- Vacancy / Maint / Mgmt
- −$3,222
- Net cashflow
- $3,937
Break-even live
8-unit breakdown (identical units grouped — click to expand)
| Units | Beds | Baths | Est. rent |
|---|---|---|---|
| 8× units | 12 | 8 | $15,344 |
| #1 | 12 | 8 | $1,918 |
| #2 | 12 | 8 | $1,918 |
| #3 | 12 | 8 | $1,918 |
| #4 | 12 | 8 | $1,918 |
| #5 | 12 | 8 | $1,918 |
| #6 | 12 | 8 | $1,918 |
| #7 | 12 | 8 | $1,918 |
| #8 | 12 | 8 | $1,918 |
| Total (8 units) | $15,345 | ||
UW: 25.0% down · 7.5% · 30yr · 1.5% tax · 5.0% vac · 8.0% maint · 8.0% mgmt
Financing live
Cash to close
- Down payment
- $300,000
- Closing costs
- $36,000
- Reserves months
- —
- Total cash needed
- —
Loan-product check · same deal, 3 products live
Conventional
25% down · 7.5% · 30yr
- Down + closing
- —
- Monthly P&I
- —
- Monthly cashflow
- —
- DSCR
- —
- Eligible?
- —
Personal DTI + credit; lowest rate.
DSCR
20% down · 8.5% · 30yr
- Down + closing
- —
- Monthly P&I
- —
- Monthly cashflow
- —
- DSCR
- —
- Eligible?
- —
No personal income docs; deal must DSCR.
Hard money
10% down · 12.0% · 12mo
- Down + closing
- —
- Monthly P&I
- —
- Monthly cashflow
- —
- DSCR
- —
- Eligible?
- —
Short-term bridge; refi at stabilization.
Listing history 26 events
-
2026-06-18days on market $1,200,000 Active 115 DOM
-
2026-06-17days on market $1,200,000 Active 114 DOM
-
2026-06-16days on market $1,200,000 Active 113 DOM
-
2026-06-15days on market $1,200,000 Active 112 DOM
-
2026-06-13days on market $1,200,000 Active 110 DOM
-
2026-06-09days on market $1,200,000 Active 106 DOM
-
2026-06-08days on market $1,200,000 Active 105 DOM
-
2026-06-07days on market $1,200,000 Active 104 DOM
-
2026-06-04days on market $1,200,000 Active 101 DOM
-
2026-06-03days on market $1,200,000 Active 100 DOM
-
2026-06-02days on market $1,200,000 Active 99 DOM
-
2026-06-01days on market $1,200,000 Active 98 DOM
-
2026-05-31days on market $1,200,000 Active 97 DOM
-
2026-02-23$1,200,000 New 1616-char remark
Show marketing remark (1616 chars)
Welcome to 124 E Ashby - a rare historic 8-unit multifamily property located in the heart of Tobin Hill, one of Downtown San Antonio's most walkable and desirable neighborhoods. Originally a grand historic mansion, this architecturally distinctive property features hardwood floors, soaring ceilings, arched doorways, oversized windows, and spacious layouts - each unit offering its own unique character and charm. This is not a commodity apartment complex - it's a boutique historic asset with irreplaceable architectural appeal. Current rents are potentially under market, presenting a compelling value-add opportunity for investors seeking long-term upside. With 75% occupancy and immediate leasing potential on remaining units, there is a clear path toward stabilization and improved cash flow. A stabilized pro forma supports a 5% cap scenario, offering investors the opportunity to increase rents to market levels while benefiting from one of San Antonio's strongest rental corridors. Located just steps from St. Mary's Strip, residents enjoy walkable access to nightlife, restaurants, and entertainment. The property is also minutes from The Pearl, San Antonio College, and Downtown. This drives consistent tenant demand and long-term appreciation potential. This is a location-driven investment with built-in rental growth opportunity in a neighborhood where historic character and walkability command premium interest. 124 E Ashby is ideal for investors looking to reposition a unique historic asset in a high-growth urban submarket - not just another multifamily property, but a long-term hold with upside!
-
2024-04-01soldstatus
-
2021-01-11soldstatus
-
2016-06-01soldstatus
-
2015-12-04soldstatus
-
2015-12-02soldstatus Sold 147-char remark
Show marketing remark (147 chars)
Historic One of Kind, 8-unit multi-family complex in a perfect location in Downtown San Antonio! Healthy cash flows and 100% occupancy year around!
-
2015-10-08status Pending 147-char remark
Show marketing remark (147 chars)
Historic One of Kind, 8-unit multi-family complex in a perfect location in Downtown San Antonio! Healthy cash flows and 100% occupancy year around!
-
2015-09-16historical Active Option 147-char remark
Show marketing remark (147 chars)
Historic One of Kind, 8-unit multi-family complex in a perfect location in Downtown San Antonio! Healthy cash flows and 100% occupancy year around!
-
2015-09-02$560,000 New 147-char remark
Show marketing remark (147 chars)
Historic One of Kind, 8-unit multi-family complex in a perfect location in Downtown San Antonio! Healthy cash flows and 100% occupancy year around!
-
2004-03-17soldstatus
-
2002-08-16soldstatus
-
2002-05-03soldstatus
-
1998-02-18soldstatus $170,240
ⓘ Source: listings_history table (triggers on properties + properties_extension) + one-shot
backfill from property_details.listing_events for pre-trigger history.
Tax reassessment forecast TX · Resets to sale price
- Current annual tax
- $16,717 · $1,393/mo
- Projected year-2 tax
- $21,960 · $1,830/mo
- Expected delta
- +$5,243/yr (+$437/mo · 31.4%)
ⓘ Screening estimate from a state-policy table — verify with the county assessor before closing.
Climate risk First Street
- Flood 1/10 Low FEMA zone X (unshaded) · 0% chance over 30 yrs
- Wildfire 1/10 Low
- Heat 8/10 Severe 7 d/yr ≥108°F today · 21 d/yr by 30 yrs out
- Wind 6/10 Major 77% chance of damaging wind over 30 yrs
- Air quality 2/10 Low 1 unhealthy d/yr today · 2 by 30 yrs out
Nearby sold comps map
Loading sold comps map…
Walkable amenities ~0.75 mi
Loading nearby amenities…
Taxation est. · year 1
- Rental income
- $184,140
- − Mortgage interest
- −$67,219
- − Property taxes
- −$16,717
- − Insurance
- −$6,000
- − Repairs & maintenance
- −$14,731
- − Management
- −$14,731
- − Depreciation
- −$34,909
- Taxable income
- $29,833
- Est. tax owed @ 24.0%
- −$7,160
- After-tax cash flow
- $40,078/yr
For passive investors: Depreciation is non-cash, so a rental often shows a tax loss while cash-flowing — sheltering income. Rental losses are passive: they offset passive income freely, and up to $25,000/yr can offset ordinary (W-2) income if you actively participate and your MAGI is under $100k (phasing out to $0 by $150k); unused losses carry forward. On sale, claimed depreciation is recaptured at up to 25%, and gains may owe capital-gains tax (a 1031 exchange can defer both). Figures are a year-1 estimate at your 24.0% rate — not tax advice; consult a CPA.
Schools (NCES district)
- District
- San Antonio ISD
- NCES district ID
- 4838730
- Math proficiency
- 12% ▼ -21.00%
- Reading proficiency
- 22% ▼ -7.00%
- Median HH income
- $30,952
- Composite
- 13.57/100
- National rank
- #9512
- State rank
- #805 of 826 in TX
Livability — San Antonio
- Score
- 80/100
- State rank
- #31
- US rank
- #1616
Category grades
Schools grade is shown separately in the Schools card above.
Census & demographics
- Census place
- San Antonio, TX
- County
- Bexar County · 1,990,555 people
- City population
- 1,806,925
- Metro
- San Antonio-New Braunfels, TX
- Population (ZIP)
- 27,437
- Household income
- $62,801
- Rent vs Own
- Severe rent burden
- 1505.0
Population outlook (Bexar County) Hauer SSP2
- Today (2025)
- 2,336,851 people
- By 2030
- 2,560,728 · +9.6%
- By 2040
- 3,020,569 · +29.3%
- By 2050
- 3,493,522 · +49.5%
- By 2075
- 4,668,459 · +99.8%
- By 2100
- 5,533,242 · +136.8%
Race, ethnicity, and origin ACS 2023
- Neighborhood character
- Diverse neighborhood (Simpson 0.55)
- Race & ethnicity
- Hispanic / Latino 58% White 34% Two or more races 34% Black 3% Asian 2%
- Hispanic origin (detail)
- Mexican 50%
- Common ancestry
- Slovak 2% Lithuanian 2% Romanian 1%
- Foreign-born
- 13% · Canada, China
- Languages at home
- 62% English-only · Spanish 36% Chinese 1%
Political lean MEDSL · Bexar
- 2024 margin
- Lean D (+9.8) · D 54.3% · R 44.6% · Other 1.1%
- 2008→2024 swing
- +4.2pp toward D · 2008: 5.6pp · 2024: 9.8pp
- All cycles
- 2024: D+9.8 2020: D+18.2 2016: D+13.5 2012: D+4.6 2008: D+5.6
Not yet ingested
- Civics
- —
Market trends
- HPI YoY
- ▼ -94.24%
- Current HPI
- 280.1006
- Rent YoY
- ▲ 0.89%
- Metro
- San Antonio-New Braunfels, TX
- State GDP YoY
- ▲ 3.95%
- F500 in state
- 110
Industry mix (Fortune 500 HQ in TX)
| Industry | F500 HQs | Revenue |
|---|---|---|
| Energy | 16 | $1,198B |
|
||
| Technology | 5 | $198B |
|
||
| Engineering / Construction | 4 | $72B |
|
||
| Energy Services | 3 | $60B |
|
||
| Utilities | 3 | $41B |
|
||
| Healthcare | 2 | $330B |
|
||
Price history
+604.9% since first listed13 events — show timeline
- 2026-02-23 Listed $1,200,000 LERA
- 2024-04-01 Sold (Public Records) — Public Records
- 2021-01-11 Sold (Public Records) — Public Records
- 2016-06-01 Sold (Public Records) — Public Records
- 2015-12-04 Sold (Public Records) — Public Records
- 2015-12-02 Sold (MLS) — LERA
- 2015-10-08 Pending — LERA
- 2015-09-16 Contingent — LERA
- 2015-09-02 Listed $560,000 LERA
- 2004-03-17 Sold (Public Records) — Public Records
- 2002-08-16 Sold (Public Records) — Public Records
- 2002-05-03 Sold (Public Records) — Public Records
- 1998-02-18 Sold (Public Records) $170,240 Public Records
Property tax history
+5.7%/yrLatest (2025): $16,717 · +0.0% YoY. Source: county tax records.
Cash-flow waterfall
monthlySold comps — $/sqft
last 12 mo · ≤1 miLoading sold comps…