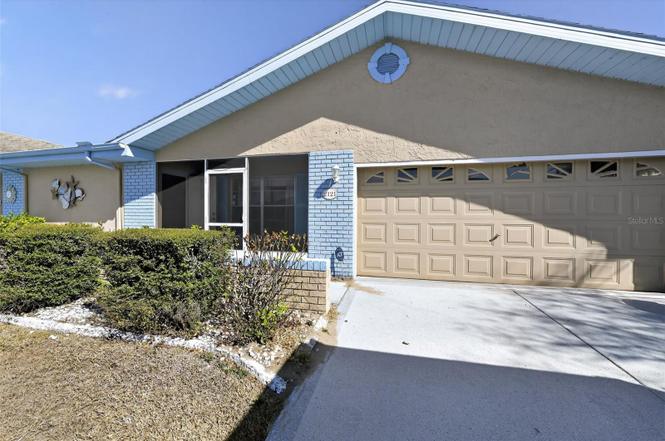
2121 Meadowlark Ln · Sun City Center, FL
Flood risk 1/10 · Minimal
- FEMA flood zone
- X (unshaded)
- Chance of flooding over 30 yrs
- 0.0%
- Est. flood insurance / yr
- $507 – $1,088
Fire risk 3/10 · Minor
- Est. fire insurance / yr
- $947 – $1,759
Heat risk 10/10 · Severe
- Hot days now (above 108°F)
- 7 days/yr
- Hot days in 30 yrs
- 29 days/yr
Wind risk 9/10 · Severe
- Chance of severe wind over 30 yrs
- 99.0%
Air-quality risk 3/10 · Minor
- Unhealthy air days now
- 3 days/yr
- Unhealthy air days in 30 yrs
- 3 days/yr
Risk factors via First Street. Map © Google.
Why this score? — see what drove the C- grade
The composite is a weighted blend of 9 inputs, each scored 0–100. Each bar is that input's sub-score; the figure is the points it added to the 100-point composite (weight × sub-score).
- Cash flow +16.4/30.0
- ARV discount +7.5/15.0
- 1% rule +6.7/10.0
- DSCR +5.1/10.0
- Schools +4.2/10.0
- Livability +3.9/5.0
- Appreciation +3.4/10.0
- Rent growth +3.2/5.0
- Condition / age +2.5/5.0
$169,000
🖨 Deal sheet (PDF) 📄 Offer letter ✓ Due diligence
Listing remarks
Under contract-accepting backup offers. Needs TLC. House was cleaned out. Property is being sold as is. Age of big ticket items unknown. Community is 55+. * * * This is a limited-service listing - Please see realtor remarks for showing instructions. * * *
Key facts
- 9,840 sq ft lot
- 2 garage spots
- Built 1983
Property features AI
Finance
- Other: No lease restrictions indicated
- Financial info: Total annual fees $1,198; Total monthly fees $99.83
- HOA & community: Has HOA (Sun City Center Community Association, Inc.; Sun City Center Unit 46 POA); HOA required; Annual association fee $346; Monthly association fee $71; Monthly HOA amount $28.83; Senior community; Pets allowed
Exterior
- Parking: Attached garage (2 spaces)
- Utilities: Public water; Other sewer; Other utilities
- Home design: Single family residence; Residential property; Fixer condition; One story; Faces southwest
- Construction: Block construction; Shingle roof; Other foundation
- Exterior features: Other exterior features; Asphalt road surface
Interior
- Kitchen: Other appliances
- Bedrooms: 2 bedrooms
- Flooring: Other flooring
- Bathrooms: 2 full bathrooms
- Heating & cooling: Other heating; Central air conditioning
- Interior features: Other interior features
- Laundry & utility: Other laundry features
Neighborhood map
What this means for you Summary
Snapshot
- This is a 2-bed/2.0-bath single-family listed at $169k.
Deal economics
- At list price, monthly cash flow is $96 ($1k/yr) — positive.
- The deal already cash-flows at list — no discount required.
- Meets the 1% rule at list price ($2k rent vs $169k).
- Recommended offer: $159k (6.0% below list) — sets the bar for market timing.
Location & tenants
- Location reads 78/100 on livability (#178 in FL, #2,736 nationally) — a middle-class / working-renter tenant base. Strengths: housing A+, health & safety A+, crime B+; Watch: amenities F.
- Hillsborough (suburban): math 47% / reading 50% proficiency, ranked #41 of 73 in FL (top 56%) — families likely to look elsewhere, expect single-tenant / working-renter base with shorter leases.
- Zoned schools: Cypress Creek Elementary School (math 40% / reading 40%, grade F, #1,491 of 2,144 statewide, top 70%, 957 students, 63% FRL); Shields Middle School (math 29% / reading 27%, grade F, #486 of 571 statewide, top 86%, 1,867 students, 68% FRL); Lennard High School (math 30% / reading 46%, grade F, #328 of 667 statewide, top 50%, 2,404 students, 47% FRL).
- Zoned-school proficiency averages 35% at this address vs 48% district-wide (-13 pts) — the specific schools serving this property underperform the Hillsborough average; the district grade overstates school quality for this exact location.
- Market conditions: Rents rising (+2.6%/yr); 605 active listings in the ZIP; 29 comparable units currently listed for rent nearby; rentals at typical pace (median 26d on market — plan ~3-4 weeks tenant-placement turnaround); 9,053 units permitted in Hillsborough County in 2024 (4,555 in 5+ unit buildings).
- This rent runs 32% of the median local income ($73k/yr) — at the standard rent-burdened threshold; future hikes will face affordability resistance.
Forward outlook
- Local home prices are declining (-3.0%/yr); year-one equity from $1k of loan paydown is wiped out by about $5k of value loss. Plan a longer hold.
- Hillsborough County population projected at +37% by 2050 — long-run rental-demand tailwind backs the buy-and-hold thesis.
Negotiation context
- It's been on market 76 days — a 6% lower offer ($159k) is reasonable based on typical stale-listing flexibility.
- 2 sale attempts since 14y ago; this cycle's ask has dropped $20k (11%) from the opening price — seller is motivated, your offer sets the floor, not the list.
- Current owner paid $64k; list at $169k implies a 164% gain — meaningful room to come down on a strong offer.
Risks & watch-outs
- Watch-outs: property tax is 2.9% of price.
- Climate carrying-cost: severe wind risk, 99% chance of damaging wind over 30y; extreme-heat days projected 7→29/yr by 2055 (HVAC capex compounding) — expect insurance premiums to compound above CPI over the hold.
Questions for the listing agent
- It's been on market 76 days. Have you received any prior offers? Is the seller open to a 6% concession, seller financing, or rate buy-down credit?
- Property tax is high relative to price — has the assessment been appealed recently, and will the sale trigger a re-assessment?
- What does the HOA fee cover, when was the last increase, and are there any pending special assessments or reserve-fund shortfalls?
- Why hasn't it sold? Are there any deal-killer items the seller is aware of (foundation, flood, title, zoning, code violations)?
- Is there a deadline driving the sale (1031 exchange, divorce, estate, relocation)? That informs how much negotiation room exists.
- Schools are D-rated, which usually means shorter tenancies and higher turnover. Who's the typical renter profile here, and what's been the actual vacancy rate?
- What's the average days-on-market for RENTAL listings here right now (not sales)? A rising rental-DOM trend means longer vacancies and softer asking-rent achievability than the comps imply.
- What's the recent tenant-quality profile in this submarket — average credit score on applications, eviction rate, late-payment / NSF rate, and stable-employment percentage? A property-management company in the area should have these aggregated.
- How much new for-sale + rental construction is in the pipeline within 1–3 miles? Heavy new supply typically softens prices + rents 12–24 months out; constrained supply supports both.
Investment metrics
- 1% rule
- 1.17% ✓
- Cap rate
- 6.97%
- Cash-on-cash
- 2.42%
- DSCR
- 1.11
- GRM
- 7.1
CMA / ARV
No comps found within radius.
Projected returns pro-forma
-3.0% appreciation · 2.65% rent growth · sell at horizon
- IRR
- -12.8%
- Equity multiple
- 0.54×
- Total profit
- $-21,783
- Equity at exit
- $25,198
- IRR
- -4.2%
- Equity multiple
- 0.72×
- Total profit
- $-13,098
- Equity at exit
- $14,612
Cash invested: $47,320 (down + closing). Projections, not guarantees.
Landlord ↔ Tenant lean methodology
- Overall (STATE)
- 87 Strongly Landlord-Friendly
- State Florida
- 87 Strongly Landlord-Friendly · R+3
- County
- — inherits STATE
- City
- — inherits STATE
ZIP-level market 33573
- Home prices YoY
- -1.2%
- Rents YoY
- 2.6%
- Active inventory
- 605
- Price-to-rent
- 7.1×
Monthly cashflow live
- Estimated rent
- $1,972 high interval (Pro) →
- Mortgage (P&I)
- −$886
- Tax from tax record
- −$407 /mo · $4,885/yr
- Insurance
- −$70
- HOA
- −$99
- Vacancy / Maint / Mgmt
- −$414
- Net cashflow
- $96
Break-even live
Sensitivity live
| Price | -10% $191 | -5% $143 | +0% $96 | +5% $48 | +10% $0 |
|---|---|---|---|---|---|
| Rent | -10% $-60 | -5% $18 | +0% $96 | +5% $173 | +10% $251 |
| Rate | -1.0pp $181 | -0.5pp $139 | base $96 | +0.5pp $52 | +1.0pp $7 |
UW: 25.0% down · 7.5% · 30yr · 1.5% tax · 5.0% vac · 8.0% maint · 8.0% mgmt
Financing live
Cash to close
- Down payment
- $42,250
- Closing costs
- $5,070
- Reserves months
- —
- Total cash needed
- —
Loan-product check · same deal, 3 products live
Conventional
25% down · 7.5% · 30yr
- Down + closing
- —
- Monthly P&I
- —
- Monthly cashflow
- —
- DSCR
- —
- Eligible?
- —
Personal DTI + credit; lowest rate.
DSCR
20% down · 8.5% · 30yr
- Down + closing
- —
- Monthly P&I
- —
- Monthly cashflow
- —
- DSCR
- —
- Eligible?
- —
No personal income docs; deal must DSCR.
Hard money
10% down · 12.0% · 12mo
- Down + closing
- —
- Monthly P&I
- —
- Monthly cashflow
- —
- DSCR
- —
- Eligible?
- —
Short-term bridge; refi at stabilization.
Rent comps 29 comps
| Address | Beds | Baths | Sqft | Rent | $/sqft | DOM | Units | Dist |
|---|---|---|---|---|---|---|---|---|
| 1904 N Pebble Beach Blvd Sun City Center, FL | 3.0 | 2.0 | 1756 | $1,600 | $0.91 | 15d | 1 | 0.30mi |
| 1814 Columbine Pl Sun City Center, FL | 2.0 | 2.0 | 1516 | $2,100 | $1.39 | 26d | 1 | 0.32mi |
| 1750 Atrium Dr Sun City Center, FL | 2.0 | 2.0 | 1367 | $1,750 | $1.28 | 26d | 1 | 0.34mi |
| 9718 Mulberry Marsh Ln Sun City Center, FL | 3.0 | 2.5 | 1663 | $1,973 | $1.19 | 17d | 1 | 0.71mi |
| 15503 Prestwick Rose Pl Unit 1 Sun City Center, FL | 3.0 | 2.5 | 1666 | $2,000 | $1.20 | 26d | 1 | 0.71mi |
| 9637 Pembrooke Pines Dr Sun City Center, FL | 2.0 | 2.5 | 1548 | $2,100 | $1.36 | 26d | 1 | 0.72mi |
| 1408 Nashua Cir Sun City Center, FL | 3.0 | 2.0 | 2053 | $1,900 | $0.93 | 26d | 1 | 0.75mi |
| 9771 Pembrooke Pines Dr Sun City Center, FL | 3.0 | 2.5 | 1634 | $2,025 | $1.24 | 5d | 1 | 0.77mi |
| 810 Oakmont Ave Sun City Center, FL | 2.0 | 2.0 | 1266 | $2,100 | $1.66 | 26d | 1 | 0.78mi |
| 4408 Eternal Prince Dr Sun City Center, FL | 3.0 | 2.0 | 1451 | $1,800 | $1.24 | 26d | 1 | 0.80mi |
| 15504 Florence Hollow Pl Sun City Center, FL | 3.0 | 2.5 | 1787 | $2,150 | $1.20 | 6d | 1 | 0.81mi |
| 2421 E Del Webb Blvd Sun City Center, FL | 3.0 | 2.0 | 1901 | $2,300 | $1.21 | 26d | 1 | 0.90mi |
| 15519 Telford Spring Dr Sun City Center, FL | 3.0 | 2.0 | 1348 | $2,090 | $1.55 | 26d | 1 | 1.05mi |
| 8117 Alamosa Wood Ave Ruskin, FL | 3.0 | 2.0 | 1346 | $1,895 | $1.41 | 26d | 1 | 1.19mi |
| 1104 Desert Hills Dr Sun City Center, FL | 2.0 | 2.0 | 1383 | $1,825 | $1.32 | 19d | 1 | 1.19mi |
| 10324 Geese Trail Cir Sun City Center, FL | 3.0 | 2.0 | 1672 | $2,300 | $1.38 | 0d | 1 | 1.19mi |
| 301 Bryce Ct Sun City Center, FL | 2.0 | 2.0 | 1830 | $1,850 | $1.01 | 26d | 1 | 1.20mi |
| 717 Indian Wells Ave Sun City Center, FL | 2.0 | 2.0 | 1264 | $1,595 | $1.26 | 26d | 1 | 1.20mi |
| 714 Indian Wells Ave Sun City Center, FL | 2.0 | 2.0 | 1515 | $1,695 | $1.12 | 26d | 1 | 1.23mi |
| 1703 Amhurst Cir Sun City Center, FL | 2.0 | 2.0 | 1550 | $1,995 | $1.29 | 6d | 1 | 1.25mi |
| 1528 Chevy Chase Dr Sun City Center, FL | 2.0 | 2.0 | 1346 | $2,000 | $1.49 | 26d | 1 | 1.26mi |
| 701 Cypress Pl Sun City Center, FL | 2.0 | 2.0 | 1425 | $1,700 | $1.19 | 26d | 1 | 1.31mi |
| 16260 Amethyst Key Dr Wimauma, FL | 3.0 | 2.0 | 1889 | $2,300 | $1.22 | 26d | 1 | 1.34mi |
| 102 Wintersong Ln Sun City Center, FL | 2.0 | 2.0 | 1508 | $1,995 | $1.32 | 21d | 1 | 1.38mi |
| 7338 Lumber Port Dr Ruskin, FL | 3.0 | 2.0 | 1298 | $1,975 | $1.52 | 1d | 1 | 1.41mi |
| 1301 Warwick Ct Unit 1301 Sun City Center, FL | 1.0 | 1.0 | 1102 | $1,575 | $1.43 | 26d | 1 | 1.42mi |
| 7329 Lumber Port Dr Ruskin, FL | 3.0 | 2.0 | 1275 | $2,000 | $1.57 | 5d | 1 | 1.45mi |
| 1201 Fordham Dr Sun City Center, FL | 2.0 | 2.0 | 1582 | $1,950 | $1.23 | 19d | 1 | 1.45mi |
| 1005 Rickenbacker Dr Sun City Center, FL | 2.0 | 1.0 | 1224 | $1,595 | $1.30 | 4d | 1 | 1.47mi |
HOA detail
- Monthly dues
- $99 · $1,188/yr
Listing history 10 events
-
2026-05-11status Pending
-
2026-04-09price $169,000
-
2026-03-10price $175,000
-
2026-03-02soldstatus $64,000
-
2026-02-24$189,000 Active
-
2012-11-25historical
-
2012-10-23$134,900
-
1997-04-30soldstatus $76,000
-
1993-03-01soldstatus $82,000
-
1991-07-01soldstatus $82,000
ⓘ Source: listings_history table (triggers on properties + properties_extension) + one-shot
backfill from property_details.listing_events for pre-trigger history.
Tax reassessment forecast FL · Resets to sale price
- Current annual tax
- $4,885 · $407/mo
- Projected year-2 tax
- $4,885 · $407/mo
- Expected delta
- $0/yr ($0/mo · 0.0%)
ⓘ Screening estimate from a state-policy table — verify with the county assessor before closing.
Climate risk First Street
- Flood 1/10 Low FEMA zone X (unshaded) · 0% chance over 30 yrs
- Wildfire 3/10 Moderate
- Heat 10/10 Extreme 7 d/yr ≥108°F today · 29 d/yr by 30 yrs out
- Wind 9/10 Extreme 99% chance of damaging wind over 30 yrs
- Air quality 3/10 Moderate 3 unhealthy d/yr today · 3 by 30 yrs out
Nearby sold comps map
Loading sold comps map…
Walkable amenities ~0.75 mi
Loading nearby amenities…
Taxation est. · year 1
- Rental income
- $23,670
- − Mortgage interest
- −$9,467
- − Property taxes
- −$4,885
- − Insurance
- −$845
- − Repairs & maintenance
- −$1,894
- − Management
- −$1,894
- − HOA
- −$1,188
- − Depreciation
- −$4,916
- Taxable loss
- −$1,418
- Est. tax savings @ 24.0%
- +$340
- After-tax cash flow
- $1,487/yr
For passive investors: Depreciation is non-cash, so a rental often shows a tax loss while cash-flowing — sheltering income. Rental losses are passive: they offset passive income freely, and up to $25,000/yr can offset ordinary (W-2) income if you actively participate and your MAGI is under $100k (phasing out to $0 by $150k); unused losses carry forward. On sale, claimed depreciation is recaptured at up to 25%, and gains may owe capital-gains tax (a 1031 exchange can defer both). Figures are a year-1 estimate at your 24.0% rate — not tax advice; consult a CPA.
Schools (NCES district)
- District
- Hillsborough
- NCES district ID
- 1200870
- Math proficiency
- 47% ▼ -8.00%
- Reading proficiency
- 50% ▼ -4.00%
- Median HH income
- $50,622
- Composite
- 41.6/100
- National rank
- #3435
- State rank
- #41 of 73 in FL
Livability — Sun City Center
- Score
- 78/100
- State rank
- #178
- US rank
- #2736
Category grades
Schools grade is shown separately in the Schools card above.
Census & demographics
- Census place
- Sun City Center, FL
- County
- Hillsborough County · 1,540,968 people
- City population
- 35,362
- Metro
- Tampa-St. Petersburg-Clearwater, FL
- Population (ZIP)
- 35,362
- Household income
- $72,834
- Rent vs Own
- Severe rent burden
- 1382.0
Population outlook (Hillsborough County) Hauer SSP2
- Today (2025)
- 1,607,022 people
- By 2030
- 1,733,968 · +7.9%
- By 2040
- 1,979,565 · +23.2%
- By 2050
- 2,203,427 · +37.1%
- By 2075
- 2,667,893 · +66.0%
- By 2100
- 2,891,558 · +79.9%
Race, ethnicity, and origin ACS 2023
- Neighborhood character
- Predominantly White (73%)
- Race & ethnicity
- White 73% Hispanic / Latino 13% Two or more races 11% Black 10% Asian 1%
- Hispanic origin (detail)
- Mexican 1% Puerto Rican 6% Cuban 2%
- Common ancestry
- Romanian 3% Lithuanian 3% Slovak 2%
- Foreign-born
- 8% · Canada, Vietnam
- Languages at home
- 86% English-only · Spanish 10% French/Haitian/Cajun 1% German/W. Germanic 1%
Political lean MEDSL · Hillsborough
- 2024 margin
- Toss-up / Even · D 47.8% · R 50.9% · Other 1.3%
- 2008→2024 swing
- -10.2pp toward R · 2008: 7.1pp · 2024: -3.1pp
- All cycles
- 2024: R+3.1 2020: D+6.9 2016: D+6.8 2012: D+6.7 2008: D+7.1
Not yet ingested
- Civics
- —
Market trends
- HPI YoY
- ▼ -3.27%
- Current HPI
- 272.9767
- Rent YoY
- ▲ 2.65%
- Metro
- Tampa-St. Petersburg-Clearwater, FL
- State GDP YoY
- ▲ 3.28%
- F500 in state
- 36
Industry mix (Fortune 500 HQ in FL)
| Industry | F500 HQs | Revenue |
|---|---|---|
| Industrial Technology | 2 | $29B |
|
||
| Insurance | 2 | $17B |
|
||
| Retail | 1 | $60B |
|
||
| Technology Distribution | 1 | $58B |
|
||
| Homebuilding | 1 | $35B |
|
||
| Technology Manufacturing | 1 | $35B |
|
||
Price history
+106.1% since first listed10 events — show timeline
- 2026-05-11 Pending — Stellar MLS as Distributed by MLS Grid
- 2026-04-09 Price Changed $169,000 Stellar MLS as Distributed by MLS Grid
- 2026-03-10 Price Changed $175,000 Stellar MLS as Distributed by MLS Grid
- 2026-03-02 Sold (Public Records) $64,000 Public Records
- 2026-02-24 Listed $189,000 Stellar MLS as Distributed by MLS Grid
- 2012-11-25 Listing Removed — Stellar MLS as Distributed by MLS Grid
- 2012-10-23 Listed $134,900 Stellar MLS as Distributed by MLS Grid
- 1997-04-30 Sold (Public Records) $76,000 Public Records
- 1993-03-01 Sold (Public Records) $82,000 Public Records
- 1991-07-01 Sold (Public Records) $82,000 Public Records
Property tax history
+13.4%/yrLatest (2025): $4,885 · +11.2% YoY. Source: county tax records.
Cash-flow waterfall
monthlySold comps — $/sqft
last 12 mo · ≤1 miLoading sold comps…