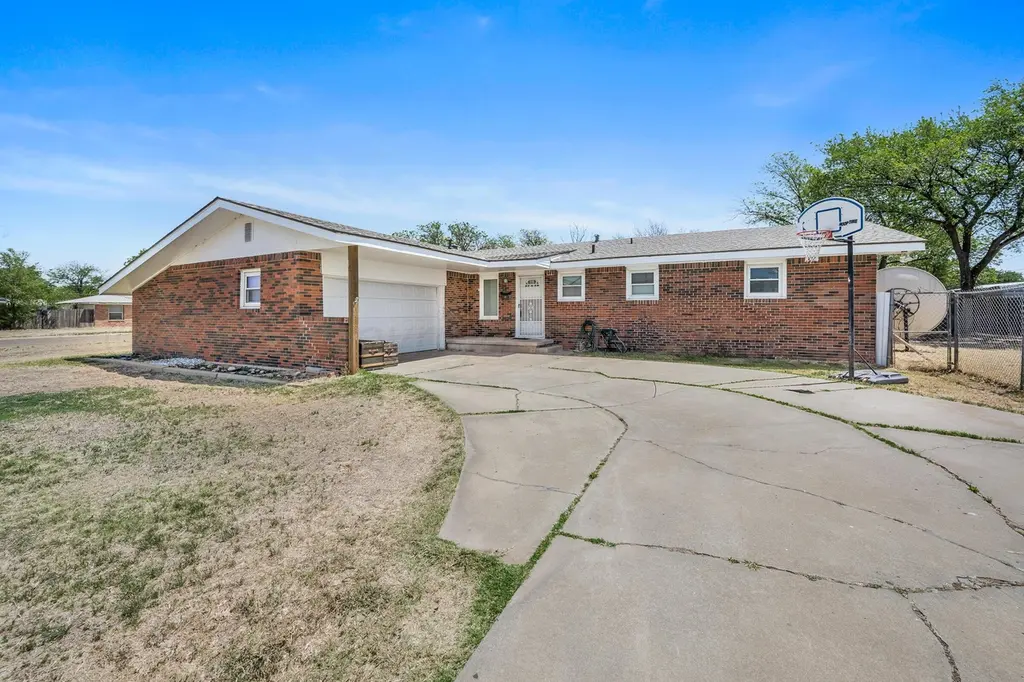
1401 S Seminole St · Amarillo, TX
Flood risk 1/10 · Minimal
- FEMA flood zone
- X (unshaded)
- Chance of flooding over 30 yrs
- 0.0%
- Est. flood insurance / yr
- $507 – $1,088
Fire risk 9/10 · Severe
- Est. fire insurance / yr
- $1,222 – $2,270
Heat risk 4/10 · Minor
- Hot days now (above 97°F)
- 7 days/yr
- Hot days in 30 yrs
- 18 days/yr
Wind risk 2/10 · Minimal
- Chance of severe wind over 30 yrs
- —
Air-quality risk 2/10 · Minimal
- Unhealthy air days now
- 1 days/yr
- Unhealthy air days in 30 yrs
- 1 days/yr
Risk factors via First Street. Map © Google.
Why this score? — see what drove the D grade
The composite is a weighted blend of 9 inputs, each scored 0–100. Each bar is that input's sub-score; the figure is the points it added to the 100-point composite (weight × sub-score).
- Appreciation +9.7/10.0
- ARV discount +7.5/15.0
- Cash flow +7.3/30.0
- Schools +3.6/10.0
- Livability +3.3/5.0
- 1% rule +3.1/10.0
- Rent growth +2.5/5.0
- Condition / age +2.5/5.0
- DSCR +1.5/10.0
$170,000
🖨 Deal sheet (PDF) 📄 Offer letter ✓ Due diligence
Listing remarks
Looking for an affordable brick, 3 bedroom, 2 bathroom home for sale with central heat and air? Don't miss this one! Situated on a large corner lot with a huge 2 car garage. Property also includes the lot next door that has cleanout access if you wanted to park your RV / Camper or even build a second home or in law suite. Inside you will find updated windows, a large living room with wood burning fireplace, large kitchen area with tons of cabinets. The possibilities are endless with this well priced home. Per seller roof is less than 1 year old. Schedule your showing today!
Key facts
- Huge 2 car garage
- Large corner lot
- Central heat and air
Tags
Property features AI
Exterior
- Parking: Attached oversized garage with 2 spaces; Garage door opener; Additional parking with RV access
- Utilities: Public water; Public sewer
- Home design: Single-family residence; One-level
- Construction: Brick/brick veneer construction; Composition roof; Pillar/post/pier foundation; Built on a 0.32-acre lot
- Exterior features: Corner lot; Chain link and wood fencing; No pool
Interior
- Kitchen: Range; Dishwasher
- Bathrooms: 2 full bathrooms
- Heating & cooling: Central heating (natural gas); Central air conditioning; Ceiling fans
- Interior features: Wood-burning fireplace in the living room; Range; Dishwasher
- Laundry & utility: Laundry located in the garage
Neighborhood map
What this means for you Summary
Snapshot
- This is a 3-bed/2.0-bath single-family listed at $170k.
Deal economics
- At list price, monthly cash flow is $-224 ($-3k/yr) — negative.
- To cash-flow at today's rent, offer at most $130k (23.3% below list).
- To meet the 1% rule (rent ≥ 1% of price), the offer needs to be $138k (19.0% below list).
- Recommended offer: $130k (23.3% below list) — sets the bar for cash-flow.
Location & tenants
- Location reads 66/100 on livability (#624 in TX) — a middle-class / working-renter tenant base. Strengths: cost of living A+, housing A+; Watch: amenities C-, crime F, commute F.
- Amarillo ISD (urban): math 44% / reading 41% proficiency, ranked #336 of 826 in TX (top 41%) — families likely to look elsewhere, expect single-tenant / working-renter base with shorter leases.
- Zoned schools: Humphrey'S Highland El (math 39% / reading 47%, grade F, #1,283 of 4,322 statewide, top 30%, 509 students, 90% FRL); Bowie Middle (math 32% / reading 37%, grade F, #858 of 1,662 statewide, top 54%, 748 students, 87% FRL); Caprock H S (math 33% / reading 34%, grade F, #1,011 of 1,632 statewide, top 63%, 2,090 students, 76% FRL) — zoned schools average 85% FRL vs 58% district-wide (26 pts higher); higher-poverty schools than district average — tighter screening recommended.
- Market conditions: 14 active listings in the ZIP; 4 comparable units currently listed for rent nearby; rentals lingering (median 45d on market — plan ~5-8 weeks vacancy on turnover, expect pricing pressure); 75% of comp listings sitting > 30 days — soft ceiling on asking rent; 1,214 units permitted in Potter County in 2024 (650 in 5+ unit buildings).
Forward outlook
- In year one you build about $17k of equity ($1k loan paydown + $16k appreciation (9.4% local appreciation)).
- By year 3, paydown + projected appreciation supports a ~$43k cash-out refi (75% LTV) — recoverable capital for the next deal without selling this one.
Negotiation context
- Only 10 days on market — expect competitive offers; lowballing is unlikely to land.
Risks & watch-outs
- Climate carrying-cost: severe wildfire risk — expect insurance premiums to compound above CPI over the hold.
Questions for the listing agent
- What do current leases actually rent for vs. the listed asking? Can we see a recent rent roll and the last 12 months of T-12 income?
- Built in 1961 — when were the roof, HVAC, electrical panel, plumbing, and water heater last replaced?
- Is there a deadline driving the sale (1031 exchange, divorce, estate, relocation)? That informs how much negotiation room exists.
- Schools are D-rated, which usually means shorter tenancies and higher turnover. Who's the typical renter profile here, and what's been the actual vacancy rate?
- Crime grade is F in this area — have there been break-ins, vandalism, or insurance claims at this property in the last 3 years? What carrier currently insures it and at what premium?
- The area grade is low — what's the realistic commute time and amenity access for the typical tenant pool here? Any planned neighborhood developments (good or bad) we should know about?
- What's the average days-on-market for RENTAL listings here right now (not sales)? A rising rental-DOM trend means longer vacancies and softer asking-rent achievability than the comps imply.
- What's the recent tenant-quality profile in this submarket — average credit score on applications, eviction rate, late-payment / NSF rate, and stable-employment percentage? A property-management company in the area should have these aggregated.
- How much new for-sale + rental construction is in the pipeline within 1–3 miles? Heavy new supply typically softens prices + rents 12–24 months out; constrained supply supports both.
Investment metrics
- 1% rule
- 0.81% ✗
- Cap rate
- 4.71%
- Cash-on-cash
- -5.64%
- DSCR
- 0.75
- GRM
- 10.3
CMA / ARV
No comps found within radius.
Projected returns pro-forma
9.38% appreciation · 3.0% rent growth · sell at horizon
- IRR
- 18.9%
- Equity multiple
- 2.50×
- Total profit
- $71,246
- Equity at exit
- $145,502
- IRR
- 17.6%
- Equity multiple
- 5.61×
- Total profit
- $219,566
- Equity at exit
- $305,984
Cash invested: $47,600 (down + closing). Projections, not guarantees.
Landlord ↔ Tenant lean methodology
- Overall (STATE)
- 87 Strongly Landlord-Friendly
- State Texas
- 87 Strongly Landlord-Friendly · R+5
- County
- — inherits STATE
- City
- — inherits STATE
ZIP-level market 79104
- Home prices YoY
- 4.5%
- Active inventory
- 14
- Price-to-rent
- 10.3×
Monthly cashflow live
- Estimated rent
- $1,377 medium interval (Pro) →
- Mortgage (P&I)
- −$891
- Tax from tax record
- −$349 /mo · $4,193/yr
- Insurance
- −$71
- HOA
- −$0
- Vacancy / Maint / Mgmt
- −$289
- Net cashflow
- $-224
Break-even live
Sensitivity live
| Price | -10% $-128 | -5% $-176 | +0% $-224 | +5% $-272 | +10% $-320 |
|---|---|---|---|---|---|
| Rent | -10% $-333 | -5% $-278 | +0% $-224 | +5% $-169 | +10% $-115 |
| Rate | -1.0pp $-138 | -0.5pp $-181 | base $-224 | +0.5pp $-268 | +1.0pp $-313 |
UW: 25.0% down · 7.5% · 30yr · 1.5% tax · 5.0% vac · 8.0% maint · 8.0% mgmt
Financing live
Cash to close
- Down payment
- $42,500
- Closing costs
- $5,100
- Reserves months
- —
- Total cash needed
- —
Loan-product check · same deal, 3 products live
Conventional
25% down · 7.5% · 30yr
- Down + closing
- —
- Monthly P&I
- —
- Monthly cashflow
- —
- DSCR
- —
- Eligible?
- —
Personal DTI + credit; lowest rate.
DSCR
20% down · 8.5% · 30yr
- Down + closing
- —
- Monthly P&I
- —
- Monthly cashflow
- —
- DSCR
- —
- Eligible?
- —
No personal income docs; deal must DSCR.
Hard money
10% down · 12.0% · 12mo
- Down + closing
- —
- Monthly P&I
- —
- Monthly cashflow
- —
- DSCR
- —
- Eligible?
- —
Short-term bridge; refi at stabilization.
Rent comps 4 comps
| Address | Beds | Baths | Sqft | Rent | $/sqft | DOM | Units | Dist |
|---|---|---|---|---|---|---|---|---|
| 621 S Hill St Amarillo, TX | 3.0 | 2.0 | 1240 | $1,600 | $1.29 | 44d | 1 | 0.57mi |
| 2715 S Marrs St Amarillo, TX | 3.0 | 1.5 | 1274 | $1,295 | $1.02 | 44d | 1 | 0.82mi |
| 901 S Roberts St Amarillo, TX | 2.0 | 1.0 | 1068 | $1,200 | $1.12 | 44d | 1 | 1.27mi |
| 2321 S Eastern St Amarillo, TX | 3.0 | 1.0 | 1270 | $1,150 | $0.91 | 11d | 1 | 1.37mi |
Listing history 4 events
-
2026-05-23status Pending
-
2026-05-19historical Active Under Contract
-
2026-05-14$170,000 Active
-
2020-12-07soldstatus
ⓘ Source: listings_history table (triggers on properties + properties_extension) + one-shot
backfill from property_details.listing_events for pre-trigger history.
Tax reassessment forecast TX · Resets to sale price
- Current annual tax
- $4,193 · $349/mo
- Projected year-2 tax
- $4,193 · $349/mo
- Expected delta
- $0/yr ($0/mo · 0.0%)
ⓘ Screening estimate from a state-policy table — verify with the county assessor before closing.
Climate risk First Street
- Flood 1/10 Low FEMA zone X (unshaded) · 0% chance over 30 yrs
- Wildfire 9/10 Extreme
- Heat 4/10 Moderate 7 d/yr ≥97°F today · 18 d/yr by 30 yrs out
- Wind 2/10 Low
- Air quality 2/10 Low 1 unhealthy d/yr today · 1 by 30 yrs out
Nearby sold comps map
Loading sold comps map…
Walkable amenities ~0.75 mi
Loading nearby amenities…
Taxation est. · year 1
- Rental income
- $16,525
- − Mortgage interest
- −$9,523
- − Property taxes
- −$4,193
- − Insurance
- −$850
- − Repairs & maintenance
- −$1,322
- − Management
- −$1,322
- − Depreciation
- −$4,945
- Taxable loss
- −$5,630
- Est. tax savings @ 24.0%
- +$1,351
- After-tax cash flow
- $-1,335/yr
For passive investors: Depreciation is non-cash, so a rental often shows a tax loss while cash-flowing — sheltering income. Rental losses are passive: they offset passive income freely, and up to $25,000/yr can offset ordinary (W-2) income if you actively participate and your MAGI is under $100k (phasing out to $0 by $150k); unused losses carry forward. On sale, claimed depreciation is recaptured at up to 25%, and gains may owe capital-gains tax (a 1031 exchange can defer both). Figures are a year-1 estimate at your 24.0% rate — not tax advice; consult a CPA.
Schools (NCES district)
- District
- Amarillo ISD
- NCES district ID
- 4808130
- Math proficiency
- 44% ▼ -9.00%
- Reading proficiency
- 41% ▼ -3.00%
- Median HH income
- $43,478
- Composite
- 35.96/100
- National rank
- #4798
- State rank
- #336 of 826 in TX
Livability — Amarillo
- Score
- 66/100
- State rank
- #624
- US rank
- #11876
Category grades
Schools grade is shown separately in the Schools card above.
Census & demographics
- Census place
- Amarillo, TX
- City population
- 185,802
- Population (ZIP)
- 7,236
Population outlook (Potter County) Hauer SSP2
- Today (2025)
- 121,296 people
- By 2030
- 120,883 · -0.3%
- By 2040
- 119,668 · -1.3%
- By 2050
- 117,788 · -2.9%
- By 2075
- 110,250 · -9.1%
- By 2100
- 92,923 · -23.4%
Race, ethnicity, and origin ACS 2023
- Neighborhood character
- Predominantly Hispanic (71%)
- Race & ethnicity
- Hispanic / Latino 71% Two or more races 33% White 22% Black 3% Asian 2%
- Hispanic origin (detail)
- Mexican 67%
- Common ancestry
- Lithuanian 2% Iranian 2% Slovak 1%
- Foreign-born
- 18% · Canada, Vietnam
- Languages at home
- 56% English-only · Spanish 42% Other Indo-European 1% Other Asian/Pacific 1%
Political lean MEDSL · Potter
- 2024 margin
- Solid R (+44.4) · D 27.3% · R 71.7% · Other 1.1%
- 2008→2024 swing
- -5.0pp toward R · 2008: -39.4pp · 2024: -44.4pp
- All cycles
- 2024: R+44.4 2020: R+38.7 2016: R+41.9 2012: R+44.6 2008: R+39.4
Not yet ingested
- Civics
- —
Market trends
- HPI YoY
- ▲ 9.38%
- Current HPI
- 217.4814
- Rent YoY
- —
- Metro
- —
- State GDP YoY
- ▲ 3.95%
- F500 in state
- 110
Industry mix (Fortune 500 HQ in TX)
| Industry | F500 HQs | Revenue |
|---|---|---|
| Energy | 16 | $1,198B |
|
||
| Technology | 5 | $198B |
|
||
| Engineering / Construction | 4 | $72B |
|
||
| Energy Services | 3 | $60B |
|
||
| Utilities | 3 | $41B |
|
||
| Healthcare | 2 | $330B |
|
||
Price history
4 events — show timeline
- 2026-05-23 Pending — AARMLS
- 2026-05-19 Contingent — AARMLS
- 2026-05-14 Listed $170,000 AARMLS
- 2020-12-07 Sold (Public Records) — Public Records
Property tax history
+6.2%/yrLatest (2025): $4,193 · +33.6% YoY. Source: county tax records.
Cash-flow waterfall
monthlySold comps — $/sqft
last 12 mo · ≤1 miLoading sold comps…