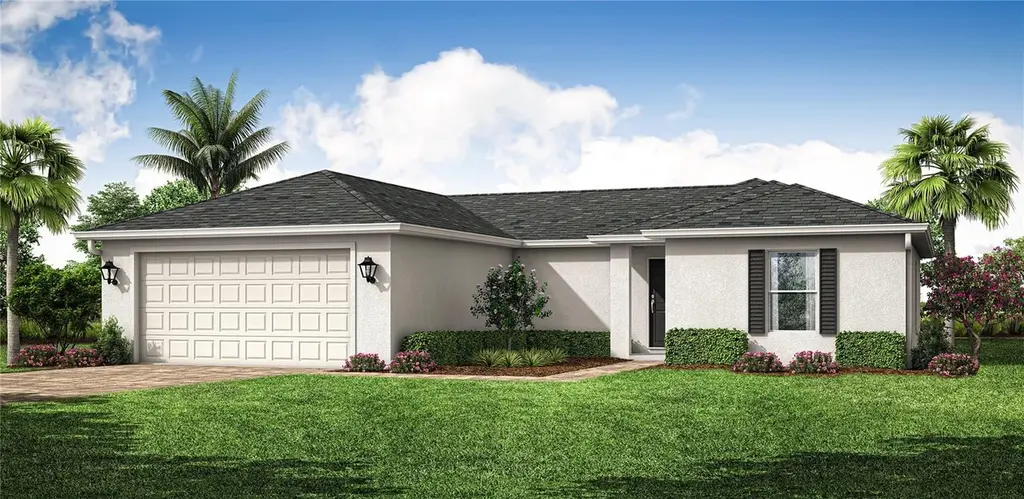
12339 Appleberg Cir · Port Charlotte, FL
Flood risk 7/10 · Major
- FEMA flood zone
- X (unshaded)
- Chance of flooding over 30 yrs
- 0.95%
- Est. flood insurance / yr
- $507 – $1,088
Fire risk 2/10 · Minimal
- Est. fire insurance / yr
- $947 – $1,759
Heat risk 10/10 · Severe
- Hot days now (above 107°F)
- 4 days/yr
- Hot days in 30 yrs
- 17 days/yr
Wind risk 10/10 · Severe
- Chance of severe wind over 30 yrs
- 99.0%
Air-quality risk 2/10 · Minimal
- Unhealthy air days now
- 1 days/yr
- Unhealthy air days in 30 yrs
- 1 days/yr
Risk factors via First Street. Map © Google.
Why this score? — see what drove the D+ grade
The composite is a weighted blend of 9 inputs, each scored 0–100. Each bar is that input's sub-score; the figure is the points it added to the 100-point composite (weight × sub-score).
- Cash flow +16.3/30.0
- ARV discount +7.5/15.0
- DSCR +5.1/10.0
- Schools +4.6/10.0
- Rent growth +3.8/5.0
- Livability +3.2/5.0
- 1% rule +3.1/10.0
- Condition / age +2.5/5.0
- Appreciation +0.0/10.0
$287,990
🖨 Deal sheet (PDF) 📄 Offer letter ✓ Due diligence
Listing remarks MLS
City water and sewer available! Area of newer homes. Buy to build or hold on to for investment. This lot is not located in a designated Scrub Jay zone per county GIS mapping.
Key facts
- Open floor plan
- Private bathroom
- Vaulted ceilings
Tags
Neighborhood map
What this means for you Summary
Snapshot
- This is a 4-bed/2.0-bath land listed at $288k.
Deal economics
- At list price, monthly cash flow is $94 ($1k/yr) — positive.
- The deal already cash-flows at list — no discount required.
- To meet the 1% rule (rent ≥ 1% of price), the offer needs to be $233k (19.1% below list).
- Recommended offer: $233k (19.1% below list) — sets the bar for 1% rule.
- Cap rate 7.0% vs local median 4.4% in Port Charlotte — top-decile yield for the area; either an underpriced asset or a hidden risk that comps aren't pricing in. Stress-test before assuming the spread holds.
Location & tenants
- Location reads 65/100 on livability (#655 in FL) — a middle-class / working-renter tenant base. Strengths: cost of living A+, housing A+; Watch: employment D, amenities F, commute F.
- Charlotte (suburban): math 54% / reading 54% proficiency, ranked #22 of 73 in FL (top 30%) — acceptable for families but not a draw, mixed tenant base, ~2y average lease.
- Zoned schools: Myakka River Elementary School (math 65% / reading 60%, grade B, #601 of 2,144 statewide, top 28%, 608 students, 51% FRL); L. A. Ainger Middle School (math 65% / reading 53%, grade B, #144 of 571 statewide, top 26%, 720 students, 40% FRL); Lemon Bay High School (math 50% / reading 56%, grade C-, #148 of 667 statewide, top 23%, 1,360 students, 28% FRL).
- Market conditions: Rents rising fast (+5.3%/yr); 2198 active listings in the ZIP; 21 comparable units currently listed for rent nearby; rentals at typical pace (median 23d on market — plan ~3-4 weeks tenant-placement turnaround); solid renter incomes; 4,585 units permitted in Charlotte County in 2024 (703 in 5+ unit buildings).
- This rent runs 33% of the median local income ($84k/yr) — at the standard rent-burdened threshold; future hikes will face affordability resistance.
Forward outlook
- Local home prices are declining (-3.0%/yr); year-one equity from $2k of loan paydown is wiped out by about $9k of value loss. Plan a longer hold.
- Charlotte County population projected at +24% by 2050 — long-run rental-demand tailwind backs the buy-and-hold thesis.
Negotiation context
- It's been on market 39 days — a 3% lower offer ($279k) is reasonable based on typical stale-listing flexibility.
- 2 sale attempts since 2y ago with the ask held roughly flat each time — persistent listings suggest the price (not the market) is what's stuck; bring a comps-based counter.
- Current owner paid $15k; list at $288k implies a 1820% gain — meaningful room to come down on a strong offer.
Risks & watch-outs
- Watch-outs: flood insurance adds $66/mo.
- Climate carrying-cost: major flood risk; severe wind risk, 99% chance of damaging wind over 30y; extreme-heat days projected 4→17/yr by 2055 (HVAC capex compounding) — expect insurance premiums to compound above CPI over the hold.
Questions for the listing agent
- It's been on market 39 days. Have you received any prior offers? Is the seller open to a 19% concession, seller financing, or rate buy-down credit?
- What's the actual annual flood-insurance premium (NFIP or private), and is the property in a SFHA with mandatory coverage?
- Is there a deadline driving the sale (1031 exchange, divorce, estate, relocation)? That informs how much negotiation room exists.
- Schools are D-rated, which usually means shorter tenancies and higher turnover. Who's the typical renter profile here, and what's been the actual vacancy rate?
- The area grade is low — what's the realistic commute time and amenity access for the typical tenant pool here? Any planned neighborhood developments (good or bad) we should know about?
- What's the average days-on-market for RENTAL listings here right now (not sales)? A rising rental-DOM trend means longer vacancies and softer asking-rent achievability than the comps imply.
- What's the recent tenant-quality profile in this submarket — average credit score on applications, eviction rate, late-payment / NSF rate, and stable-employment percentage? A property-management company in the area should have these aggregated.
- How much new for-sale + rental construction is in the pipeline within 1–3 miles? Heavy new supply typically softens prices + rents 12–24 months out; constrained supply supports both.
Investment metrics
- 1% rule
- 0.81% ✗
- Cap rate
- 6.96%
- Cash-on-cash
- 2.39%
- DSCR
- 1.11
- GRM
- 10.3
CMA / ARV
No comps found within radius.
Projected returns pro-forma
-3.0% appreciation · 5.29% rent growth · sell at horizon
- IRR
- -11.9%
- Equity multiple
- 0.56×
- Total profit
- $-35,309
- Equity at exit
- $42,940
- IRR
- 0.0%
- Equity multiple
- 1.00×
- Total profit
- $113
- Equity at exit
- $24,900
Cash invested: $80,637 (down + closing). Projections, not guarantees.
Landlord ↔ Tenant lean methodology
- Overall (STATE)
- 87 Strongly Landlord-Friendly
- State Florida
- 87 Strongly Landlord-Friendly · R+3
- County
- — inherits STATE
- City
- — inherits STATE
ZIP-level market 33981
- Home prices YoY
- -7.5%
- Rents YoY
- 5.3%
- Active inventory
- 2198
- Price-to-rent
- 10.3×
Monthly cashflow live
- Estimated rent
- $2,331 high interval (Pro) →
- Mortgage (P&I)
- −$1,510
- Tax from tax record
- −$51 /mo · $609/yr
- Insurance
- −$120
- Flood insurance flood zone
- −$66 /mo · $798/yr
- HOA
- −$0
- Vacancy / Maint / Mgmt
- −$489
- Net cashflow
- $94
Break-even live
Sensitivity live
| Price | -10% $257 | -5% $175 | +0% $94 | +5% $12 | +10% $-414 |
|---|---|---|---|---|---|
| Rent | -10% $-90 | -5% $2 | +0% $94 | +5% $186 | +10% $278 |
| Rate | -1.0pp $239 | -0.5pp $167 | base $94 | +0.5pp $19 | +1.0pp $-57 |
UW: 25.0% down · 7.5% · 30yr · 1.5% tax · 5.0% vac · 8.0% maint · 8.0% mgmt
Financing live
Cash to close
- Down payment
- $71,998
- Closing costs
- $8,640
- Reserves months
- —
- Total cash needed
- —
Loan-product check · same deal, 3 products live
Conventional
25% down · 7.5% · 30yr
- Down + closing
- —
- Monthly P&I
- —
- Monthly cashflow
- —
- DSCR
- —
- Eligible?
- —
Personal DTI + credit; lowest rate.
DSCR
20% down · 8.5% · 30yr
- Down + closing
- —
- Monthly P&I
- —
- Monthly cashflow
- —
- DSCR
- —
- Eligible?
- —
No personal income docs; deal must DSCR.
Hard money
10% down · 12.0% · 12mo
- Down + closing
- —
- Monthly P&I
- —
- Monthly cashflow
- —
- DSCR
- —
- Eligible?
- —
Short-term bridge; refi at stabilization.
Rent comps 21 comps
| Address | Beds | Baths | Sqft | Rent | $/sqft | DOM | Units | Dist |
|---|---|---|---|---|---|---|---|---|
| 12223 Maltz Ave Unit 12225" Port Charlotte, FL | 3.0 | 2.0 | 1162 | $1,649 | $1.42 | 22d | 1 | 0.29mi |
| 12223 Maltz Ave Unit 12223 Port Charlotte, FL | 3.0 | 2.0 | 1162 | $1,647 | $1.42 | 22d | 1 | 0.29mi |
| 5496 Brussels Ter Port Charlotte, FL | 3.0 | 2.0 | 1400 | $3,900 | $2.79 | 22d | 1 | 0.41mi |
| 12129 Grosspoint Ave Port Charlotte, FL | 3.0 | 2.0 | 1388 | $2,300 | $1.66 | 22d | 1 | 0.60mi |
| 6464 David Blvd Port Charlotte, FL | 3.0 | 2.0 | 1613 | $1,716 | $1.06 | 22d | 1 | 0.64mi |
| 5311 Levy Ln Port Charlotte, FL | 3.0 | 2.0 | 1192 | $1,850 | $1.55 | 15d | 1 | 0.66mi |
| 13184 Eureka Cir Port Charlotte, FL | 3.0 | 2.0 | 1640 | $2,300 | $1.40 | 22d | 1 | 0.70mi |
| 6193 Seaport St Port Charlotte, FL | 3.0 | 2.0 | 1613 | $1,966 | $1.22 | 15d | 1 | 0.77mi |
| 6628 Thorman Rd Port Charlotte, FL | 3.0 | 2.0 | 1116 | $1,800 | $1.61 | 22d | 1 | 0.84mi |
| 12073 Henley Ave Port Charlotte, FL | 3.0 | 2.0 | 1263 | $1,795 | $1.42 | 22d | 1 | 0.91mi |
| 13280 Foresman Blvd Port Charlotte, FL | 3.0 | 2.0 | 1500 | $2,800 | $1.87 | 15d | 1 | 0.92mi |
| 13349 Buckett Cir Port Charlotte, FL | 3.0 | 3.0 | 1560 | $2,795 | $1.79 | 22d | 1 | 0.93mi |
| 13288 Fowler Ave Port Charlotte, FL | 3.0 | 2.0 | 1203 | $2,500 | $2.08 | 22d | 1 | 0.95mi |
| 6351 Coniston St Port Charlotte, FL | 3.0 | 2.0 | 1200 | $1,950 | $1.62 | 22d | 1 | 0.96mi |
| 6460 Blueberry Dr Englewood, FL | 3.0 | 2.0 | 1672 | $1,800 | $1.08 | 22d | 1 | 1.01mi |
| 6248 Drucker Cir Port Charlotte, FL | 3.0 | 2.0 | 1414 | $1,810 | $1.28 | 15d | 1 | 1.10mi |
| 6551 Coliseum Blvd Port Charlotte, FL | 3.0 | 2.0 | 1386 | $1,850 | $1.33 | 15d | 1 | 1.22mi |
| 11383 Baggot Ave Englewood, FL | 3.0 | 2.0 | 1535 | $2,000 | $1.30 | 22d | 1 | 1.23mi |
| 12005 Helicon Ave Port Charlotte, FL | 4.0 | 2.0 | 1636 | $2,800 | $1.71 | 22d | 1 | 1.40mi |
| 11225 Pendleton Ave Englewood, FL | 3.0 | 2.0 | 1164 | $1,545 | $1.33 | 15d | 1 | 1.44mi |
| 11223 Pendleton Ave Englewood, FL | 3.0 | 3.0 | 1164 | $1,545 | $1.33 | 15d | 1 | 1.45mi |
Listing history 9 events
-
2026-04-24status Pending
-
2026-04-08price $287,990
-
2026-04-01price $289,990
-
2026-03-16$294,990 Active
-
2025-11-07soldstatus $15,000 Closed 175-char remark
Show marketing remark (175 chars)
City water and sewer available! Area of newer homes. Buy to build or hold on to for investment. This lot is not located in a designated Scrub Jay zone per county GIS mapping.
-
2025-11-07soldstatus $15,000
Show marketing remark (175 chars)
City water and sewer available! Area of newer homes. Buy to build or hold on to for investment. This lot is not located in a designated Scrub Jay zone per county GIS mapping.
-
2025-10-08status Pending 175-char remark
Show marketing remark (175 chars)
City water and sewer available! Area of newer homes. Buy to build or hold on to for investment. This lot is not located in a designated Scrub Jay zone per county GIS mapping.
-
2025-10-07price $15,000 175-char remark
Show marketing remark (175 chars)
City water and sewer available! Area of newer homes. Buy to build or hold on to for investment. This lot is not located in a designated Scrub Jay zone per county GIS mapping.
-
2024-04-25$30,000 Active 175-char remark
Show marketing remark (175 chars)
City water and sewer available! Area of newer homes. Buy to build or hold on to for investment. This lot is not located in a designated Scrub Jay zone per county GIS mapping.
ⓘ Source: listings_history table (triggers on properties + properties_extension) + one-shot
backfill from property_details.listing_events for pre-trigger history.
Tax reassessment forecast FL · Resets to sale price
- Current annual tax
- $609 · $51/mo
- Projected year-2 tax
- $2,390 · $199/mo
- Expected delta
- +$1,781/yr (+$148/mo · 292.3%)
ⓘ Screening estimate from a state-policy table — verify with the county assessor before closing.
Climate risk First Street
- Flood 7/10 Severe FEMA zone X (unshaded) · 95% chance over 30 yrs
- Wildfire 2/10 Low
- Heat 10/10 Extreme 4 d/yr ≥107°F today · 17 d/yr by 30 yrs out
- Wind 10/10 Extreme 99% chance of damaging wind over 30 yrs
- Air quality 2/10 Low 1 unhealthy d/yr today · 1 by 30 yrs out
Nearby sold comps map
Loading sold comps map…
Walkable amenities ~0.75 mi
Loading nearby amenities…
Taxation est. · year 1
- Rental income
- $27,970
- − Mortgage interest
- −$16,132
- − Property taxes
- −$609
- − Insurance
- −$2,237
- − Repairs & maintenance
- −$2,238
- − Management
- −$2,238
- − Depreciation
- −$8,378
- Taxable loss
- −$3,862
- Est. tax savings @ 24.0%
- +$927
- After-tax cash flow
- $2,053/yr
For passive investors: Depreciation is non-cash, so a rental often shows a tax loss while cash-flowing — sheltering income. Rental losses are passive: they offset passive income freely, and up to $25,000/yr can offset ordinary (W-2) income if you actively participate and your MAGI is under $100k (phasing out to $0 by $150k); unused losses carry forward. On sale, claimed depreciation is recaptured at up to 25%, and gains may owe capital-gains tax (a 1031 exchange can defer both). Figures are a year-1 estimate at your 24.0% rate — not tax advice; consult a CPA.
Schools (NCES district)
- District
- Charlotte
- NCES district ID
- 1200240
- Math proficiency
- 54% ▼ -6.00%
- Reading proficiency
- 54% ▼ -1.00%
- Median HH income
- $44,864
- Composite
- 45.62/100
- National rank
- #2586
- State rank
- #22 of 73 in FL
Livability — Port Charlotte
- Score
- 65/100
- State rank
- #655
- US rank
- #13081
Category grades
Schools grade is shown separately in the Schools card above.
Census & demographics
- County
- Charlotte County · 196,994 people
- City population
- 102,180
- Metro
- Punta Gorda, FL
- Population (ZIP)
- 15,622
- Household income
- $84,098
- Rent vs Own
- Severe rent burden
- 105.0
Population outlook (Charlotte County) Hauer SSP2
- Today (2025)
- 198,646 people
- By 2030
- 210,507 · +6.0%
- By 2040
- 230,857 · +16.2%
- By 2050
- 247,148 · +24.4%
- By 2075
- 281,777 · +41.8%
- By 2100
- 293,609 · +47.8%
Race, ethnicity, and origin ACS 2023
- Neighborhood character
- Predominantly White (89%)
- Race & ethnicity
- White 89% Two or more races 4% Hispanic / Latino 4% Black 2% Asian 1%
- Common ancestry
- Romanian 4% Lithuanian 3% Italian 2%
- Foreign-born
- 6% · Canada
- Languages at home
- 96% English-only · Spanish 1% German/W. Germanic 1% Tagalog/Filipino 1%
Political lean MEDSL · Charlotte
- 2024 margin
- Solid R (+34.0) · D 32.7% · R 66.7%
- 2008→2024 swing
- -26.7pp toward R · 2008: -7.2pp · 2024: -34.0pp
- All cycles
- 2024: R+34.0 2020: R+26.6 2016: R+27.8 2012: R+14.3 2008: R+7.2
Not yet ingested
- Civics
- —
Market trends
- HPI YoY
- ▼ -28.09%
- Current HPI
- 346.5247
- Rent YoY
- ▲ 5.29%
- Metro
- Punta Gorda, FL
- State GDP YoY
- ▲ 3.28%
- F500 in state
- 36
Industry mix (Fortune 500 HQ in FL)
| Industry | F500 HQs | Revenue |
|---|---|---|
| Industrial Technology | 2 | $29B |
|
||
| Insurance | 2 | $17B |
|
||
| Retail | 1 | $60B |
|
||
| Technology Distribution | 1 | $58B |
|
||
| Homebuilding | 1 | $35B |
|
||
| Technology Manufacturing | 1 | $35B |
|
||
Price history
+860.0% since first listed9 events — show timeline
- 2026-04-24 Pending — Stellar MLS as Distributed by MLS Grid
- 2026-04-08 Price Changed $287,990 Stellar MLS as Distributed by MLS Grid
- 2026-04-01 Price Changed $289,990 Stellar MLS as Distributed by MLS Grid
- 2026-03-16 Listed $294,990 Stellar MLS as Distributed by MLS Grid
- 2025-11-07 Sold (Public Records) $15,000 Public Records
- 2025-11-07 Sold (MLS) $15,000 Stellar MLS as Distributed by MLS Grid
- 2025-10-08 Pending — Stellar MLS as Distributed by MLS Grid
- 2025-10-07 Price Changed $15,000 Stellar MLS as Distributed by MLS Grid
- 2024-04-25 Listed $30,000 Stellar MLS as Distributed by MLS Grid
Property tax history
+8.6%/yrLatest (2025): $609 · +22.2% YoY. Source: county tax records.
Cash-flow waterfall
monthlySold comps — $/sqft
last 12 mo · ≤1 miLoading sold comps…