 Multi-family
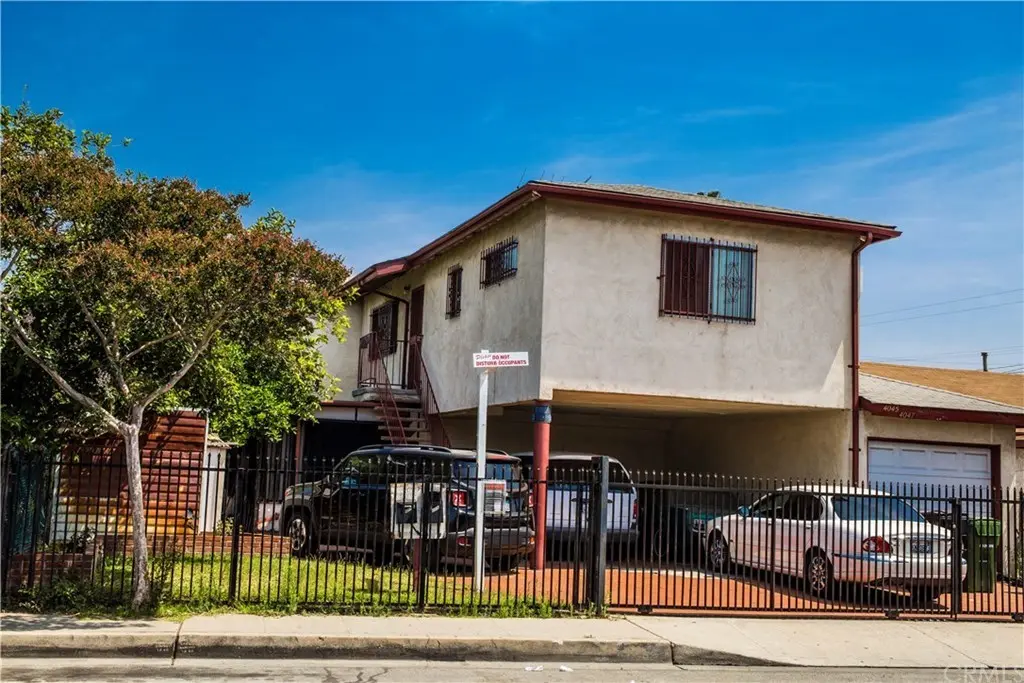
4045 Dennison St · East Los Angeles, CA
Flood risk 3/10 · Minor
- FEMA flood zone
- X (unshaded)
- Chance of flooding over 30 yrs
- 0.1%
- Est. flood insurance / yr
- $507 – $1,088
Fire risk 1/10 · Minimal
- Est. fire insurance / yr
- $659 – $1,223
Heat risk 6/10 · Moderate
- Hot days now (above 92°F)
- 7 days/yr
- Hot days in 30 yrs
- 21 days/yr
Wind risk 1/10 · Minimal
- Chance of severe wind over 30 yrs
- —
Air-quality risk 5/10 · Moderate
- Unhealthy air days now
- 9 days/yr
- Unhealthy air days in 30 yrs
- 9 days/yr
Risk factors via First Street. Map © Google.
Why this score? — see what drove the D- grade
The composite is a weighted blend of 9 inputs, each scored 0–100. Each bar is that input's sub-score; the figure is the points it added to the 100-point composite (weight × sub-score).
- Cash flow +12.8/30.0
- ARV discount +7.5/15.0
- DSCR +3.8/10.0
- Schools +3.6/10.0
- 1% rule +3.2/10.0
- Livability +3.0/5.0
- Rent growth +2.6/5.0
- Condition / age +2.5/5.0
- Appreciation +0.0/10.0
$1,299,999
🖨 Deal sheet 📄 Offer letter ✓ Due diligence
Multi-family units
County records classify this as Multi-Family (2-4 Unit). Listing-text estimate: 1 unit. estimate disagrees with records
Listing remarks MLS
Great INVESTMENT opportunity! Own an amazing cash producing fourplex in the heart of East Los Angeles. This MASSIVE property sits on more than 8,000 square feet and offers almost 3,600 square feet of living space. The property boasts one duplex that features a 3 Bedroom, 2 Bath Unit upstairs and a 2 Bedroom 1 bath unit downstairs; the property also offers two independent single family dwellings of 2 Bedroom, One Bath each . Zoned R4, in a rare space in Los Angeles that is not under the City of Los Angeles Rent Control ordinance. .. THAT'S RIGHT NO RENT CONTROL. A rare opportunity so close to the hustle and bustle of the city. Property will be sold vacant at the request of any prospective buyer so that they may occupy any of the residences to take advantage of all financing options available. * * * AGENTS PLEASE READ UPDATED AGENT REMARKS * * *
Key facts
- Expansive lot
- Development upside
- Future lot split
Tags
Property features AI
Finance
- Other: Total building area reported as 3,649; Property distributed across 3 buildings
- Financial info: Total of 4 residential units; Gross income: $126,000; Gross scheduled income: $117,360; Net operating income: $94,561; Gross multiplier: 13; Operating expense: $6,600; Total expenses: $11,800; Expense breakdown includes: Insurance $5,200; Water/Sewer $4,800; Electric $600; Trash $1,200; (New Taxes listed separately)
- HOA & community: Urban community setting; Rent control
Exterior
- Parking: Assigned parking; Total of 14 parking spaces; 1 covered garage space; 2 carport spaces; 11 uncovered spaces
- Utilities: Public sewer; District/public water; One separate water meter; Four separate gas meters; Five separate electric meters
- Home design: Low-rise multifamily property; 2 total stories; No accessory dwelling unit
- Construction: Year built source: Assessor
- Exterior features: No pool; Corner lot; Front yard
Interior
- Kitchen: Kitchens present in each unit
- Bedrooms: Unit mix includes 1-bed, 2-bed, and 3-bed units
- Bathrooms: Combination of full bathrooms across units (1 or 2 baths per unit)
- Interior features: Two-level building; Entry on level 1
- Laundry & utility: Laundry inside; Washer hookup available; Gas dryer hookup available
Neighborhood map
What this means for you Summary
Snapshot
- This is a 2-bed/1.0-bath multifamily listed at $1.30M.
Deal economics
- At list price, monthly cash flow is $-123 ($-1k/yr) — negative.
- To cash-flow at today's rent, offer at most $1.28M (1.7% below list).
- To meet the 1% rule (rent ≥ 1% of price), the offer needs to be $1.06M (18.2% below list).
- Recommended offer: $1.06M (18.2% below list) — sets the bar for 1% rule.
- Cap rate 6.2% vs local median 3.7% in East Los Angeles — top-decile yield for the area; either an underpriced asset or a hidden risk that comps aren't pricing in. Stress-test before assuming the spread holds.
Location & tenants
- Location reads 60/100 on livability (#594 in CA) — a middle-class / working-renter tenant base. Strengths: commute A+, schools B+; Watch: employment C-, health & safety D, crime F.
- Los Angeles Unified (urban): math 29% / reading 54% proficiency, ranked #223 of 517 in CA (top 43%) — families likely to look elsewhere, expect single-tenant / working-renter base with shorter leases; 67% free/reduced lunch — lower-income household profile, screen leases tightly.
- Market conditions: Rents flat; 57 active listings in the ZIP; 23 comparable units currently listed for rent nearby; rentals at typical pace (median 25d on market — plan ~3-4 weeks tenant-placement turnaround); 43% of comp listings sitting > 30 days — soft ceiling on asking rent; 19,697 units permitted in Los Angeles County in 2024 (9,426 in 5+ unit buildings).
- At $10,629/mo this rent would consume 216% of the median local household income ($59k/yr) (locally 2670% of renters already pay >50% of income on rent) — very limited rent-growth headroom before tenants either downsize or default.
Forward outlook
- Local home prices are declining (-3.0%/yr); year-one equity from $9k of loan paydown is wiped out by about $39k of value loss. Plan a longer hold.
- Los Angeles County population projected at +9% by 2050 — modest demand growth; plan on rents tracking national, not racing it.
Negotiation context
- It's been on market 17 days — a 2% lower offer ($1.28M) is reasonable based on typical stale-listing flexibility.
- 5 sale attempts since 9y ago with the ask held roughly flat each time — persistent listings suggest the price (not the market) is what's stuck; bring a comps-based counter.
- Current owner paid $830k; list at $1.30M implies a 57% gain — meaningful room to come down on a strong offer.
Risks & watch-outs
- Watch-outs: built in 1955 — expect roof / HVAC / electrical / plumbing capex.
- Climate carrying-cost: extreme-heat days projected 7→21/yr by 2055 (HVAC capex compounding) — expect insurance premiums to compound above CPI over the hold.
Questions for the listing agent
- What do current leases actually rent for vs. the listed asking? Can we see a recent rent roll and the last 12 months of T-12 income?
- Built in 1955 — when were the roof, HVAC, electrical panel, plumbing, and water heater last replaced?
- Is there a deadline driving the sale (1031 exchange, divorce, estate, relocation)? That informs how much negotiation room exists.
- Schools are B-rated — typically a magnet for longer-tenancy family renters. What's the average tenant stay here, and is there a school-zone premium baked into asking?
- Crime grade is F in this area — have there been break-ins, vandalism, or insurance claims at this property in the last 3 years? What carrier currently insures it and at what premium?
- The area grade is low — what's the realistic commute time and amenity access for the typical tenant pool here? Any planned neighborhood developments (good or bad) we should know about?
- What's the average days-on-market for RENTAL listings here right now (not sales)? A rising rental-DOM trend means longer vacancies and softer asking-rent achievability than the comps imply.
- What's the recent tenant-quality profile in this submarket — average credit score on applications, eviction rate, late-payment / NSF rate, and stable-employment percentage? A property-management company in the area should have these aggregated.
- How much new apartment / multifamily construction is in the pipeline within 1–3 miles? Heavy new supply (>2% of stock underway) typically softens rents 12–24 months out; light construction supports rent growth.
Investment metrics
- 1% rule
- 0.82% ✗
- Cap rate
- 6.18%
- Cash-on-cash
- -0.41%
- DSCR
- 0.98
- GRM
- 10.2
CMA / ARV
No comps found within radius.
Projected returns pro-forma
-3.0% appreciation · 0.21% rent growth · sell at horizon
- IRR
- -20.0%
- Equity multiple
- 0.32×
- Total profit
- $-247,639
- Equity at exit
- $193,834
- IRR
- -20.0%
- Equity multiple
- 0.07×
- Total profit
- $-338,881
- Equity at exit
- $112,400
Cash invested: $364,000 (down + closing). Projections, not guarantees.
Landlord ↔ Tenant lean methodology
- Overall (STATE)
- 18 Strongly Tenant-Friendly
- State California
- 18 Strongly Tenant-Friendly · D+13
- County
- — inherits STATE
- City
- — inherits STATE
ZIP-level market 90023
- Rents YoY
- 0.2%
- Active inventory
- 57
- Price-to-rent
- 36.2×
Monthly cashflow live
- Estimated rent
- $10,629 high interval (Pro) →
- Mortgage (P&I)
- −$6,817
- Tax from tax record
- −$1,161 /mo · $13,930/yr
- Insurance
- −$542
- HOA
- −$0
- Vacancy / Maint / Mgmt
- −$2,232
- Net cashflow
- $-123
Break-even live
4-unit breakdown (identical units grouped — click to expand)
| Units | Beds | Baths | Est. rent |
|---|---|---|---|
| 1× unit | 3 | 2 | $2,993 |
| 3× units | 2 | 1 | $7,638 |
| #2 | 2 | 1 | $2,546 |
| #3 | 2 | 1 | $2,546 |
| #4 | 2 | 1 | $2,546 |
| Total (4 units) | $10,629 | ||
UW: 25.0% down · 7.5% · 30yr · 1.5% tax · 5.0% vac · 8.0% maint · 8.0% mgmt
Financing live
Cash to close
- Down payment
- $325,000
- Closing costs
- $39,000
- Reserves months
- —
- Total cash needed
- —
Loan-product check · same deal, 3 products live
Conventional
25% down · 7.5% · 30yr
- Down + closing
- —
- Monthly P&I
- —
- Monthly cashflow
- —
- DSCR
- —
- Eligible?
- —
Personal DTI + credit; lowest rate.
DSCR
20% down · 8.5% · 30yr
- Down + closing
- —
- Monthly P&I
- —
- Monthly cashflow
- —
- DSCR
- —
- Eligible?
- —
No personal income docs; deal must DSCR.
Hard money
10% down · 12.0% · 12mo
- Down + closing
- —
- Monthly P&I
- —
- Monthly cashflow
- —
- DSCR
- —
- Eligible?
- —
Short-term bridge; refi at stabilization.
Rent comps 23 comps
| Address | Beds | Baths | Sqft | Rent | $/sqft | DOM | Units | Dist |
|---|---|---|---|---|---|---|---|---|
| 1157 S Townsend Ave Los Angeles, CA | 3.0 | 1.0 | 700 | $2,775 | $3.96 | 24d | 1 | 0.12mi |
| 1140 S Record Ave Los Angeles, CA | 2.0 | 1.0 | 800 | $2,700 | $3.38 | 43d | 1 | 0.34mi |
| 1129 La Puerta St Los Angeles, CA | 3.0 | 1.0 | 844 | $3,600 | $4.27 | 43d | 1 | 0.34mi |
| 1050 1/2 S Bonnie Beach Pl Los Angeles, CA | 2.0 | 1.5 | 985 | $2,562 | $2.60 | 24d | 1 | 0.41mi |
| 3824 Princeton St Los Angeles, CA | 2.0 | 1.0 | 980 | $2,380 | $2.43 | 14d | 1 | 0.43mi |
| 924 S Sunol Dr Unit 1/2 Los Angeles, CA | 3.0 | 2.0 | 1040 | $3,000 | $2.88 | 24d | 1 | 0.55mi |
| 3420 Percy St Unit 3 Los Angeles, CA | 1.0 | 1.0 | 600 | $1,750 | $2.92 | 43d | 1 | 0.84mi |
| 3466 E 8th St Los Angeles, CA | 3.0 | 1.0 | 1104 | $3,150 | $2.85 | 7d | 1 | 0.86mi |
| 969 S Lorena St Unit 1/2 Commerce, CA | 2.0 | 2.5 | 1100 | $2,600 | $2.36 | 7d | 1 | 0.90mi |
| 969 S Lorena St Unit 1/2 Commerce, CA | 2.0 | 2.5 | 1100 | $2,600 | $2.36 | 5d | 1 | 0.90mi |
| 926 S Ford Blvd Los Angeles, CA | 3.0 | 2.0 | 1000 | $3,200 | $3.20 | 43d | 1 | 0.98mi |
| 150 1/2 S Bonnie Beach Pl Los Angeles, CA | 1.0 | 1.0 | 700 | $1,800 | $2.57 | 24d | 1 | 1.04mi |
| 132 N Ditman Ave Los Angeles, CA | 3.0 | 2.0 | 1000 | $2,875 | $2.88 | 24d | 1 | 1.10mi |
| 1025 S Kern Ave Los Angeles, CA | 1.0 | 1.0 | 600 | $1,630 | $2.72 | 43d | 1 | 1.22mi |
| 3059 E 5th St Los Angeles, CA | 1.0 | 1.0 | 530 | $1,800 | $3.40 | 43d | 1 | 1.26mi |
| 2312 Connor Ave Commerce, CA | 3.0 | 2.0 | 1125 | $3,200 | $2.84 | 17d | 1 | 1.30mi |
| 2312 Connor Ave Commerce, CA | 3.0 | 2.0 | 1125 | $3,200 | $2.84 | 1d | 1 | 1.30mi |
| 364 S McBride Ave Los Angeles, CA | 2.0 | 1.0 | 750 | $3,250 | $4.33 | 43d | 1 | 1.37mi |
| 4091 San Carlos St Unit 4089 Los Angeles, CA | 2.0 | 1.0 | 1100 | $2,795 | $2.54 | 7d | 1 | 1.39mi |
| 4045 San Carlos St Los Angeles, CA | 2.0 | 1.0 | 700 | $2,550 | $3.64 | 7d | 1 | 1.40mi |
| 2853 E 6th St Unit 2 Los Angeles, CA | 2.0 | 1.0 | 1000 | $2,800 | $2.80 | 43d | 1 | 1.41mi |
| 2853 E 6th St Los Angeles, CA | 2.0 | 1.0 | 552 | $2,000 | $3.62 | 44d | 1 | 1.41mi |
| 2855 1/2 E 6th St Los Angeles, CA | 3.0 | 1.0 | 1000 | $3,500 | $3.50 | 43d | 1 | 1.41mi |
Listing history 13 events
-
2026-06-18days on market $1,299,999 Active 17 DOM
-
2026-06-17days on market $1,299,999 Active 16 DOM
-
2026-06-16days on market $1,299,999 Active 15 DOM
-
2026-06-15days on market $1,299,999 Active 14 DOM
-
2026-06-13days on market $1,299,999 Active 12 DOM
-
2026-06-09days on market $1,299,999 Active 8 DOM
-
2026-06-08days on market $1,299,999 Active 7 DOM
-
2026-06-08price $1,299,999 Active 6 DOM
-
2026-06-07days on market $1,295,900 Active 6 DOM
-
2026-06-04days on market $1,295,900 Active 3 DOM
-
2026-06-03days on market $1,295,900 Active 2 DOM
-
2026-06-02remarks 699-char remark
-
2026-06-02$1,295,900 Active 1 DOM
ⓘ Source: listings_history table (triggers on properties + properties_extension) + one-shot
backfill from property_details.listing_events for pre-trigger history.
Tax reassessment forecast CA · Resets to sale price
- Current annual tax
- $13,930 · $1,161/mo
- Projected year-2 tax
- $13,930 · $1,161/mo
- Expected delta
- $0/yr ($0/mo · 0.0%)
ⓘ Screening estimate from a state-policy table — verify with the county assessor before closing.
Climate risk First Street
- Flood 3/10 Moderate FEMA zone X (unshaded) · 10% chance over 30 yrs
- Wildfire 1/10 Low
- Heat 6/10 Major 7 d/yr ≥92°F today · 21 d/yr by 30 yrs out
- Wind 1/10 Low
- Air quality 5/10 Major 9 unhealthy d/yr today · 9 by 30 yrs out
Nearby sold comps map
Loading sold comps map…
Walkable amenities ~0.75 mi
Loading nearby amenities…
Taxation est. · year 1
- Rental income
- $127,548
- − Mortgage interest
- −$72,820
- − Property taxes
- −$13,930
- − Insurance
- −$6,500
- − Repairs & maintenance
- −$10,204
- − Management
- −$10,204
- − Depreciation
- −$37,818
- Taxable loss
- −$23,928
- Est. tax savings @ 24.0%
- +$5,743
- After-tax cash flow
- $4,268/yr
For passive investors: Depreciation is non-cash, so a rental often shows a tax loss while cash-flowing — sheltering income. Rental losses are passive: they offset passive income freely, and up to $25,000/yr can offset ordinary (W-2) income if you actively participate and your MAGI is under $100k (phasing out to $0 by $150k); unused losses carry forward. On sale, claimed depreciation is recaptured at up to 25%, and gains may owe capital-gains tax (a 1031 exchange can defer both). Figures are a year-1 estimate at your 24.0% rate — not tax advice; consult a CPA.
Schools (NCES district)
- District
- Los Angeles Unified
- NCES district ID
- 0622710
- Math proficiency
- 29% ▼ -4.00%
- Reading proficiency
- 54% ▲ 10.00%
- Median HH income
- $50,403
- Composite
- 35.67/100
- National rank
- #4875
- State rank
- #223 of 517 in CA
Livability — East Los Angeles
- Score
- 60/100
- State rank
- #594
- US rank
- #19237
Category grades
Schools grade is shown separately in the Schools card above.
Census & demographics
- Census place
- East Los Angeles, CA
- County
- Los Angeles County · 9,444,647 people
- City population
- 108,740
- Metro
- Los Angeles-Long Beach-Anaheim, CA
- Population (ZIP)
- 43,857
- Household income
- $59,057
- Rent vs Own
- Severe rent burden
- 2670.0
Population outlook (Los Angeles County) Hauer SSP2
- Today (2025)
- 10,940,515 people
- By 2030
- 11,256,481 · +2.9%
- By 2040
- 11,729,929 · +7.2%
- By 2050
- 11,948,407 · +9.2%
- By 2075
- 11,818,114 · +8.0%
- By 2100
- 10,842,928 · -0.9%
Race, ethnicity, and origin ACS 2023
- Neighborhood character
- Predominantly Hispanic (96%)
- Race & ethnicity
- Hispanic / Latino 96% Two or more races 17% Native American 2% White 2%
- Hispanic origin (detail)
- Mexican 80%
- Common ancestry
- Italian 1%
- Foreign-born
- 41% · Canada, Jamaica
- Languages at home
- 16% English-only · Spanish 83%
Political lean MEDSL · Los Angeles
- 2024 margin
- Solid D (+32.9) · D 64.8% · R 31.9% · Other 3.3%
- 2008→2024 swing
- -7.4pp toward R · 2008: 40.4pp · 2024: 32.9pp
- All cycles
- 2024: D+32.9 2020: D+44.2 2016: D+48.0 2012: D+40.0 2008: D+40.4
Not yet ingested
- Civics
- —
Market trends
- HPI YoY
- ▼ -702.74%
- Current HPI
- 430.9762
- Rent YoY
- ▲ 0.21%
- Metro
- Los Angeles-Long Beach-Anaheim, CA
- State GDP YoY
- ▲ 3.21%
- F500 in state
- 116
Industry mix (Fortune 500 HQ in CA)
| Industry | F500 HQs | Revenue |
|---|---|---|
| Technology | 27 | $1,492B |
|
||
| Financial Services | 3 | $174B |
|
||
| Retail | 3 | $44B |
|
||
| Insurance | 3 | $26B |
|
||
| Media / Entertainment | 2 | $115B |
|
||
| Pharmaceuticals / Biotech | 2 | $62B |
|
||
Price history
+52.5% since first listed14 events — show timeline
- 2026-06-01 Listed $1,295,900 CRMLS
- 2025-12-07 Relisted — CRMLS
- 2025-12-07 Listing Removed — CRMLS
- 2025-09-19 Price Changed $1,549,900 CRMLS
- 2025-08-25 Price Changed $1,599,800 CRMLS
- 2025-07-03 Price Changed $1,599,900 CRMLS
- 2025-06-25 Listed $1,650,000 CRMLS
- 2017-10-24 Sold (Public Records) $830,000 Public Records
- 2017-10-20 Sold (MLS) $830,000 SDMLS
- 2017-10-20 Sold (MLS) $830,000 CRMLS
- 2017-08-02 Pending — CRMLS
- 2017-07-13 Price Changed $849,900 CRMLS
- 2017-06-08 Listed $899,900 CRMLS
- 2017-06-04 Listed $849,900 SDMLS
Property tax history
+9.8%/yrLatest (2025): $13,930 · +3.3% YoY. Source: county tax records.
Cash-flow waterfall
monthlySold comps — $/sqft
last 12 mo · ≤1 miLoading sold comps…