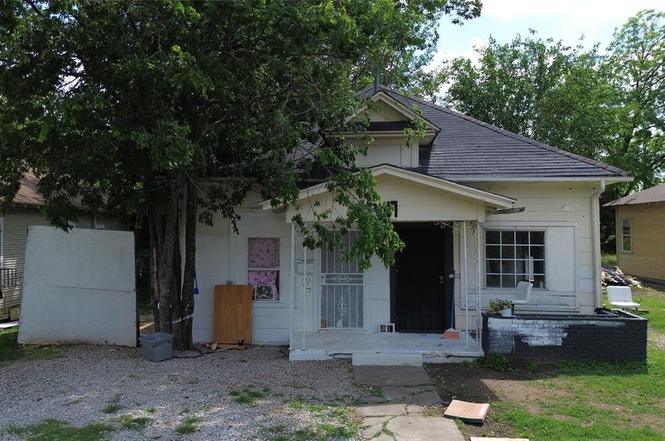
3417 Pondrom St · Dallas, TX
Flood risk 8/10 · Major
- FEMA flood zone
- X (unshaded)
- Chance of flooding over 30 yrs
- 0.99%
- Est. flood insurance / yr
- $507 – $1,088
Fire risk 1/10 · Minimal
- Est. fire insurance / yr
- $1,222 – $2,270
Heat risk 7/10 · Major
- Hot days now (above 109°F)
- 7 days/yr
- Hot days in 30 yrs
- 24 days/yr
Wind risk 6/10 · Moderate
- Chance of severe wind over 30 yrs
- 27.0%
Air-quality risk 3/10 · Minor
- Unhealthy air days now
- 2 days/yr
- Unhealthy air days in 30 yrs
- 3 days/yr
Risk factors via First Street. Map © Google.
Why this score? — see what drove the A- grade
The composite is a weighted blend of 9 inputs, each scored 0–100. Each bar is that input's sub-score; the figure is the points it added to the 100-point composite (weight × sub-score).
- Cash flow +30.0/30.0
- ARV discount +15.0/15.0
- 1% rule +10.0/10.0
- DSCR +10.0/10.0
- Appreciation +5.4/10.0
- Rent growth +4.3/5.0
- Livability +4.0/5.0
- Schools +2.8/10.0
- Condition / age +2.5/5.0
$115,000
🖨 Deal sheet (PDF) 📄 Offer letter ✓ Due diligence
Listing remarks
We have received multiple offers and are requesting all buyers submit their highest and best offers by Sunday. Centrally located property perfect for investors or anyone ready to take on their next project in one of Dallas’s rapidly developing areas. Just minutes from Downtown Dallas, Deep Ellum, Fair Park, and with easy access to major highways such as I-30, I-45, and Highway 75, this location offers convenience and future growth. Whether you’re looking to renovate, rebuild, or hold as a rental, this property presents excellent potential in a prime urban location. Showings by appointment only.
Key facts
- Prime urban location
- Centrally located
- 6,229 sq ft lot
Tags
Property features AI
Finance
- Other: Seller's belongings excluded from sale
- Financial info: Listing terms: Cash; Treat as clear loan type; No second mortgage indicated
- HOA & community: No homeowners association
Exterior
- Parking: Driveway (no garage or covered/carport spaces listed)
- Utilities: City water; City sewer; Not in a municipal utility district
- Home design: Single-family residence; Residential property; Built in 1936; Not attached to another property; Subdivision: Warren Rev
- Construction: Siding exterior; Preowned (built 1936)
- Exterior features: Lot under 0.5 acre (approximately 0.143 acres); Public records used for lot size
Interior
- Kitchen: No appliances listed
- Bedrooms: 4 bedrooms (all on the first floor)
- Flooring: Vinyl and other flooring types
- Bathrooms: 4 full bathrooms
- Heating & cooling: Wall/window cooling units; Other type of heating
- Interior features: Cable TV available; One living area; One dining area; Total of 7 rooms; One level
- Laundry & utility: Dedicated laundry room (first floor)
Neighborhood map
What this means for you Summary
Snapshot
- This is a 3-bed/2.0-bath single-family listed at $115k.
Deal economics
- At list price, monthly cash flow is $445 ($5k/yr) — positive.
- The deal already cash-flows at list — no discount required.
- Meets the 1% rule at list price ($2k rent vs $115k).
- Recommended offer: $101k (12.0% below list) — sets the bar for market timing.
Location & tenants
- Location reads 81/100 on livability (#24 in TX, #1,380 nationally) — a professional / high-income tenant draw. Strengths: amenities A+, commute A+, housing A+; Watch: crime F.
- Dallas ISD (urban): math 31% / reading 36% proficiency, ranked #559 of 826 in TX (top 68%) — families likely to look elsewhere, expect single-tenant / working-renter base with shorter leases; 83% free/reduced lunch — lower-income household profile, screen leases tightly.
- Zoned schools: Solar Preparatory School For Girls At Bonham (math 59% / reading 65%, grade B, #321 of 4,322 statewide, top 8%, 743 students, 49% FRL) — zoned schools average 49% FRL vs 83% district-wide (34 pts lower); this property's tenant base skews higher-income than the district average.
- Zoned-school proficiency averages 62% at this address vs 34% district-wide (+28 pts) — the actual schools serving this property are materially stronger than the Dallas ISD average implies; a family-tenant draw the district grade alone would hide.
- Market conditions: Rents rising fast (+7.2%/yr); 247 active listings in the ZIP; 40 comparable units currently listed for rent nearby; rentals at typical pace (median 22d on market — plan ~3-4 weeks tenant-placement turnaround); 12,577 units permitted in Dallas County in 2024 (6,829 in 5+ unit buildings).
Forward outlook
- In year one you build about $2k of equity ($795 loan paydown + $908 appreciation (0.8% local appreciation)).
- Dallas County population projected at +35% by 2050 — long-run rental-demand tailwind backs the buy-and-hold thesis.
- At projected returns (0.8% appreciation + 7.2% rent growth), your $32k cash investment doubles in ~4 years — after that, you're playing with house money.
Negotiation context
- It's been on market 199 days — a 12% lower offer ($101k) is reasonable based on typical stale-listing flexibility.
- 4 sale attempts since 23y ago; this cycle's ask has dropped $15k (12%) from the opening price — seller is motivated, your offer sets the floor, not the list.
- Current owner paid $33k; list at $115k implies a 249% gain — meaningful room to come down on a strong offer.
Risks & watch-outs
- Watch-outs: property tax is 2.6% of price; flood insurance adds $66/mo; built in 1936 — expect roof / HVAC / electrical / plumbing capex.
- Climate carrying-cost: severe flood risk; major wind risk, 27% chance of damaging wind over 30y; extreme-heat days projected 7→24/yr by 2055 (HVAC capex compounding) — expect insurance premiums to compound above CPI over the hold.
Questions for the listing agent
- It's been on market 199 days. Have you received any prior offers? Is the seller open to a 12% concession, seller financing, or rate buy-down credit?
- Built in 1936 — when were the roof, HVAC, electrical panel, plumbing, and water heater last replaced?
- Property tax is high relative to price — has the assessment been appealed recently, and will the sale trigger a re-assessment?
- What's the actual annual flood-insurance premium (NFIP or private), and is the property in a SFHA with mandatory coverage?
- Why hasn't it sold? Are there any deal-killer items the seller is aware of (foundation, flood, title, zoning, code violations)?
- Is there a deadline driving the sale (1031 exchange, divorce, estate, relocation)? That informs how much negotiation room exists.
- Crime grade is F in this area — have there been break-ins, vandalism, or insurance claims at this property in the last 3 years? What carrier currently insures it and at what premium?
- What's the average days-on-market for RENTAL listings here right now (not sales)? A rising rental-DOM trend means longer vacancies and softer asking-rent achievability than the comps imply.
- What's the recent tenant-quality profile in this submarket — average credit score on applications, eviction rate, late-payment / NSF rate, and stable-employment percentage? A property-management company in the area should have these aggregated.
- How much new for-sale + rental construction is in the pipeline within 1–3 miles? Heavy new supply typically softens prices + rents 12–24 months out; constrained supply supports both.
Investment metrics
- 1% rule
- 1.56% ✓
- Cap rate
- 11.63%
- Cash-on-cash
- 19.05%
- DSCR
- 1.85
- GRM
- 5.3
CMA / ARV
- ARV (on-the-fly)
- $192,096
- Comps found
- 12
Show comp detail 12 sales within ~0.75 mi
| Address | Dist | Beds/Ba | Sqft | Sold | Price | $/sf | Match |
|---|---|---|---|---|---|---|---|
| 3424 Kimble St | 0.08mi | 3/1.0 | 1,178 (+7%) | 2mo | $150,000 | $127 | 80 |
| 2403 Romine Ave | 0.31mi | 3/2.0 | 1,170 (+6%) | 2mo | $210,000 | $179 | 74 |
| 2912 Warren Ave | 0.50mi | 2/1.5 (-1) | 1,122 (+2%) | 0mo | $125,000 | $111 | 66 |
| 3515 Meadow St | 0.65mi | 3/2.0 | 1,120 (+1%) | 1mo | $240,000 | $214 | 66 |
| 3626 Meyers St | 0.60mi | 3/2.0 | 1,144 (+4%) | 1mo | $167,000 | $146 | 66 |
| 2332 Poplar St | 0.58mi | 3/2.0 | 1,036 (-6%) | 2mo | $249,900 | $241 | 62 |
| 3712 Ruskin St | 0.34mi | 4/2.0 (+1) | 1,210 (+10%) | 4mo | $210,000 | $174 | 60 |
| 2321 Greer St | 0.69mi | 4/1.5 (+1) | 1,120 (+1%) | 5mo | $119,000 | $106 | 54 |
| 3111 Mcdermott Ave | 0.74mi | 3/2.0 | 1,043 (-6%) | 4mo | $226,000 | $217 | 53 |
| 3925 Malcolm X Blvd | 0.59mi | 3/2.0 | 1,248 (+13%) | 0mo | $199,000 | $159 | 50 |
| 3719 Meadow St | 0.69mi | 3/2.0 | 1,222 (+11%) | 2mo | $225,000 | $184 | 48 |
| 2232 Poplar St | 0.60mi | 3/1.0 | 1,231 (+12%) | 5mo | $90,000 | $73 | 45 |
Match score weights: distance 35% · size 25% · config 20% · recency 20%. Top-matched comps best support the ARV.
Projected returns pro-forma
0.79% appreciation · 7.19% rent growth · sell at horizon
- IRR
- 22.0%
- Equity multiple
- 2.16×
- Total profit
- $37,310
- Equity at exit
- $38,003
- IRR
- 28.1%
- Equity multiple
- 4.88×
- Total profit
- $124,904
- Equity at exit
- $49,544
Cash invested: $32,200 (down + closing). Projections, not guarantees.
Landlord ↔ Tenant lean methodology
- Overall (STATE)
- 87 Strongly Landlord-Friendly
- State Texas
- 87 Strongly Landlord-Friendly · R+5
- County
- — inherits STATE
- City
- — inherits STATE
ZIP-level market 75215
- Home prices YoY
- 0.3%
- Rents YoY
- 7.2%
- Active inventory
- 247
- Price-to-rent
- 5.3×
Monthly cashflow live
- Estimated rent
- $1,792 high interval (Pro) →
- Mortgage (P&I)
- −$603
- Tax from tax record
- −$253 /mo · $3,042/yr
- Insurance
- −$48
- Flood insurance flood zone
- −$66 /mo · $798/yr
- HOA
- −$0
- Vacancy / Maint / Mgmt
- −$376
- Net cashflow
- $445
Break-even live
Sensitivity live
| Price | -10% $510 | -5% $477 | +0% $445 | +5% $412 | +10% $380 |
|---|---|---|---|---|---|
| Rent | -10% $303 | -5% $374 | +0% $445 | +5% $516 | +10% $586 |
| Rate | -1.0pp $503 | -0.5pp $474 | base $445 | +0.5pp $415 | +1.0pp $385 |
UW: 25.0% down · 7.5% · 30yr · 1.5% tax · 5.0% vac · 8.0% maint · 8.0% mgmt
Financing live
Cash to close
- Down payment
- $28,750
- Closing costs
- $3,450
- Reserves months
- —
- Total cash needed
- —
Loan-product check · same deal, 3 products live
Conventional
25% down · 7.5% · 30yr
- Down + closing
- —
- Monthly P&I
- —
- Monthly cashflow
- —
- DSCR
- —
- Eligible?
- —
Personal DTI + credit; lowest rate.
DSCR
20% down · 8.5% · 30yr
- Down + closing
- —
- Monthly P&I
- —
- Monthly cashflow
- —
- DSCR
- —
- Eligible?
- —
No personal income docs; deal must DSCR.
Hard money
10% down · 12.0% · 12mo
- Down + closing
- —
- Monthly P&I
- —
- Monthly cashflow
- —
- DSCR
- —
- Eligible?
- —
Short-term bridge; refi at stabilization.
Rent comps 40 comps
| Address | Beds | Baths | Sqft | Rent | $/sqft | DOM | Units | Dist |
|---|---|---|---|---|---|---|---|---|
| 3501 Latimer St Dallas, TX | 2.0 | 1.0 | 1008 | $1,095 | $1.09 | 3d | 1 | 0.07mi |
| 2545 Metropolitan Ave Dallas, TX | 3.0 | 1.0 | 936 | $1,750 | $1.87 | 0d | 1 | 0.28mi |
| 3711 Guaranty St Dallas, TX | 3.0 | 1.0 | 984 | $1,800 | $1.83 | 15d | 1 | 0.34mi |
| 2847 Metropolitan Ave Dallas, TX | 3.0 | 1.0 | 1344 | $2,050 | $1.53 | 23d | 1 | 0.51mi |
| 2822 McDermott Ave Dallas, TX | 3.0 | 2.0 | 1200 | $1,795 | $1.50 | 25d | 1 | 0.52mi |
| 3609 Cleveland St Dallas, TX | 4.0 | 2.5 | 1500 | $2,700 | $1.80 | 8d | 1 | 0.56mi |
| 4024 Myrtle St Dallas, TX | 3.0 | 2.0 | 1106 | $1,595 | $1.44 | 5d | 1 | 0.64mi |
| 1630 Poplar St Dallas, TX | 2.0 | 1.0 | 903 | $1,400 | $1.55 | 25d | 1 | 0.66mi |
| 1628 Poplar St Dallas, TX | 2.0 | 1.0 | 903 | $1,400 | $1.55 | 44d | 1 | 0.67mi |
| 3907 Roberts Ave Dallas, TX | 3.0 | 1.0 | 908 | $1,395 | $1.54 | 15d | 1 | 0.81mi |
| 3915 Coolidge St Dallas, TX | 4.0 | 2.0 | 1416 | $2,100 | $1.48 | 44d | 1 | 0.86mi |
| 3308 Birmingham Ave Unit 1 Dallas, TX | 2.0 | 2.5 | 1451 | $2,275 | $1.57 | 25d | 1 | 0.87mi |
| 3308 Birmingham Ave Unit 6 Dallas, TX | 2.0 | 2.5 | 1341 | $2,175 | $1.62 | 17d | 1 | 0.87mi |
| 3308 Birmingham Ave Unit 03 Dallas, TX | 2.0 | 2.5 | 1451 | $2,275 | $1.57 | 44d | 1 | 0.87mi |
| 3308 Birmingham Ave Unit 7 Dallas, TX | 2.0 | 2.5 | 1287 | $2,125 | $1.65 | 15d | 1 | 0.87mi |
| 2513 Southland St Dallas, TX | 2.0 | 1.0 | 1010 | $1,399 | $1.39 | 21d | 1 | 0.87mi |
| 2513 Southland St Dallas, TX | 2.0 | 1.0 | 1010 | $1,299 | $1.29 | 3d | 1 | 0.87mi |
| 2561 Elsie Faye Heggins St Dallas, TX | 3.0 | 2.0 | 876 | $1,390 | $1.59 | 7d | 1 | 0.93mi |
| 2563 Elsie Faye Heggins St Dallas, TX | 3.0 | 2.0 | 876 | $1,240 | $1.42 | 16d | 1 | 0.93mi |
| 2603 Elsie Faye Heggins St Dallas, TX | 3.0 | 2.0 | 876 | $1,385 | $1.58 | 44d | 1 | 0.93mi |
| 2627 Elsie Faye Heggins St Dallas, TX | 3.0 | 2.0 | 876 | $1,280 | $1.46 | 44d | 1 | 0.93mi |
| 2615 Elsie Faye Heggins St Dallas, TX | 3.0 | 2.0 | 876 | $1,280 | $1.46 | 16d | 1 | 0.93mi |
| 2080 Kelly Ave Unit 109 Dallas, TX | 2.0 | 2.5 | 1164 | $2,595 | $2.23 | 44d | 1 | 0.94mi |
| 2408 Meyers St Unit 204 Dallas, TX | 2.0 | 1.0 | 700 | $770 | $1.10 | 14d | 1 | 1.03mi |
| 2020 S Ervay St Dallas, TX | 2.0 | 1.0–2.0 | 821 | $2,325 | $2.83 | 0d | 56 | 1.05mi |
| 2016 S Ervay St Unit B1 Dallas, TX | 2.0 | 2.0 | 1102 | $2,225 | $2.02 | 44d | 1 | 1.05mi |
| 3230 Elihu St #2 Dallas, TX | 2.0 | 3.5 | 1400 | $2,300 | $1.64 | 44d | 1 | 1.06mi |
| 3230 Elihu St #5 Dallas, TX | 2.0 | 3.5 | 1400 | $2,700 | $1.93 | 44d | 1 | 1.06mi |
| 3408 Spring Ave Dallas, TX | 3.0 | 2.0 | 780 | $1,314 | $1.68 | 0d | 1 | 1.06mi |
| 1812 Hickory St Dallas, TX | 1.0–2.0 | 1.0–2.0 | 825 | $2,261 | $2.74 | 44d | 19 | 1.12mi |
| 1900 S Ervay St Dallas, TX | 2.0 | 3.0 | 1302 | $3,700 | $2.84 | 44d | 1 | 1.13mi |
| 4503 Bradshaw St Dallas, TX | 4.0 | 2.0 | 1263 | $1,600 | $1.27 | 8d | 1 | 1.14mi |
| 1100 Corinth St Dallas, TX | 2.0–3.0 | 2.5–3.5 | 1572 | $3,595 | $2.29 | 44d | 10 | 1.17mi |
| 4611 Bradshaw St Dallas, TX | 3.0 | 2.0 | 1145 | $1,550 | $1.35 | 25d | 1 | 1.19mi |
| 2714 Hector St Dallas, TX | 3.0 | 2.0 | 1233 | $2,100 | $1.70 | 25d | 1 | 1.20mi |
| 2711 Cross St Dallas, TX | 2.0 | 1.0 | 700 | $1,249 | $1.78 | 0d | 1 | 1.21mi |
| 5000 Linder Ave Dallas, TX | 3.0 | 2.0 | 1327 | $1,950 | $1.47 | 44d | 1 | 1.22mi |
| 3639 Pine St Dallas, TX | 3.0 | 2.0 | 1090 | $1,490 | $1.37 | 14d | 1 | 1.24mi |
| 4722 Meadow St Dallas, TX | 2.0–3.0 | 2.0 | 1107 | $1,475 | $1.33 | 12d | 4 | 1.24mi |
| 1919 S Akard St Dallas, TX | 1.0–2.0 | 1.0–2.0 | 965 | $2,054 | $2.13 | 0d | 8 | 1.24mi |
Listing history 29 events
-
2026-06-18status $115,000 Pending 199 DOM
-
2026-06-18days on market $115,000 Active 199 DOM
-
2026-06-17days on market $115,000 Active 198 DOM
-
2026-06-16days on market $115,000 Active 197 DOM
-
2026-06-15days on market $115,000 Active 196 DOM
-
2026-06-13pricedays on market $115,000 Active 194 DOM
-
2026-06-09days on market $125,000 Active 190 DOM
-
2026-06-08days on market $125,000 Active 189 DOM
-
2026-06-07remarks 601-char remark
-
2026-06-07days on market $125,000 Active 188 DOM
-
2026-06-04days on market $125,000 Active 185 DOM
-
2026-06-03days on market $125,000 Active 184 DOM
-
2026-06-02days on market $125,000 Active 183 DOM
-
2026-06-02days on market $125,000 Active 182 DOM
-
2026-05-31days on market $125,000 Active 181 DOM
-
2026-05-18price $125,000
-
2026-05-17status Active
-
2026-03-31historical Active Option Contract
-
2026-03-31status Active
-
2025-10-25$130,000 Active
-
2018-05-03soldstatus
-
2004-07-28soldstatus
-
2004-03-11historical
-
2003-09-16$29,900
-
2001-08-10soldstatus
-
2001-08-10soldstatus
-
2001-03-19soldstatus
-
1997-06-16soldstatus $32,917
-
1997-06-16soldstatus $32,917
ⓘ Source: listings_history table (triggers on properties + properties_extension) + one-shot
backfill from property_details.listing_events for pre-trigger history.
Tax reassessment forecast TX · Resets to sale price
- Current annual tax
- $3,042 · $253/mo
- Projected year-2 tax
- $3,042 · $253/mo
- Expected delta
- $0/yr ($0/mo · 0.0%)
ⓘ Screening estimate from a state-policy table — verify with the county assessor before closing.
Climate risk First Street
- Flood 8/10 Severe FEMA zone X (unshaded) · 99% chance over 30 yrs
- Wildfire 1/10 Low
- Heat 7/10 Severe 7 d/yr ≥109°F today · 24 d/yr by 30 yrs out
- Wind 6/10 Major 27% chance of damaging wind over 30 yrs
- Air quality 3/10 Moderate 2 unhealthy d/yr today · 3 by 30 yrs out
Nearby sold comps map
Loading sold comps map…
Walkable amenities ~0.75 mi
Loading nearby amenities…
Taxation est. · year 1
- Rental income
- $21,505
- − Mortgage interest
- −$6,442
- − Property taxes
- −$3,042
- − Insurance
- −$1,372
- − Repairs & maintenance
- −$1,720
- − Management
- −$1,720
- − Depreciation
- −$3,345
- Taxable income
- $3,863
- Est. tax owed @ 24.0%
- −$927
- After-tax cash flow
- $4,411/yr
For passive investors: Depreciation is non-cash, so a rental often shows a tax loss while cash-flowing — sheltering income. Rental losses are passive: they offset passive income freely, and up to $25,000/yr can offset ordinary (W-2) income if you actively participate and your MAGI is under $100k (phasing out to $0 by $150k); unused losses carry forward. On sale, claimed depreciation is recaptured at up to 25%, and gains may owe capital-gains tax (a 1031 exchange can defer both). Figures are a year-1 estimate at your 24.0% rate — not tax advice; consult a CPA.
Schools (NCES district)
- District
- Dallas ISD
- NCES district ID
- 4816230
- Math proficiency
- 31% ▼ -16.00%
- Reading proficiency
- 36% ▼ -4.00%
- Median HH income
- $42,881
- Composite
- 28.41/100
- National rank
- #6763
- State rank
- #559 of 826 in TX
Livability — Dallas
- Score
- 81/100
- State rank
- #24
- US rank
- #1380
Category grades
Schools grade is shown separately in the Schools card above.
Census & demographics
- Census place
- Dallas, TX
- County
- Dallas County · 2,612,404 people
- City population
- 1,168,437
- Metro
- Dallas-Fort Worth-Arlington, TX
- Population (ZIP)
- 18,895
- Household income
- $45,557
- Rent vs Own
- Severe rent burden
- 1464.0
Population outlook (Dallas County) Hauer SSP2
- Today (2025)
- 2,979,839 people
- By 2030
- 3,191,823 · +7.1%
- By 2040
- 3,619,611 · +21.5%
- By 2050
- 4,026,915 · +35.1%
- By 2075
- 4,957,073 · +66.4%
- By 2100
- 5,508,725 · +84.9%
Race, ethnicity, and origin ACS 2023
- Neighborhood character
- Diverse neighborhood (Simpson 0.58)
- Race & ethnicity
- Black 59% Hispanic / Latino 25% White 11% Two or more races 10%
- Hispanic origin (detail)
- Mexican 21%
- Common ancestry
- Italian 1% Hispanic 1%
- Foreign-born
- 16% · Canada
- Languages at home
- 74% English-only · Spanish 26%
Political lean MEDSL · Dallas
- 2024 margin
- Strong D (+22.2) · D 60.2% · R 38.0% · Other 1.8%
- 2008→2024 swing
- +6.9pp toward D · 2008: 15.3pp · 2024: 22.2pp
- All cycles
- 2024: D+22.2 2020: D+31.6 2016: D+26.2 2012: D+15.4 2008: D+15.3
Not yet ingested
- Civics
- —
Market trends
- HPI YoY
- ▲ 0.79%
- Current HPI
- 224.2955
- Rent YoY
- ▲ 7.19%
- Metro
- Dallas-Fort Worth-Arlington, TX
- State GDP YoY
- ▲ 3.95%
- F500 in state
- 110
Industry mix (Fortune 500 HQ in TX)
| Industry | F500 HQs | Revenue |
|---|---|---|
| Energy | 16 | $1,198B |
|
||
| Technology | 5 | $198B |
|
||
| Engineering / Construction | 4 | $72B |
|
||
| Energy Services | 3 | $60B |
|
||
| Utilities | 3 | $41B |
|
||
| Healthcare | 2 | $330B |
|
||
Price history
+279.7% since first listed14 events — show timeline
- 2026-05-18 Price Changed $125,000 NTREIS
- 2026-05-17 Relisted — NTREIS
- 2026-03-31 Contingent — NTREIS
- 2026-03-31 Relisted — NTREIS
- 2025-10-25 Listed $130,000 NTREIS
- 2018-05-03 Sold (Public Records) — Public Records
- 2004-07-28 Sold (Public Records) — Public Records
- 2004-03-11 Listing Removed — NTREIS
- 2003-09-16 Listed $29,900 NTREIS
- 2001-08-10 Sold (Public Records) — Public Records
- 2001-08-10 Sold (Public Records) — Public Records
- 2001-03-19 Sold (Public Records) — Public Records
- 1997-06-16 Sold (Public Records) $32,917 Public Records
- 1997-06-16 Sold (Public Records) $32,917 Public Records
Property tax history
+8.5%/yrLatest (2025): $3,042 · -1.5% YoY. Source: county tax records.
Cash-flow waterfall
monthlySold comps — $/sqft
last 12 mo · ≤1 miLoading sold comps…