 🌊 Lakefront
28750 Trails Edge Blvd #306 · Bonita Springs, FL
Flood risk 6/10 · Moderate
- FEMA flood zone
- X (shaded)
- Chance of flooding over 30 yrs
- 0.52%
- Est. flood insurance / yr
- $507 – $1,088
Fire risk 2/10 · Minimal
- Est. fire insurance / yr
- $947 – $1,759
Heat risk 10/10 · Severe
- Hot days now (above 107°F)
- 7 days/yr
- Hot days in 30 yrs
- 30 days/yr
Wind risk 10/10 · Severe
- Chance of severe wind over 30 yrs
- 99.0%
Air-quality risk 2/10 · Minimal
- Unhealthy air days now
- 1 days/yr
- Unhealthy air days in 30 yrs
- 1 days/yr
Risk factors via First Street. Map © Google.
Why this score? — see what drove the B grade
The composite is a weighted blend of 9 inputs, each scored 0–100. Each bar is that input's sub-score; the figure is the points it added to the 100-point composite (weight × sub-score).
- Cash flow +30.0/30.0
- 1% rule +10.0/10.0
- DSCR +10.0/10.0
- ARV discount +7.5/15.0
- Schools +4.1/10.0
- Livability +3.5/5.0
- Rent growth +3.2/5.0
- Condition / age +2.5/5.0
- Appreciation +0.0/10.0
$369,000
🖨 Deal sheet 📄 Offer letter ✓ Due diligence
Listing remarks
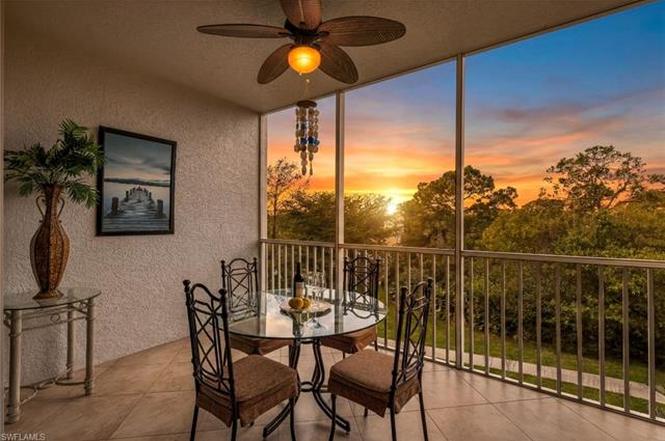
WEST OF US-41 | 3RD FLOOR END UNIT I CAPTIVATING SUNSETS Indulge in elevated coastal living at The Carlysle in the heart of Bonita Springs. This 3-bedroom, 2-bath residence offers comfort and convenience just moments from the Gulf’s pristine shores. Positioned on the 3rd floor as a desirable end unit, the home is filled with natural light and enhanced by soaring ceilings and a thoughtfully designed open-concept floor plan ideal for both entertaining and relaxed everyday living. The home showcases crown molding, high baseboards, recessed lighting, fans and fixtures, and refined coastal finishes throughout enhanced by tile flooring throughout the living area, The kitchen is a relaxed f
Key facts
- Natural light
- Recessed lighting
- Crown molding
Tags
Property features AI
Finance
- Other: Property contains 3 units per floor, 30 units in the building, 60 units in the complex; Single-floor unit
- HOA & community: Mandatory HOA (professional management); Quarterly condo fee; Condo fee $1,707.70 quarterly (total annual recurring fees $6,832); One-time fees $150; HOA maintenance covers internet/WiFi access, irrigation water, lawn/land maintenance, exterior pest control, and reserves; Community amenities include BBQ/picnic area and a community pool; Non-gated community
Exterior
- Parking: 1 assigned parking space; Under-building open parking; Attached garage (1 car)
- Utilities: Central water; Central sewer; Cable available
- Home design: Residential end-unit in a mid-rise building (4–7 stories); Rear exposure facing west; Built in 2007; Located in the Woods Edge development (The Carlysle sub-condo, unit 306)
- Construction: Concrete block construction; Stucco finish
- Exterior features: Tile roof; Double-hung windows; Stucco exterior; Lake waterfront; Landscaped and wooded area views; Paved private road
Interior
- Kitchen: Pantry; Dishwasher; Microwave; Range / Self-cleaning oven; Refrigerator/freezer
- Bedrooms: 3 bedrooms; Split bedroom floor plan
- Flooring: Carpet; Tile
- Bathrooms: 2 full bathrooms; Master bathroom with dual sinks and shower (no tub)
- Heating & cooling: Central electric heat; Central electric cooling; Ceiling fans; Exhaust fan
- Interior features: Built-in cabinets; Cable prewire / cable available; Custom mirrors; Foyer; High-speed internet available; Pantry; Smoke detectors; Common elevator; Screened lanai/porch; Guest bath; Guest room; Laundry in residence
- Laundry & utility: Washer and dryer in unit
Neighborhood map
What this means for you Summary
Snapshot
- This is a 3-bed/2.0-bath condo listed at $369k.
Deal economics
- At list price, monthly cash flow is $2k ($20k/yr) — positive.
- The deal already cash-flows at list — no discount required.
- Meets the 1% rule at list price ($6k rent vs $369k).
- Recommended offer: $336k (9.0% below list) — sets the bar for market timing.
- Cap rate 11.7% vs local median 1.7% in Bonita Springs — top-decile yield for the area; either an underpriced asset or a hidden risk that comps aren't pricing in. Stress-test before assuming the spread holds.
Location & tenants
- Location reads 70/100 on livability (#428 in FL) — a middle-class / working-renter tenant base. Strengths: crime A+, housing A+, employment A; Watch: schools C-, cost of living C-, health & safety D.
- Lee (suburban): math 47% / reading 50% proficiency, ranked #42 of 73 in FL (top 58%) — families likely to look elsewhere, expect single-tenant / working-renter base with shorter leases.
- Market conditions: Rents rising (+2.9%/yr); 699 active listings in the ZIP; 40 comparable units currently listed for rent nearby; rentals at typical pace (median 23d on market — plan ~3-4 weeks tenant-placement turnaround); high-income renter base; 15,411 units permitted in Lee County in 2024 (4,686 in 5+ unit buildings).
- At $5,893/mo this rent would consume 54% of the median local household income ($131k/yr) (locally 554% of renters already pay >50% of income on rent) — very limited rent-growth headroom before tenants either downsize or default.
Forward outlook
- Local home prices are declining (-3.0%/yr); year-one equity from $3k of loan paydown is wiped out by about $11k of value loss. Plan a longer hold.
- Lee County population projected at +44% by 2050 — long-run rental-demand tailwind backs the buy-and-hold thesis.
- At projected returns (-3.0% appreciation + 2.9% rent growth), your $103k cash investment doubles in ~7 years — after that, you're playing with house money.
Negotiation context
- It's been on market 106 days — a 9% lower offer ($336k) is reasonable based on typical stale-listing flexibility.
- Current owner paid $189k; list at $369k implies a 95% gain — meaningful room to come down on a strong offer.
Risks & watch-outs
- Climate carrying-cost: major flood risk; severe wind risk, 99% chance of damaging wind over 30y; extreme-heat days projected 7→30/yr by 2055 (HVAC capex compounding) — expect insurance premiums to compound above CPI over the hold.
Questions for the listing agent
- It's been on market 106 days. Have you received any prior offers? Is the seller open to a 9% concession, seller financing, or rate buy-down credit?
- What does the HOA fee cover, when was the last increase, and are there any pending special assessments or reserve-fund shortfalls?
- Any open or pending special assessments — roof, HVAC, plumbing, elevator, façade? What's the per-unit balance and payoff schedule, and is the seller paying it off at close or rolling it to the buyer?
- Why hasn't it sold? Are there any deal-killer items the seller is aware of (foundation, flood, title, zoning, code violations)?
- Is there a deadline driving the sale (1031 exchange, divorce, estate, relocation)? That informs how much negotiation room exists.
- This sits on a lake — are riparian / water-frontage rights deeded with the parcel? Any dock permits, shoreline easements, or HOA water-use restrictions?
- What's the documented flood / surge / shoreline-erosion history here (FEMA AND non-FEMA — e.g., storm surge, creek backup, septic-field saturation)?
- Any water-quality or seasonal algae-bloom issues that affect tenant satisfaction or short-term-rental demand?
- What's the average days-on-market for RENTAL listings here right now (not sales)? A rising rental-DOM trend means longer vacancies and softer asking-rent achievability than the comps imply.
- What's the recent tenant-quality profile in this submarket — average credit score on applications, eviction rate, late-payment / NSF rate, and stable-employment percentage? A property-management company in the area should have these aggregated.
- How much new apartment / multifamily construction is in the pipeline within 1–3 miles? Heavy new supply (>2% of stock underway) typically softens rents 12–24 months out; light construction supports rent growth.
Investment metrics
- 1% rule
- 1.60% ✓
- Cap rate
- 11.73%
- Cash-on-cash
- 19.41%
- DSCR
- 1.86
- GRM
- 5.2
CMA / ARV
No comps found within radius.
Projected returns pro-forma
-3.0% appreciation · 2.85% rent growth · sell at horizon
- IRR
- 11.3%
- Equity multiple
- 1.45×
- Total profit
- $46,119
- Equity at exit
- $55,019
- IRR
- 20.2%
- Equity multiple
- 2.69×
- Total profit
- $175,037
- Equity at exit
- $31,904
Cash invested: $103,320 (down + closing). Projections, not guarantees.
Landlord ↔ Tenant lean methodology
- Overall (STATE)
- 87 Strongly Landlord-Friendly
- State Florida
- 87 Strongly Landlord-Friendly · R+3
- County
- — inherits STATE
- City
- — inherits STATE
ZIP-level market 34134
- Rents YoY
- 2.9%
- Active inventory
- 699
- Price-to-rent
- 5.2×
Monthly cashflow live
- Estimated rent
- $5,893 high interval (Pro) →
- Mortgage (P&I)
- −$1,935
- Tax from tax record
- −$327 /mo · $3,918/yr
- Insurance
- −$154
- HOA
- −$569
- Vacancy / Maint / Mgmt
- −$1,238
- Net cashflow
- $1,671
Break-even live
UW: 25.0% down · 7.5% · 30yr · 1.5% tax · 5.0% vac · 8.0% maint · 8.0% mgmt
Financing live
Cash to close
- Down payment
- $92,250
- Closing costs
- $11,070
- Reserves months
- —
- Total cash needed
- —
Loan-product check · same deal, 3 products live
Conventional
25% down · 7.5% · 30yr
- Down + closing
- —
- Monthly P&I
- —
- Monthly cashflow
- —
- DSCR
- —
- Eligible?
- —
Personal DTI + credit; lowest rate.
DSCR
20% down · 8.5% · 30yr
- Down + closing
- —
- Monthly P&I
- —
- Monthly cashflow
- —
- DSCR
- —
- Eligible?
- —
No personal income docs; deal must DSCR.
Hard money
10% down · 12.0% · 12mo
- Down + closing
- —
- Monthly P&I
- —
- Monthly cashflow
- —
- DSCR
- —
- Eligible?
- —
Short-term bridge; refi at stabilization.
Rent comps 40 comps
| Address | Beds | Baths | Sqft | Rent | $/sqft | DOM | Units | Dist |
|---|---|---|---|---|---|---|---|---|
| 28700 Trails Edge Blvd Bonita Springs, FL | 3.0 | 2.0 | 1458 | $2,175 | $1.49 | 3d | 2 | 0.03mi |
| 28611 Carriage Home Dr #101 Bonita Springs, FL | 2.0 | 2.0 | 1433 | $2,550 | $1.78 | 23d | 1 | 0.17mi |
| 28650 Carriage Home Dr Unit 1049692P Bonita Springs, FL | 3.0 | 2.0 | 1528 | $3,980 | $2.60 | 15d | 1 | 0.19mi |
| 1345 Sweetwater Cv #203 Naples, FL | 2.0 | 2.0 | 1279 | $4,800 | $3.75 | 23d | 1 | 0.26mi |
| 28790 Versol Dr Bonita Springs, FL | 1.0–3.0 | 1.0–2.0 | 1075 | $3,391 | $3.15 | 1d | 19 | 0.26mi |
| 1340 Sweetwater Cv #103 Naples, FL | 2.0 | 2.0 | 1279 | $5,000 | $3.91 | 23d | 1 | 0.26mi |
| 28452 Del Lago Way Bonita Springs, FL | 4.0 | 3.0 | 2201 | $7,700 | $3.50 | 23d | 1 | 0.28mi |
| 1325 Sweetwater Cv #201 Naples, FL | 3.0 | 2.0 | 1381 | $6,000 | $4.34 | 23d | 1 | 0.30mi |
| 1415 Sweetwater Cv #104 Naples, FL | 3.0 | 2.0 | 1381 | $6,500 | $4.71 | 23d | 1 | 0.31mi |
| 1360 Sweetwater Cv #202 Naples, FL | 2.0 | 2.0 | 1279 | $5,500 | $4.30 | 23d | 1 | 0.32mi |
| 1420 Sweetwater Cv #102 Naples, FL | 2.0 | 2.0 | 1279 | $5,000 | $3.91 | 21d | 1 | 0.32mi |
| 1420 Sweetwater Cv #102 Naples, FL | 2.0 | 2.0 | 1279 | $5,000 | $3.91 | 23d | 1 | 0.32mi |
| 1405 Sweetwater Cv #204 Naples, FL | 3.0 | 2.0 | 1381 | $6,000 | $4.34 | 23d | 1 | 0.33mi |
| 1405 Sweetwater Cv #204 Naples, FL | 3.0 | 2.0 | 1381 | $6,000 | $4.34 | 13d | 1 | 0.33mi |
| 28327 Hidden Lake Dr Bonita Springs, FL | 3.0 | 2.0 | 1567 | $8,950 | $5.71 | 23d | 1 | 0.33mi |
| 28070 Winthrop Cir Bonita Springs, FL | 3.0 | 3.0 | 2008 | $12,000 | $5.98 | 23d | 1 | 0.34mi |
| 1390 Sweetwater Cv #203 Naples, FL | 2.0 | 2.0 | 1279 | $2,200 | $1.72 | 13d | 1 | 0.37mi |
| 28211 Winthrop Cir Bonita Springs, FL | 3.0 | 2.0 | 1918 | $10,500 | $5.47 | 23d | 1 | 0.37mi |
| 1117 Sweetwater Ln #2201 Naples, FL | 2.0 | 2.0 | 1193 | $6,500 | $5.45 | 23d | 1 | 0.44mi |
| 1214 Sweetwater Ln #2306 Naples, FL | 2.0 | 2.0 | 1378 | $6,500 | $4.72 | 23d | 1 | 0.49mi |
| 28450 Winthrop Cir Unit 1546014P Bonita Springs, FL | 3.0 | 2.0 | 1894 | $7,804 | $4.12 | 13d | 1 | 0.54mi |
| 9021 Las Maderas Dr #202 Bonita Springs, FL | 2.0 | 2.0 | 1674 | $7,500 | $4.48 | 23d | 1 | 0.59mi |
| 1250 Silverstrand Dr Naples, FL | 3.0 | 2.0 | 1848 | $5,000 | $2.71 | 23d | 1 | 0.59mi |
| 28712 Carmel Way Bonita Springs, FL | 3.0 | 2.5 | 1626 | $9,250 | $5.69 | 23d | 1 | 0.60mi |
| 9030 Las Maderas Dr #101 Bonita Springs, FL | 2.0 | 2.0 | 1432 | $2,500 | $1.75 | 23d | 1 | 0.62mi |
| 9050 Las Maderas Dr #101 Bonita Springs, FL | 2.0 | 2.0 | 1364 | $2,100 | $1.54 | 23d | 1 | 0.64mi |
| 9111 Las Maderas Dr #102 Bonita Springs, FL | 2.0 | 2.0 | 1624 | $7,500 | $4.62 | 23d | 1 | 0.64mi |
| 3620 Bailes St Bonita Springs, FL | 3.0 | 3.0 | 1992 | $12,000 | $6.02 | 23d | 1 | 0.65mi |
| 9855 Costa Mesa Ln #403 Bonita Springs, FL | 2.0 | 2.0 | 1146 | $1,600 | $1.40 | 23d | 1 | 0.65mi |
| 3921 Leeward Passage Ct #203 Bonita Springs, FL | 2.0 | 2.0 | 1204 | $3,500 | $2.91 | 23d | 1 | 0.65mi |
| 9851 Costa Mesa Ln Unit 1546344P Bonita Springs, FL | 2.0 | 2.0 | 1194 | $1,935 | $1.62 | 15d | 1 | 0.65mi |
| 8981 Palmas Grandes Blvd #102 Bonita Springs, FL | 2.0 | 2.0 | 1791 | $7,500 | $4.19 | 23d | 1 | 0.68mi |
| 14907 Sterling Oaks Dr Naples, FL | 3.0 | 3.0 | 1760 | $6,500 | $3.69 | 23d | 1 | 0.69mi |
| 3941 Leeward Passage Ct #203 Bonita Springs, FL | 2.0 | 2.0 | 1204 | $2,000 | $1.66 | 23d | 1 | 0.70mi |
| 8990 Palmas Grandes Blvd #201 Bonita Springs, FL | 2.0 | 2.0 | 1797 | $5,000 | $2.78 | 23d | 1 | 0.72mi |
| 28720 Bermuda Bay Way #205 Bonita Springs, FL | 2.0 | 2.0 | 1097 | $2,200 | $2.01 | 14d | 1 | 0.72mi |
| 28940 Bermuda Pointe Cir #102 Bonita Springs, FL | 2.0 | 2.0 | 1076 | $5,500 | $5.11 | 23d | 1 | 0.73mi |
| 3930 Windward Passage Cir #202 Bonita Springs, FL | 2.0 | 2.0 | 1478 | $1,900 | $1.29 | 15d | 1 | 0.74mi |
| 28052 Palmas Grandes Ln #101 Bonita Springs, FL | 2.0 | 2.0 | 1500 | $7,200 | $4.80 | 23d | 1 | 0.74mi |
| 3951 Windward Passage Cir #102 Bonita Springs, FL | 2.0 | 2.0 | 1397 | $5,200 | $3.72 | 23d | 1 | 0.76mi |
HOA detail condo
- Monthly dues
- $569 · $6,828/yr
- Assessments
- None detected in remarks — confirm with the listing agent.
Listing history 14 events
-
2026-06-17days on market $369,000 Active 106 DOM
-
2026-06-16days on market $369,000 Active 105 DOM
-
2026-06-15days on market $369,000 Active 104 DOM
-
2026-06-13days on market $369,000 Active 102 DOM
-
2026-06-10days on market $369,000 Active 99 DOM
-
2026-06-09days on market $369,000 Active 98 DOM
-
2026-06-07days on market $369,000 Active 96 DOM
-
2026-06-02days on market $369,000 Active 91 DOM
-
2026-06-01days on market $369,000 Active 90 DOM
-
2026-06-01days on market $369,000 Active 89 DOM
-
2026-05-15price $369,000
-
2026-03-03$395,000 Active
-
2014-06-05soldstatus $189,000
-
2010-05-28soldstatus $4,223,100
ⓘ Source: listings_history table (triggers on properties + properties_extension) + one-shot
backfill from property_details.listing_events for pre-trigger history.
Tax reassessment forecast FL · Resets to sale price
- Current annual tax
- $3,918 · $327/mo
- Projected year-2 tax
- $3,918 · $327/mo
- Expected delta
- $0/yr ($0/mo · -0.0%)
ⓘ Screening estimate from a state-policy table — verify with the county assessor before closing.
Climate risk First Street
- Flood 6/10 Major FEMA zone X (shaded) · 52% chance over 30 yrs
- Wildfire 2/10 Low
- Heat 10/10 Extreme 7 d/yr ≥107°F today · 30 d/yr by 30 yrs out
- Wind 10/10 Extreme 99% chance of damaging wind over 30 yrs
- Air quality 2/10 Low 1 unhealthy d/yr today · 1 by 30 yrs out
Nearby sold comps map
Loading sold comps map…
Walkable amenities ~0.75 mi
Loading nearby amenities…
Taxation est. · year 1
- Rental income
- $70,719
- − Mortgage interest
- −$20,670
- − Property taxes
- −$3,918
- − Insurance
- −$1,845
- − Repairs & maintenance
- −$5,657
- − Management
- −$5,657
- − HOA
- −$6,828
- − Depreciation
- −$10,735
- Taxable income
- $15,408
- Est. tax owed @ 24.0%
- −$3,698
- After-tax cash flow
- $16,358/yr
For passive investors: Depreciation is non-cash, so a rental often shows a tax loss while cash-flowing — sheltering income. Rental losses are passive: they offset passive income freely, and up to $25,000/yr can offset ordinary (W-2) income if you actively participate and your MAGI is under $100k (phasing out to $0 by $150k); unused losses carry forward. On sale, claimed depreciation is recaptured at up to 25%, and gains may owe capital-gains tax (a 1031 exchange can defer both). Figures are a year-1 estimate at your 24.0% rate — not tax advice; consult a CPA.
Schools (NCES district)
- District
- Lee
- NCES district ID
- 1201080
- Math proficiency
- 47% ▼ -11.00%
- Reading proficiency
- 50% ▼ -4.00%
- Median HH income
- $49,518
- Composite
- 41.49/100
- National rank
- #3458
- State rank
- #42 of 73 in FL
Livability — Bonita Springs
- Score
- 70/100
- State rank
- #428
- US rank
- #7576
Category grades
Schools grade is shown separately in the Schools card above.
Census & demographics
- Census place
- Bonita Springs, FL
- County
- Lee County · 788,662 people
- City population
- 64,727
- Metro
- Cape Coral-Fort Myers, FL
- Population (ZIP)
- 16,475
- Household income
- $130,719
- Rent vs Own
- Severe rent burden
- 554.0
Population outlook (Lee County) Hauer SSP2
- Today (2025)
- 871,946 people
- By 2030
- 955,468 · +9.6%
- By 2040
- 1,113,587 · +27.7%
- By 2050
- 1,256,891 · +44.1%
- By 2075
- 1,560,270 · +78.9%
- By 2100
- 1,726,848 · +98.0%
Race, ethnicity, and origin ACS 2023
- Neighborhood character
- Predominantly White (91%)
- Race & ethnicity
- White 91% Hispanic / Latino 5% Two or more races 3% Asian 1%
- Common ancestry
- Slovak 5% Romanian 4% Serbian 2%
- Foreign-born
- 10% · Canada, Jamaica
- Languages at home
- 91% English-only · Spanish 4% German/W. Germanic 1% Other Indo-European 1%
Political lean MEDSL · Lee
- 2024 margin
- Strong R (+28.4) · D 35.5% · R 63.9%
- 2008→2024 swing
- -18.0pp toward R · 2008: -10.4pp · 2024: -28.4pp
- All cycles
- 2024: R+28.4 2020: R+19.2 2016: R+20.4 2012: R+16.6 2008: R+10.4
Not yet ingested
- Civics
- —
Market trends
- HPI YoY
- ▼ -236.48%
- Current HPI
- 237.4416
- Rent YoY
- ▲ 2.85%
- Metro
- Cape Coral-Fort Myers, FL
- State GDP YoY
- ▲ 3.28%
- F500 in state
- 36
Industry mix (Fortune 500 HQ in FL)
| Industry | F500 HQs | Revenue |
|---|---|---|
| Industrial Technology | 2 | $29B |
|
||
| Insurance | 2 | $17B |
|
||
| Retail | 1 | $60B |
|
||
| Technology Distribution | 1 | $58B |
|
||
| Homebuilding | 1 | $35B |
|
||
| Technology Manufacturing | 1 | $35B |
|
||
Price history
-91.3% since first listed4 events — show timeline
- 2026-05-15 Price Changed $369,000 NAPLESMLS
- 2026-03-03 Listed $395,000 NAPLESMLS
- 2014-06-05 Sold (Public Records) $189,000 Public Records
- 2010-05-28 Sold (Public Records) $4,223,100 Public Records
Property tax history
+4.8%/yrLatest (2025): $3,918 · +5.5% YoY. Source: county tax records.
Cash-flow waterfall
monthlySold comps — $/sqft
last 12 mo · ≤1 miLoading sold comps…