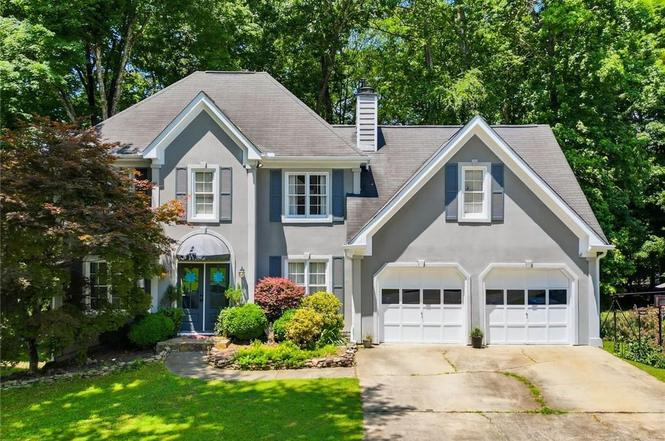
717 Jamie Way NE · Woodstock, GA
Flood risk 1/10 · Minimal
- FEMA flood zone
- X (unshaded)
- Chance of flooding over 30 yrs
- 0.0%
- Est. flood insurance / yr
- $473 – $860
Fire risk 1/10 · Minimal
- Est. fire insurance / yr
- $963 – $1,789
Heat risk 5/10 · Moderate
- Hot days now (above 103°F)
- 7 days/yr
- Hot days in 30 yrs
- 18 days/yr
Wind risk 4/10 · Minor
- Chance of severe wind over 30 yrs
- 15.0%
Air-quality risk 4/10 · Minor
- Unhealthy air days now
- 5 days/yr
- Unhealthy air days in 30 yrs
- 7 days/yr
Risk factors via First Street. Map © Google.
Why this score? — see what drove the D grade
The composite is a weighted blend of 9 inputs, each scored 0–100. Each bar is that input's sub-score; the figure is the points it added to the 100-point composite (weight × sub-score).
- ARV discount +14.0/15.0
- Cash flow +11.0/30.0
- Schools +3.8/10.0
- Livability +3.7/5.0
- Rent growth +3.5/5.0
- DSCR +3.2/10.0
- 1% rule +2.7/10.0
- Condition / age +2.5/5.0
- Appreciation +0.0/10.0
$450,000
🖨 Deal sheet 📄 Offer letter ✓ Due diligence
Listing remarks MLS
Welcome home to 717 Jamie Way NE, located in the beautiful Chadds Ridge Neighborhood! Nestled in a lush, tree-canopied setting, this stunning stucco home offers the perfect blend of comfort and functionality. The updated primary suite is a true retreat, designed with today's buyer in mind. Downstairs, the fully finished basement with kitchenette opens up endless possibilities - whether you're hosting guests, accommodating multi-generational family, or creating the ultimate entertainment space. Step outside and discover one of this home's most coveted features: direct backyard access to the Noonday Creek Trail, part of Woodstock's beloved trail system now undergoing a major regional extension connecting all the way to Cobb County and eventually the Silver Comet Trail. Walk, run, or ride right from your backyard into one of Cherokee County's greatest outdoor amenities. Opportunities like this - where location, lifestyle, and livability align - don't come around often. Schedule your showing today!
Key facts
- Kitchenette
- 9,016 sq ft lot
- 2 garage spots
Tags
Property features AI
Finance
- Other: Asphalt road frontage; Directions: GPS; County: Cobb - GA
- HOA & community: Homeowners association with $500 annual fee; HOA amenities include pool and tennis courts; association covers swim and tennis
Exterior
- Parking: Garage (2 garage spaces); Total parking for 4 vehicles
- Utilities: Public water; Public sewer; Electricity available (440 Volts); Sewer available; Water available
- Home design: Three or more levels; Resale property; Stucco exterior; Other roof type; Slab foundation
- Construction: Built with stucco construction
- Exterior features: Rear porch; Deck; Shed(s); Other exterior features
Interior
- Kitchen: Kitchen island; Dishwasher; Electric range; Refrigerator; Microwave
- Bedrooms: Four bedrooms on the upper level; One bedroom on the lower level; No special bedroom features listed
- Flooring: Hardwood flooring
- Bathrooms: Three full bathrooms; One half bathroom; Master bathroom with double vanity; One half bath on the main level; Two full baths on the upper level; One full bath on the lower level
- Heating & cooling: Central heating; Central air
- Interior features: Wet bar; One fireplace located in the family/other room; Partial basement
- Laundry & utility: Laundry located in hall
Neighborhood map
What this means for you Summary
Snapshot
- This is a 5-bed/3.5-bath single-family listed at $450k.
Deal economics
- At list price, monthly cash flow is $-193 ($-2k/yr) — negative.
- To cash-flow at today's rent, offer at most $416k (7.6% below list).
- To meet the 1% rule (rent ≥ 1% of price), the offer needs to be $347k (22.8% below list).
- Recommended offer: $347k (22.8% below list) — sets the bar for 1% rule.
- Cap rate 5.8% vs local median 3.4% in Woodstock — top-decile yield for the area; either an underpriced asset or a hidden risk that comps aren't pricing in. Stress-test before assuming the spread holds.
Location & tenants
- Location reads 73/100 on livability (#46 in GA) — a middle-class / working-renter tenant base. Strengths: crime A+, employment A+, housing A+; Watch: amenities F, commute F, health & safety F.
- Cobb County (suburban): math 39% / reading 45% proficiency, ranked #25 of 174 in GA (top 14%) — families likely to look elsewhere, expect single-tenant / working-renter base with shorter leases.
- Zoned schools: Nicholson Elementary School (math 42% / reading 42%, grade F, #380 of 1,228 statewide, top 33%, 407 students, 36% FRL); Mccleskey Middle School (math 37% / reading 44%, grade F, #140 of 470 statewide, top 30%, 570 students, 34% FRL); Kell High School (math 28% / reading 21%, grade F, #184 of 424 statewide, top 48%, 1,506 students, 32% FRL).
- Market conditions: Rents rising (+4.0%/yr); 614 active listings in the ZIP; 7 comparable units currently listed for rent nearby; rentals at typical pace (median 19d on market — plan ~3-4 weeks tenant-placement turnaround); 43% of comp listings sitting > 30 days — soft ceiling on asking rent; solid renter incomes; 1,625 units permitted in Cobb County in 2024 (389 in 5+ unit buildings).
- This rent runs 39% of the median local income ($107k/yr) — at the standard rent-burdened threshold; future hikes will face affordability resistance.
Forward outlook
- Local home prices are declining (-3.0%/yr); year-one equity from $3k of loan paydown is wiped out by about $14k of value loss. Plan a longer hold.
- Cobb County population projected at +33% by 2050 — long-run rental-demand tailwind backs the buy-and-hold thesis.
Negotiation context
- Only 8 days on market — expect competitive offers; lowballing is unlikely to land.
- 2 sale attempts with the ask held roughly flat each time — persistent listings suggest the price (not the market) is what's stuck; bring a comps-based counter.
- Current owner paid $183k; list at $450k implies a 146% gain — meaningful room to come down on a strong offer.
Risks & watch-outs
- Climate carrying-cost: extreme-heat days projected 7→18/yr by 2055 (HVAC capex compounding) — expect insurance premiums to compound above CPI over the hold.
Questions for the listing agent
- What do current leases actually rent for vs. the listed asking? Can we see a recent rent roll and the last 12 months of T-12 income?
- What does the HOA fee cover, when was the last increase, and are there any pending special assessments or reserve-fund shortfalls?
- Is there a deadline driving the sale (1031 exchange, divorce, estate, relocation)? That informs how much negotiation room exists.
- Schools are B-rated — typically a magnet for longer-tenancy family renters. What's the average tenant stay here, and is there a school-zone premium baked into asking?
- The area grade is low — what's the realistic commute time and amenity access for the typical tenant pool here? Any planned neighborhood developments (good or bad) we should know about?
- What's the average days-on-market for RENTAL listings here right now (not sales)? A rising rental-DOM trend means longer vacancies and softer asking-rent achievability than the comps imply.
- What's the recent tenant-quality profile in this submarket — average credit score on applications, eviction rate, late-payment / NSF rate, and stable-employment percentage? A property-management company in the area should have these aggregated.
- How much new for-sale + rental construction is in the pipeline within 1–3 miles? Heavy new supply typically softens prices + rents 12–24 months out; constrained supply supports both.
Investment metrics
- 1% rule
- 0.77% ✗
- Cap rate
- 5.78%
- Cash-on-cash
- -1.84%
- DSCR
- 0.92
- GRM
- 10.8
CMA / ARV
- ARV (on-the-fly)
- $526,470
- Comps found
- 12
Show comp detail 12 sales within ~0.75 mi
| Address | Dist | Beds/Ba | Sqft | Sold | Price | $/sf | Match |
|---|---|---|---|---|---|---|---|
| 735 Jamie Way NE | 0.11mi | 4/3.5 (-1) | 2,678 (+7%) | 10mo | $459,500 | $172 | 70 |
| 724 Helga Dr NE | 0.21mi | 4/3.0 (-1) | 2,671 (+6%) | 17mo | $443,350 | $166 | 58 |
| 5028 Jamie Ct NE | 0.09mi | 4/2.5 (-1) | 2,855 (+14%) | 10mo | $365,000 | $128 | 56 |
| 4845 Helga Way NE | 0.23mi | 5/3.5 | 2,747 (+10%) | 22mo | $425,000 | $155 | 55 |
| 4819 Helga Way NE | 0.29mi | 5/3.5 | 2,724 (+9%) | 23mo | $445,000 | $163 | 53 |
| 4714 Canary Diamond Ln | 0.46mi | 5/4.0 | 2,655 (+6%) | 19mo | $591,680 | $223 | 51 |
| 4778 Moonstone Trce | 0.54mi | 4/3.5 (-1) | 2,233 (-11%) | 7mo | $547,200 | $245 | 46 |
| 675 Smokey Quartz Way | 0.48mi | 4/3.5 (-1) | 2,233 (-11%) | 17mo | $500,000 | $224 | 40 |
| 4761 Black Onyx Path | 0.45mi | 4/3.5 (-1) | 2,233 (-11%) | 19mo | $529,504 | $237 | 40 |
| 4748 Black Onyx Path | 0.48mi | 4/3.5 (-1) | 2,233 (-11%) | 20mo | $539,429 | $242 | 38 |
| 155 Castleair Ct NE | 0.56mi | 4/3.0 (-1) | 2,831 (+13%) | 14mo | $375,000 | $132 | 34 |
| 256 Sharney Ln NE | 0.66mi | 4/3.0 (-1) | 2,183 (-13%) | 10mo | $458,000 | $210 | 33 |
Match score weights: distance 35% · size 25% · config 20% · recency 20%. Top-matched comps best support the ARV.
Projected returns pro-forma
-3.0% appreciation · 3.96% rent growth · sell at horizon
- IRR
- -18.4%
- Equity multiple
- 0.35×
- Total profit
- $-81,904
- Equity at exit
- $67,096
- IRR
- -9.0%
- Equity multiple
- 0.42×
- Total profit
- $-73,229
- Equity at exit
- $38,908
Cash invested: $126,000 (down + closing). Projections, not guarantees.
Landlord ↔ Tenant lean methodology
- Overall (STATE)
- 90 Strongly Landlord-Friendly
- State Georgia
- 90 Strongly Landlord-Friendly · R+3
- County
- — inherits STATE
- City
- — inherits STATE
ZIP-level market 30188
- Rents YoY
- 4.0%
- Active inventory
- 614
- Price-to-rent
- 10.8×
Monthly cashflow live
- Estimated rent
- $3,473 high interval (Pro) →
- Mortgage (P&I)
- −$2,360
- Tax from tax record
- −$347 /mo · $4,169/yr
- Insurance
- −$188
- HOA
- −$42
- Vacancy / Maint / Mgmt
- −$729
- Net cashflow
- $-193
Break-even live
UW: 25.0% down · 7.5% · 30yr · 1.5% tax · 5.0% vac · 8.0% maint · 8.0% mgmt
Financing live
Cash to close
- Down payment
- $112,500
- Closing costs
- $13,500
- Reserves months
- —
- Total cash needed
- —
Loan-product check · same deal, 3 products live
Conventional
25% down · 7.5% · 30yr
- Down + closing
- —
- Monthly P&I
- —
- Monthly cashflow
- —
- DSCR
- —
- Eligible?
- —
Personal DTI + credit; lowest rate.
DSCR
20% down · 8.5% · 30yr
- Down + closing
- —
- Monthly P&I
- —
- Monthly cashflow
- —
- DSCR
- —
- Eligible?
- —
No personal income docs; deal must DSCR.
Hard money
10% down · 12.0% · 12mo
- Down + closing
- —
- Monthly P&I
- —
- Monthly cashflow
- —
- DSCR
- —
- Eligible?
- —
Short-term bridge; refi at stabilization.
Rent comps 7 comps
| Address | Beds | Baths | Sqft | Rent | $/sqft | DOM | Units | Dist |
|---|---|---|---|---|---|---|---|---|
| 4723 Canary Diamond Ln Kennesaw, GA | 4.0 | 3.5 | 2200 | $3,250 | $1.48 | 18d | 1 | 0.43mi |
| 675 Smokey Quartz Way Kennesaw, GA | 4.0 | 3.5 | 2390 | $3,250 | $1.36 | 5d | 1 | 0.47mi |
| 314 New Crossing Trl E Kennesaw, GA | 4.0 | 4.0 | 2328 | $800 | $0.34 | 43d | 1 | 1.11mi |
| 527 Charing Cross Dr Marietta, GA | 4.0 | 3.0 | 2600 | $6,300 | $2.42 | 43d | 1 | 1.26mi |
| 134 Lexington Parke Dr Woodstock, GA | 4.0 | 2.5 | 1931 | $2,600 | $1.35 | 11d | 1 | 1.38mi |
| 134 Lexington Parke Dr Woodstock, GA | 4.0 | 2.5 | 1931 | $2,600 | $1.35 | 10d | 1 | 1.38mi |
| 4771 N Springs Rd NW Kennesaw, GA | 4.0 | 2.0 | 2280 | $2,410 | $1.06 | 43d | 1 | 1.40mi |
HOA detail
- Monthly dues
- $42 · $504/yr
Listing history 7 events
-
2026-06-18days on market $450,000 Active 8 DOM
-
2026-06-17days on market $450,000 Active 7 DOM
-
2026-06-16days on market $450,000 Active 6 DOM
-
2026-06-15days on market $450,000 Active 5 DOM
-
2026-06-13days on market $450,000 Active 3 DOM
-
2026-06-13remarks 693-char remark
-
2026-06-13$450,000 Active 2 DOM
ⓘ Source: listings_history table (triggers on properties + properties_extension) + one-shot
backfill from property_details.listing_events for pre-trigger history.
Tax reassessment forecast GA · Resets to sale price
- Current annual tax
- $4,169 · $347/mo
- Projected year-2 tax
- $4,169 · $347/mo
- Expected delta
- $0/yr ($0/mo · 0.0%)
ⓘ Screening estimate from a state-policy table — verify with the county assessor before closing.
Climate risk First Street
- Flood 1/10 Low FEMA zone X (unshaded) · 0% chance over 30 yrs
- Wildfire 1/10 Low
- Heat 5/10 Major 7 d/yr ≥103°F today · 18 d/yr by 30 yrs out
- Wind 4/10 Moderate 15% chance of damaging wind over 30 yrs
- Air quality 4/10 Moderate 5 unhealthy d/yr today · 7 by 30 yrs out
Nearby sold comps map
Loading sold comps map…
Walkable amenities ~0.75 mi
Loading nearby amenities…
Taxation est. · year 1
- Rental income
- $41,672
- − Mortgage interest
- −$25,207
- − Property taxes
- −$4,169
- − Insurance
- −$2,250
- − Repairs & maintenance
- −$3,334
- − Management
- −$3,334
- − HOA
- −$504
- − Depreciation
- −$13,091
- Taxable loss
- −$10,217
- Est. tax savings @ 24.0%
- +$2,452
- After-tax cash flow
- $131/yr
For passive investors: Depreciation is non-cash, so a rental often shows a tax loss while cash-flowing — sheltering income. Rental losses are passive: they offset passive income freely, and up to $25,000/yr can offset ordinary (W-2) income if you actively participate and your MAGI is under $100k (phasing out to $0 by $150k); unused losses carry forward. On sale, claimed depreciation is recaptured at up to 25%, and gains may owe capital-gains tax (a 1031 exchange can defer both). Figures are a year-1 estimate at your 24.0% rate — not tax advice; consult a CPA.
Schools (NCES district)
- District
- Cobb County
- NCES district ID
- 1301290
- Math proficiency
- 39% ▼ -15.00%
- Reading proficiency
- 45% ▼ -10.00%
- Median HH income
- $68,845
- Composite
- 37.93/100
- National rank
- #4308
- State rank
- #25 of 174 in GA
Livability — Woodstock
- Score
- 73/100
- State rank
- #46
- US rank
- #5116
Category grades
Schools grade is shown separately in the Schools card above.
Census & demographics
- County
- Cherokee County · 289,977 people
- City population
- 109,446
- Metro
- Atlanta-Sandy Springs-Alpharetta, GA
- Population (ZIP)
- 69,518
- Household income
- $106,844
- Rent vs Own
- Severe rent burden
- 1591.0
Population outlook (Cobb County) Hauer SSP2
- Today (2025)
- 868,385 people
- By 2030
- 929,614 · +7.1%
- By 2040
- 1,047,533 · +20.6%
- By 2050
- 1,155,537 · +33.1%
- By 2075
- 1,405,030 · +61.8%
- By 2100
- 1,555,058 · +79.1%
Race, ethnicity, and origin ACS 2023
- Neighborhood character
- Predominantly White (74%)
- Race & ethnicity
- White 74% Hispanic / Latino 9% Two or more races 8% Black 7% Asian 4%
- Hispanic origin (detail)
- Mexican 4% Puerto Rican 1%
- Common ancestry
- Slovak 3% Italian 3% Lithuanian 3%
- Foreign-born
- 11% · Canada, Vietnam, South Korea
- Languages at home
- 87% English-only · Spanish 7% Other Indo-European 3% Other Asian/Pacific 1%
Political lean MEDSL · Cobb
- 2024 margin
- D (+14.9) · D 56.9% · R 42.0% · Other 1.1%
- 2008→2024 swing
- +24.3pp toward D · 2008: -9.4pp · 2024: 14.9pp
- All cycles
- 2024: D+14.9 2020: D+14.3 2016: D+2.1 2012: R+12.6 2008: R+9.4
Not yet ingested
- Civics
- —
Market trends
- HPI YoY
- ▼ -291.54%
- Current HPI
- 260.554
- Rent YoY
- ▲ 3.96%
- Metro
- Atlanta-Sandy Springs-Alpharetta, GA
- State GDP YoY
- ▲ 2.66%
- F500 in state
- 28
Industry mix (Fortune 500 HQ in GA)
| Industry | F500 HQs | Revenue |
|---|---|---|
| Paper / Packaging | 2 | $29B |
|
||
| Retail | 1 | $160B |
|
||
| Transportation / Logistics | 1 | $91B |
|
||
| Airlines | 1 | $62B |
|
||
| Consumer Goods | 1 | $47B |
|
||
| Utilities | 1 | $25B |
|
||
Price history
+1637.5% since first listed4 events — show timeline
- 2026-06-08 Listed $450,000 GAMLS
- 2026-06-08 Listed $450,000 FMLS
- 2002-05-03 Sold (Public Records) $183,000 Public Records
- 1991-06-28 Sold (Public Records) $25,900 Public Records
Property tax history
+5.3%/yrLatest (2025): $4,169 · -0.1% YoY. Source: county tax records.
Cash-flow waterfall
monthlySold comps — $/sqft
last 12 mo · ≤1 miLoading sold comps…