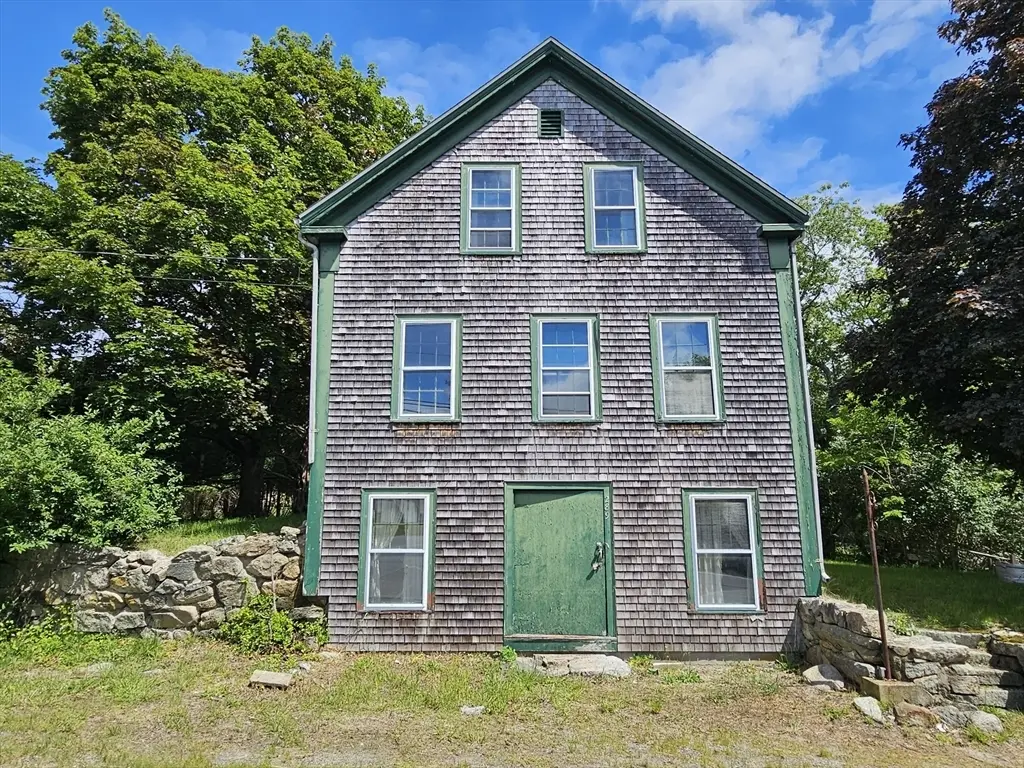
289 North Ave · Rochester, MA
Flood risk 1/10 · Minimal
- FEMA flood zone
- X (unshaded)
- Chance of flooding over 30 yrs
- 0.0%
- Est. flood insurance / yr
- $473 – $860
Fire risk 3/10 · Minor
- Est. fire insurance / yr
- $915 – $1,699
Heat risk 5/10 · Moderate
- Hot days now (above 97°F)
- 7 days/yr
- Hot days in 30 yrs
- 15 days/yr
Wind risk 8/10 · Major
- Chance of severe wind over 30 yrs
- 80.0%
Air-quality risk 2/10 · Minimal
- Unhealthy air days now
- 1 days/yr
- Unhealthy air days in 30 yrs
- 2 days/yr
Risk factors via First Street. Map © Google.
Why this score? — see what drove the B- grade
The composite is a weighted blend of 9 inputs, each scored 0–100. Each bar is that input's sub-score; the figure is the points it added to the 100-point composite (weight × sub-score).
- Cash flow +30.0/30.0
- DSCR +10.0/10.0
- 1% rule +9.0/10.0
- ARV discount +7.5/15.0
- Schools +4.7/10.0
- Rent growth +2.5/5.0
- Livability +2.5/5.0
- Condition / age +2.5/5.0
- Appreciation +0.0/10.0
$299,900
🖨 Deal sheet (PDF) 📄 Offer letter ✓ Due diligence
Listing remarks
Charming 1828 Antique Colonial in Rural Rochester – Bring Your Vision!Discover the timeless appeal of quintessential New England living with this 1828 antique Colonial, nestled in the heart of scenic, rural Rochester. Perfect for contractors, investors, or historic home enthusiasts, this property is brimming with character and awaits your creative updates and restoration to bring it back to its full glory. The classic layout features a central living room, a traditional dining room, and a kitchen ready to be transformed into your dream culinary space. With 3 bedrooms and 1 full bathroom, the home offers a solid foundation for those looking to build equity or customize a piece of local
Key facts
- Central living room
- Antique colonial
- 0.36 acre lot
Tags
Property features AI
Finance
- Other: Buyer responsible for Title 5 and smoke detector certification
- HOA & community: Not a senior community
Exterior
- Parking: 2 open parking spaces
- Utilities: Private water; Private sewer
- Home design: Single-family residence; 1,579 above-grade finished area
- Construction: Stone foundation; Year built per public records
- Exterior features: Level lot
Interior
- Bathrooms: 1 full bathroom
- Heating & cooling: Forced air heating (oil)
- Interior features: 8 total rooms; Walk-out basement; One fireplace
Neighborhood map
What this means for you Summary
Snapshot
- This is a 4-bed/1.0-bath single-family listed at $300k.
Deal economics
- At list price, monthly cash flow is $1k ($15k/yr) — positive.
- The deal already cash-flows at list — no discount required.
- Meets the 1% rule at list price ($4k rent vs $300k).
- Recommended offer: $295k (1.5% below list) — sets the bar for market timing.
Location & tenants
- Location reads: area grade B — affects rentability + tenant quality, not the cash-flow math above.
- Rochester (rural): math 44% / reading 56% proficiency, ranked #103 of 302 in MA (top 34%) — acceptable for families but not a draw, mixed tenant base, ~2y average lease; only 12% free/reduced lunch — higher-income household profile.
- Market conditions: 17 active listings in the ZIP; 1 comparable units currently listed for rent nearby; 1,255 units permitted in Plymouth County in 2024 (411 in 5+ unit buildings).
Forward outlook
- Local home prices are declining (-3.0%/yr); year-one equity from $2k of loan paydown is wiped out by about $9k of value loss. Plan a longer hold.
- At projected returns (-3.0% appreciation + 3.0% rent growth), your $84k cash investment doubles in ~7 years — after that, you're playing with house money.
Negotiation context
- It's been on market 15 days — a 2% lower offer ($295k) is reasonable based on typical stale-listing flexibility.
Risks & watch-outs
- Watch-outs: built in 1828 — expect roof / HVAC / electrical / plumbing capex.
- Climate carrying-cost: severe wind risk, 80% chance of damaging wind over 30y; extreme-heat days projected 7→15/yr by 2055 (HVAC capex compounding) — expect insurance premiums to compound above CPI over the hold.
Questions for the listing agent
- Built in 1828 — when were the roof, HVAC, electrical panel, plumbing, and water heater last replaced?
- Is there a deadline driving the sale (1031 exchange, divorce, estate, relocation)? That informs how much negotiation room exists.
- What's the average days-on-market for RENTAL listings here right now (not sales)? A rising rental-DOM trend means longer vacancies and softer asking-rent achievability than the comps imply.
- What's the recent tenant-quality profile in this submarket — average credit score on applications, eviction rate, late-payment / NSF rate, and stable-employment percentage? A property-management company in the area should have these aggregated.
- How much new for-sale + rental construction is in the pipeline within 1–3 miles? Heavy new supply typically softens prices + rents 12–24 months out; constrained supply supports both.
Investment metrics
- 1% rule
- 1.40% ✓
- Cap rate
- 11.43%
- Cash-on-cash
- 18.34%
- DSCR
- 1.82
- GRM
- 6.0
CMA / ARV
No comps found within radius.
Projected returns pro-forma
-3.0% appreciation · 3.0% rent growth · sell at horizon
- IRR
- 10.0%
- Equity multiple
- 1.40×
- Total profit
- $33,169
- Equity at exit
- $44,716
- IRR
- 19.1%
- Equity multiple
- 2.60×
- Total profit
- $134,281
- Equity at exit
- $25,930
Cash invested: $83,972 (down + closing). Projections, not guarantees.
Landlord ↔ Tenant lean methodology
- Overall (STATE)
- 20 Strongly Tenant-Friendly
- State Massachusetts
- 20 Strongly Tenant-Friendly · D+15
- County
- — inherits STATE
- City
- — inherits STATE
ZIP-level market 02770
- Home prices YoY
- -16.6%
- Active inventory
- 17
- Price-to-rent
- 6.0×
Monthly cashflow live
- Estimated rent
- $4,200 medium interval (Pro) →
- Mortgage (P&I)
- −$1,573
- Tax from tax record
- −$337 /mo · $4,046/yr
- Insurance
- −$125
- HOA
- −$0
- Vacancy / Maint / Mgmt
- −$882
- Net cashflow
- $1,283
Break-even live
Sensitivity live
| Price | -10% $1,453 | -5% $1,368 | +0% $1,283 | +5% $1,198 | +10% $1,113 |
|---|---|---|---|---|---|
| Rent | -10% $951 | -5% $1,117 | +0% $1,283 | +5% $1,449 | +10% $1,615 |
| Rate | -1.0pp $1,434 | -0.5pp $1,359 | base $1,283 | +0.5pp $1,205 | +1.0pp $1,126 |
UW: 25.0% down · 7.5% · 30yr · 1.5% tax · 5.0% vac · 8.0% maint · 8.0% mgmt
Financing live
Cash to close
- Down payment
- $74,975
- Closing costs
- $8,997
- Reserves months
- —
- Total cash needed
- —
Loan-product check · same deal, 3 products live
Conventional
25% down · 7.5% · 30yr
- Down + closing
- —
- Monthly P&I
- —
- Monthly cashflow
- —
- DSCR
- —
- Eligible?
- —
Personal DTI + credit; lowest rate.
DSCR
20% down · 8.5% · 30yr
- Down + closing
- —
- Monthly P&I
- —
- Monthly cashflow
- —
- DSCR
- —
- Eligible?
- —
No personal income docs; deal must DSCR.
Hard money
10% down · 12.0% · 12mo
- Down + closing
- —
- Monthly P&I
- —
- Monthly cashflow
- —
- DSCR
- —
- Eligible?
- —
Short-term bridge; refi at stabilization.
Rent comps 1 comps
| Address | Beds | Baths | Sqft | Rent | $/sqft | DOM | Units | Dist |
|---|---|---|---|---|---|---|---|---|
| 5 Pauline Way Rochester, MA | 3.0 | 2.5 | 1900 | $4,200 | $2.21 | 24d | 1 | 1.42mi |
Listing history 12 events
-
2026-06-18days on market $299,900 Active 15 DOM
-
2026-06-17days on market $299,900 Active 14 DOM
-
2026-06-16days on market $299,900 Active 13 DOM
-
2026-06-15days on market $299,900 Active 12 DOM
-
2026-06-13days on market $299,900 Active 10 DOM
-
2026-06-13days on market $299,900 Active 9 DOM
-
2026-06-09days on market $299,900 Active 6 DOM
-
2026-06-08days on market $299,900 Active 5 DOM
-
2026-06-08status $299,900 Active 4 DOM
-
2026-06-07days on market $299,900 New 4 DOM
-
2026-06-04remarks 693-char remark
-
2026-06-04$299,900 New 1 DOM
ⓘ Source: listings_history table (triggers on properties + properties_extension) + one-shot
backfill from property_details.listing_events for pre-trigger history.
Tax reassessment forecast MA · Partial reset (capped growth)
- Current annual tax
- $4,046 · $337/mo
- Projected year-2 tax
- $4,046 · $337/mo
- Expected delta
- $0/yr ($0/mo · 0.0%)
ⓘ Screening estimate from a state-policy table — verify with the county assessor before closing.
Climate risk First Street
- Flood 1/10 Low FEMA zone X (unshaded) · 0% chance over 30 yrs
- Wildfire 3/10 Moderate
- Heat 5/10 Major 7 d/yr ≥97°F today · 15 d/yr by 30 yrs out
- Wind 8/10 Severe 80% chance of damaging wind over 30 yrs
- Air quality 2/10 Low 1 unhealthy d/yr today · 2 by 30 yrs out
Nearby sold comps map
Loading sold comps map…
Walkable amenities ~0.75 mi
Loading nearby amenities…
Taxation est. · year 1
- Rental income
- $50,400
- − Mortgage interest
- −$16,799
- − Property taxes
- −$4,046
- − Insurance
- −$1,500
- − Repairs & maintenance
- −$4,032
- − Management
- −$4,032
- − Depreciation
- −$8,724
- Taxable income
- $11,267
- Est. tax owed @ 24.0%
- −$2,704
- After-tax cash flow
- $12,694/yr
For passive investors: Depreciation is non-cash, so a rental often shows a tax loss while cash-flowing — sheltering income. Rental losses are passive: they offset passive income freely, and up to $25,000/yr can offset ordinary (W-2) income if you actively participate and your MAGI is under $100k (phasing out to $0 by $150k); unused losses carry forward. On sale, claimed depreciation is recaptured at up to 25%, and gains may owe capital-gains tax (a 1031 exchange can defer both). Figures are a year-1 estimate at your 24.0% rate — not tax advice; consult a CPA.
Schools (NCES district)
- District
- Rochester
- NCES district ID
- 2510140
- Math proficiency
- 44% ▼ -8.00%
- Reading proficiency
- 56% ▼ -2.00%
- Median HH income
- $95,061
- Composite
- 47.05/100
- National rank
- #2340
- State rank
- #103 of 302 in MA
Livability — Rochester
No livability data for this city. (Only ~50 U.S. cities are tracked.)
Census & demographics
- Population (ZIP)
- 5,716
Population outlook (Plymouth County) Hauer SSP2
- Today (2025)
- 533,105 people
- By 2030
- 541,862 · +1.6%
- By 2040
- 549,791 · +3.1%
- By 2050
- 542,476 · +1.8%
- By 2075
- 518,429 · -2.8%
- By 2100
- 448,179 · -15.9%
Race, ethnicity, and origin ACS 2023
- Neighborhood character
- Predominantly White (90%)
- Race & ethnicity
- White 90% Two or more races 5%
- Common ancestry
- Russian 14% Lithuanian 8% Romanian 4%
- Foreign-born
- 6% · Canada
- Languages at home
- 95% English-only · Other Indo-European 4% Spanish 1%
Political lean MEDSL · Plymouth
- 2024 margin
- Lean D (+8.8) · D 53.6% · R 44.7% · Other 1.7%
- 2008→2024 swing
- +1.3pp toward D · 2008: 7.6pp · 2024: 8.8pp
- All cycles
- 2024: D+8.8 2020: D+17.4 2016: D+7.2 2012: D+3.8 2008: D+7.6
Not yet ingested
- Civics
- —
Market trends
- HPI YoY
- ▼ -63.27%
- Current HPI
- 317.0508
- Rent YoY
- —
- Metro
- —
- State GDP YoY
- ▲ 2.28%
- F500 in state
- 38
Industry mix (Fortune 500 HQ in MA)
| Industry | F500 HQs | Revenue |
|---|---|---|
| Technology | 3 | $17B |
|
||
| Insurance | 2 | $84B |
|
||
| Retail | 2 | $76B |
|
||
| Life Sciences | 1 | $43B |
|
||
| Energy Technology | 1 | $31B |
|
||
| Aerospace / Defense | 1 | $18B |
|
||
Price history
1 event — show timeline
- 2026-06-03 Listed $299,900 MLS PIN
Property tax history
+3.0%/yrLatest (2025): $4,046 · +1.8% YoY. Source: county tax records.
Cash-flow waterfall
monthlySold comps — $/sqft
last 12 mo · ≤1 miLoading sold comps…