3013 E Central Blvd · Orlando, FL
Flood risk 1/10 · Minimal
- FEMA flood zone
- X (unshaded)
- Chance of flooding over 30 yrs
- 0.0%
- Est. flood insurance / yr
- $507 – $1,088
Fire risk 1/10 · Minimal
- Est. fire insurance / yr
- $947 – $1,759
Heat risk 9/10 · Severe
- Hot days now (above 107°F)
- 7 days/yr
- Hot days in 30 yrs
- 23 days/yr
Wind risk 9/10 · Severe
- Chance of severe wind over 30 yrs
- 99.0%
Air-quality risk 2/10 · Minimal
- Unhealthy air days now
- 1 days/yr
- Unhealthy air days in 30 yrs
- 1 days/yr
Risk factors via First Street. Map © Google.
Why this score? — see what drove the C- grade
The composite is a weighted blend of 9 inputs, each scored 0–100. Each bar is that input's sub-score; the figure is the points it added to the 100-point composite (weight × sub-score).
- Cash flow +19.6/30.0
- ARV discount +7.5/15.0
- DSCR +6.2/10.0
- 1% rule +5.4/10.0
- Livability +4.3/5.0
- Schools +4.1/10.0
- Rent growth +3.2/5.0
- Condition / age +2.5/5.0
- Appreciation +0.0/10.0
$299,900
🖨 Deal sheet 📄 Offer letter ✓ Due diligence
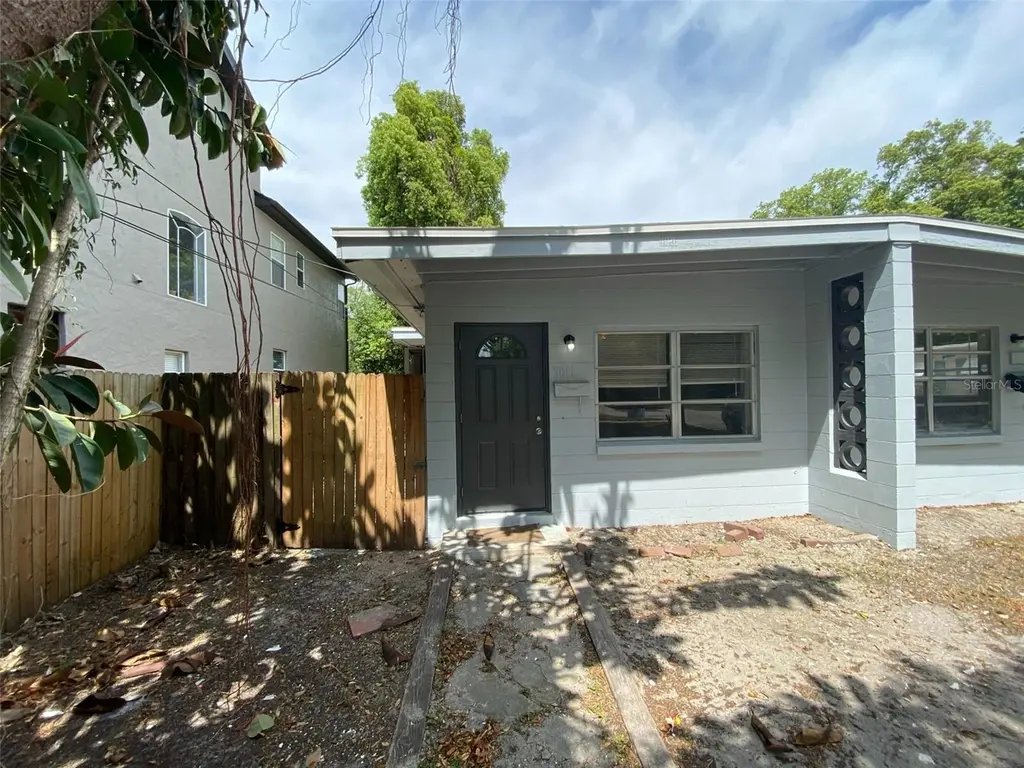
Listing remarks
Under contract-accepting backup offers. Great investment opportunity in a prime location near the Orlando Executive Airport! This duplex features two units, each offering 2 bedrooms and 1 bathroom. While the property does need updating and repairs, it presents incredible potential for value-add investors. One unit is currently occupied, allowing you to start generating income from day one, while the vacant unit provides the perfect opportunity to renovate and maximize rental value. Conveniently located near Downtown Orlando, with easy access to the 408 highway and nearby shopping, this property combines location, income potential, and upside. An ideal addition to any investment portfolio. N
Key facts
- Easy access
- Income potential
- Two units
Tags
Property features AI
Finance
- Other: Property zoned R-2A/T/AN; Unfurnished; Universal property ID available
- Financial info: Lease restrictions apply
- HOA & community: No HOA or association reported
Exterior
- Parking: Parking details not provided
- Security: No security features reported
- Utilities: Public water; Public sewer; Electricity connected; Cable available; Water and sewer connected
- Home design: Residential half-duplex; One story; North-facing
- Construction: Block construction; Shingle and other roof; Slab foundation; Completed condition; Living area ~1508 sq ft
- Exterior features: Asphalt road access; Lot approximately 0.15 acres (about 627 sq m)
Interior
- Kitchen: No appliances reported
- Bedrooms: 4 bedrooms
- Flooring: Concrete flooring
- Bathrooms: 2 full bathrooms
- Heating & cooling: Ductless heating; Wall/window cooling units
- Interior features: No notable interior features reported
- Laundry & utility: No laundry features
Neighborhood map
What this means for you Summary
Snapshot
- This is a 4-bed/2.0-bath townhouse listed at $300k.
Deal economics
- At list price, monthly cash flow is $346 ($4k/yr) — positive.
- The deal already cash-flows at list — no discount required.
- Meets the 1% rule at list price ($3k rent vs $300k).
- Cap rate 7.7% vs local median 3.0% in Orlando — top-decile yield for the area; either an underpriced asset or a hidden risk that comps aren't pricing in. Stress-test before assuming the spread holds.
Location & tenants
- Location reads 86/100 on livability (#12 in FL, #360 nationally) — a professional / high-income tenant draw. Strengths: amenities A+, commute A+, housing A+.
- Orange (suburban): math 46% / reading 51% proficiency, ranked #43 of 73 in FL (top 59%) — families likely to look elsewhere, expect single-tenant / working-renter base with shorter leases.
- Market conditions: Rents rising (+2.6%/yr); 180 active listings in the ZIP; 27 comparable units currently listed for rent nearby; rentals leasing fast (median 4d on market — plan ~1-2 weeks tenant-placement turnaround); solid renter incomes; 8,053 units permitted in Orange County in 2024 (3,133 in 5+ unit buildings).
- This rent runs 35% of the median local income ($108k/yr) — at the standard rent-burdened threshold; future hikes will face affordability resistance.
Forward outlook
- Local home prices are declining (-3.0%/yr); year-one equity from $2k of loan paydown is wiped out by about $9k of value loss. Plan a longer hold.
- Orange County population projected at +52% by 2050 — long-run rental-demand tailwind backs the buy-and-hold thesis.
Negotiation context
- Only 4 days on market — expect competitive offers; lowballing is unlikely to land.
Risks & watch-outs
- Climate carrying-cost: severe wind risk, 99% chance of damaging wind over 30y; extreme-heat days projected 7→23/yr by 2055 (HVAC capex compounding) — expect insurance premiums to compound above CPI over the hold.
Questions for the listing agent
- Built in 1960 — when were the roof, HVAC, electrical panel, plumbing, and water heater last replaced?
- Is there a deadline driving the sale (1031 exchange, divorce, estate, relocation)? That informs how much negotiation room exists.
- Schools are B-rated — typically a magnet for longer-tenancy family renters. What's the average tenant stay here, and is there a school-zone premium baked into asking?
- What's the average days-on-market for RENTAL listings here right now (not sales)? A rising rental-DOM trend means longer vacancies and softer asking-rent achievability than the comps imply.
- What's the recent tenant-quality profile in this submarket — average credit score on applications, eviction rate, late-payment / NSF rate, and stable-employment percentage? A property-management company in the area should have these aggregated.
- How much new for-sale + rental construction is in the pipeline within 1–3 miles? Heavy new supply typically softens prices + rents 12–24 months out; constrained supply supports both.
Investment metrics
- 1% rule
- 1.04% ✓
- Cap rate
- 7.68%
- Cash-on-cash
- 4.94%
- DSCR
- 1.22
- GRM
- 8.0
CMA / ARV
No comps found within radius.
Projected returns pro-forma
-3.0% appreciation · 2.64% rent growth · sell at horizon
- IRR
- -9.0%
- Equity multiple
- 0.67×
- Total profit
- $-27,628
- Equity at exit
- $44,716
- IRR
- 0.0%
- Equity multiple
- 1.00×
- Total profit
- $18
- Equity at exit
- $25,930
Cash invested: $83,972 (down + closing). Projections, not guarantees.
Landlord ↔ Tenant lean methodology
- Overall (STATE)
- 87 Strongly Landlord-Friendly
- State Florida
- 87 Strongly Landlord-Friendly · R+3
- County
- — inherits STATE
- City
- — inherits STATE
ZIP-level market 32803
- Rents YoY
- 2.6%
- Active inventory
- 180
- Price-to-rent
- 8.0×
Monthly cashflow live
- Estimated rent
- $3,128 high interval (Pro) →
- Mortgage (P&I)
- −$1,573
- Tax from tax record
- −$428 /mo · $5,134/yr
- Insurance
- −$125
- HOA
- −$0
- Vacancy / Maint / Mgmt
- −$657
- Net cashflow
- $346
Break-even live
UW: 25.0% down · 7.5% · 30yr · 1.5% tax · 5.0% vac · 8.0% maint · 8.0% mgmt
Financing live
Cash to close
- Down payment
- $74,975
- Closing costs
- $8,997
- Reserves months
- —
- Total cash needed
- —
Loan-product check · same deal, 3 products live
Conventional
25% down · 7.5% · 30yr
- Down + closing
- —
- Monthly P&I
- —
- Monthly cashflow
- —
- DSCR
- —
- Eligible?
- —
Personal DTI + credit; lowest rate.
DSCR
20% down · 8.5% · 30yr
- Down + closing
- —
- Monthly P&I
- —
- Monthly cashflow
- —
- DSCR
- —
- Eligible?
- —
No personal income docs; deal must DSCR.
Hard money
10% down · 12.0% · 12mo
- Down + closing
- —
- Monthly P&I
- —
- Monthly cashflow
- —
- DSCR
- —
- Eligible?
- —
Short-term bridge; refi at stabilization.
Rent comps 27 comps
| Address | Beds | Baths | Sqft | Rent | $/sqft | DOM | Units | Dist |
|---|---|---|---|---|---|---|---|---|
| 2618 E Central Blvd Orlando, FL | 3.0 | 2.5 | 1604 | $2,900 | $1.81 | 3d | 1 | 0.25mi |
| 2611 E Jefferson St #4 Orlando, FL | 3.0 | 2.5 | 1700 | $2,800 | $1.65 | 7d | 1 | 0.31mi |
| 3225 Pickfair St Unit 1470318P Orlando, FL | 3.0 | 2.0 | 1689 | $5,915 | $3.50 | 3d | 1 | 0.60mi |
| 2165 Ridgewood St Orlando, FL | 3.0 | 2.5 | 1910 | $3,395 | $1.78 | 2d | 1 | 0.62mi |
| 544 N Bumby Ave Unit 5 Orlando, FL | 3.0 | 3.0 | 1807 | $4,095 | $2.27 | 23d | 1 | 0.72mi |
| 2316 E Concord St #9 Orlando, FL | 3.0 | 3.0 | 1727 | $3,495 | $2.02 | 23d | 1 | 0.72mi |
| 1900 E Jefferson St Orlando, FL | 3.0 | 2.0 | 1602 | $2,800 | $1.75 | 11d | 1 | 0.74mi |
| 2314 Buckminster Cir Orlando, FL | 3.0 | 1.0 | 1214 | $2,500 | $2.06 | 4d | 1 | 0.80mi |
| 4004 Lake Underhill Rd Orlando, FL | 1.0–3.0 | 1.0–2.0 | 891 | $2,625 | $2.94 | 1d | 15 | 0.86mi |
| 2517 E Marks St Orlando, FL | 3.0 | 2.0 | 1696 | $2,490 | $1.47 | 4d | 1 | 1.01mi |
| 1406 E Ridgewood St Orlando, FL | 3.0 | 2.0 | 1200 | $2,800 | $2.33 | 2d | 1 | 1.06mi |
| 4416 Jamerson Pl Orlando, FL | 4.0 | 2.0 | 1763 | $3,200 | $1.82 | 17d | 1 | 1.08mi |
| 825 McCullough Ave Orlando, FL | 1.0–3.0 | 1.0–2.0 | 1136 | $3,150 | $2.77 | 1d | 14 | 1.08mi |
| 1504 Mount Vernon St Orlando, FL | 3.0 | 2.0 | 1981 | $3,195 | $1.61 | 3d | 1 | 1.10mi |
| 990 Warehouse Rd Orlando, FL | 1.0–3.0 | 1.0–2.0 | 1064 | $2,958 | $2.78 | 1d | 36 | 1.12mi |
| 1212 S Bumby Ave Orlando, FL | 3.0 | 2.5 | 1945 | $2,850 | $1.47 | 21d | 1 | 1.15mi |
| 21 N Mills Ave Orlando, FL | 3.0 | 1.0 | 1382 | $2,250 | $1.63 | 21d | 1 | 1.15mi |
| 820 Altaloma Ave Orlando, FL | 3.0 | 3.0 | 2200 | $2,900 | $1.32 | 23d | 1 | 1.22mi |
| 1513 Woodward St Orlando, FL | 3.0 | 2.5 | 1542 | $2,950 | $1.91 | 23d | 1 | 1.24mi |
| 4401 Lenmore St #1 Orlando, FL | 4.0 | 2.0 | 1375 | $3,600 | $2.62 | 23d | 1 | 1.28mi |
| 1033 N Hampton Ave Orlando, FL | 3.0 | 2.0 | 1402 | $2,995 | $2.14 | 7d | 1 | 1.33mi |
| 823 La Salle Ave Orlando, FL | 3.0 | 3.0 | 1350 | $3,950 | $2.93 | 3d | 1 | 1.33mi |
| 1501 Berwyn Rd Orlando, FL | 3.0 | 2.0 | 1223 | $2,331 | $1.91 | 21d | 1 | 1.35mi |
| 4220 New Broad St Orlando, FL | 3.0 | 1.0–2.0 | 1030 | $3,274 | $3.18 | 1d | 17 | 1.41mi |
| 3700 Curry Ford Rd Orlando, FL | 3.0 | 1.0–2.0 | 830 | $1,939 | $2.34 | 2d | 29 | 1.46mi |
| 2102 Montana St Orlando, FL | 3.0 | 2.0 | 1371 | $2,350 | $1.71 | 16d | 1 | 1.47mi |
| 612 E Church St Orlando, FL | 3.0 | 2.5 | 1764 | $2,795 | $1.58 | 2d | 1 | 1.49mi |
Listing history 4 events
-
2026-06-02remarks 699-char remark
-
2026-06-02statusdays on market $299,900 Pending 4 DOM
-
2026-06-01days on market $299,900 Active 3 DOM
-
2026-05-31days on market $299,900 Active 2 DOM
ⓘ Source: listings_history table (triggers on properties + properties_extension) + one-shot
backfill from property_details.listing_events for pre-trigger history.
Tax reassessment forecast FL · Resets to sale price
- Current annual tax
- $5,134 · $428/mo
- Projected year-2 tax
- $5,134 · $428/mo
- Expected delta
- $0/yr ($0/mo · 0.0%)
ⓘ Screening estimate from a state-policy table — verify with the county assessor before closing.
Climate risk First Street
- Flood 1/10 Low FEMA zone X (unshaded) · 0% chance over 30 yrs
- Wildfire 1/10 Low
- Heat 9/10 Extreme 7 d/yr ≥107°F today · 23 d/yr by 30 yrs out
- Wind 9/10 Extreme 99% chance of damaging wind over 30 yrs
- Air quality 2/10 Low 1 unhealthy d/yr today · 1 by 30 yrs out
Nearby sold comps map
Loading sold comps map…
Walkable amenities ~0.75 mi
Loading nearby amenities…
Taxation est. · year 1
- Rental income
- $37,537
- − Mortgage interest
- −$16,799
- − Property taxes
- −$5,134
- − Insurance
- −$1,500
- − Repairs & maintenance
- −$3,003
- − Management
- −$3,003
- − Depreciation
- −$8,724
- Taxable loss
- −$626
- Est. tax savings @ 24.0%
- +$150
- After-tax cash flow
- $4,299/yr
For passive investors: Depreciation is non-cash, so a rental often shows a tax loss while cash-flowing — sheltering income. Rental losses are passive: they offset passive income freely, and up to $25,000/yr can offset ordinary (W-2) income if you actively participate and your MAGI is under $100k (phasing out to $0 by $150k); unused losses carry forward. On sale, claimed depreciation is recaptured at up to 25%, and gains may owe capital-gains tax (a 1031 exchange can defer both). Figures are a year-1 estimate at your 24.0% rate — not tax advice; consult a CPA.
Schools (NCES district)
- District
- Orange
- NCES district ID
- 1201440
- Math proficiency
- 46% ▼ -9.00%
- Reading proficiency
- 51% ▼ -2.00%
- Median HH income
- $49,350
- Composite
- 41.47/100
- National rank
- #3461
- State rank
- #43 of 73 in FL
Livability — Orlando
- Score
- 86/100
- State rank
- #12
- US rank
- #360
Category grades
Schools grade is shown separately in the Schools card above.
Census & demographics
- Census place
- Orlando, FL
- County
- Orange County · 1,471,359 people
- City population
- 964,969
- Metro
- Orlando-Kissimmee-Sanford, FL
- Population (ZIP)
- 22,152
- Household income
- $107,592
- Rent vs Own
- Severe rent burden
- 793.0
Population outlook (Orange County) Hauer SSP2
- Today (2025)
- 1,618,226 people
- By 2030
- 1,787,404 · +10.5%
- By 2040
- 2,125,621 · +31.4%
- By 2050
- 2,454,016 · +51.6%
- By 2075
- 3,173,711 · +96.1%
- By 2100
- 3,607,781 · +122.9%
Race, ethnicity, and origin ACS 2023
- Neighborhood character
- Predominantly White (69%)
- Race & ethnicity
- White 69% Hispanic / Latino 17% Two or more races 13% Asian 5% Black 4%
- Hispanic origin (detail)
- Mexican 2% Puerto Rican 7% Cuban 2%
- Common ancestry
- Romanian 3% Slovak 3% Italian 2%
- Foreign-born
- 8% · Canada, Dominican Republic, Vietnam
- Languages at home
- 85% English-only · Spanish 10% Other Indo-European 1% Tagalog/Filipino 1%
Political lean MEDSL · Orange
- 2024 margin
- D (+13.6) · D 56.1% · R 42.5% · Other 1.3%
- 2008→2024 swing
- -5.0pp toward R · 2008: 18.6pp · 2024: 13.6pp
- All cycles
- 2024: D+13.6 2020: D+23.1 2016: D+24.6 2012: D+18.2 2008: D+18.6
Not yet ingested
- Civics
- —
Market trends
- HPI YoY
- ▼ -505.52%
- Current HPI
- 303.0942
- Rent YoY
- ▲ 2.64%
- Metro
- Orlando-Kissimmee-Sanford, FL
- State GDP YoY
- ▲ 3.28%
- F500 in state
- 36
Industry mix (Fortune 500 HQ in FL)
| Industry | F500 HQs | Revenue |
|---|---|---|
| Industrial Technology | 2 | $29B |
|
||
| Insurance | 2 | $17B |
|
||
| Retail | 1 | $60B |
|
||
| Technology Distribution | 1 | $58B |
|
||
| Homebuilding | 1 | $35B |
|
||
| Technology Manufacturing | 1 | $35B |
|
||
Price history
+19893.3% since first listed3 events — show timeline
- 2026-05-29 Price Changed $299,900 Stellar MLS as Distributed by MLS Grid
- 2026-05-29 Listed $399,900 Stellar MLS as Distributed by MLS Grid
- 2022-08-05 Price Changed $1,500 RENT.
Property tax history
+10.2%/yrLatest (2025): $5,134 · +7.9% YoY. Source: county tax records.
Cash-flow waterfall
monthlySold comps — $/sqft
last 12 mo · ≤1 miLoading sold comps…