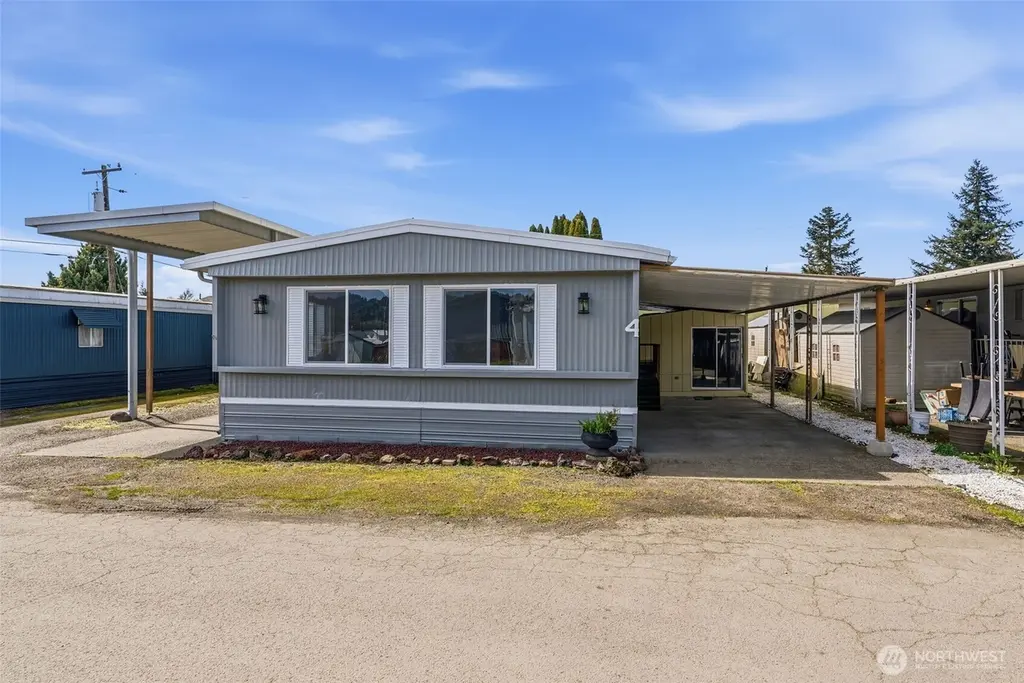
507 Colorado St #4 · Kelso, WA
Flood risk 1/10 · Minimal
- FEMA flood zone
- X
- Chance of flooding over 30 yrs
- 0.0%
- Est. flood insurance / yr
- $507 – $1,088
Fire risk 3/10 · Minor
- Est. fire insurance / yr
- $604 – $1,122
Heat risk 3/10 · Minor
- Hot days now (above 88°F)
- 7 days/yr
- Hot days in 30 yrs
- 15 days/yr
Wind risk 1/10 · Minimal
- Chance of severe wind over 30 yrs
- —
Air-quality risk 7/10 · Major
- Unhealthy air days now
- 9 days/yr
- Unhealthy air days in 30 yrs
- 10 days/yr
Risk factors via First Street. Map © Google.
Why this score? — see what drove the B- grade
The composite is a weighted blend of 9 inputs, each scored 0–100. Each bar is that input's sub-score; the figure is the points it added to the 100-point composite (weight × sub-score).
- Cash flow +30.0/30.0
- DSCR +10.0/10.0
- ARV discount +7.5/15.0
- 1% rule +7.4/10.0
- Schools +4.0/10.0
- Rent growth +3.5/5.0
- Livability +3.2/5.0
- Condition / age +2.5/5.0
- Appreciation +0.0/10.0
$99,500
🖨 Deal sheet (PDF) 📄 Offer letter ✓ Due diligence
Listing remarks
Newly remodeled manufactured home in Longview, Washington. This home offers 1,152 sq. ft. with 2 beds and 1.75 baths. Interior upgrades include: New Carpet in the Bedrooms, Luxury Vinyl Plank in the Bathrooms and Waterproof Laminate throughout. Additional features include Updated Vinyl Windows, Newer Heat Pump for AC and Heat, Interior Doors, Trim, and Cabinet Hardware, Baseboards, Light Fixtures, Fresh Paint. On the exterior of the Home there are Two Separate Carports. One traditional Carport and a Second Covered Area. There is a Storage Shed with Power to it that is Newer and Clean. The home has recently been painted on t he outside as well. Space Rent is Very Affordable; currently at $72
Key facts
- 4,070 sq ft lot
- Built 1972
- Listed 75 days
Neighborhood map
What this means for you Summary
Snapshot
- This is a 2-bed/2.0-bath manufactured listed at $100k.
Deal economics
- At list price, monthly cash flow is $379 ($5k/yr) — positive.
- The deal already cash-flows at list — no discount required.
- Meets the 1% rule at list price ($1k rent vs $100k).
- Recommended offer: $94k (6.0% below list) — sets the bar for market timing.
- Cap rate 10.9% vs local median 3.4% in Kelso — top-decile yield for the area; either an underpriced asset or a hidden risk that comps aren't pricing in. Stress-test before assuming the spread holds.
Location & tenants
- Location reads 65/100 on livability (#324 in WA) — a middle-class / working-renter tenant base. Strengths: housing A+, cost of living A-; Watch: health & safety C-, amenities F, commute F.
- Kelso School District (suburban): math 35% / reading 53% proficiency, ranked #191 of 291 in WA (top 66%) — families likely to look elsewhere, expect single-tenant / working-renter base with shorter leases.
- Zoned schools: Wallace Elementary (342 students, 88% FRL); Coweeman Middle School (570 students, 64% FRL); Kelso High School (1,424 students, 61% FRL) — zoned schools average 71% FRL vs 50% district-wide (21 pts higher); higher-poverty schools than district average — tighter screening recommended.
- Market conditions: Rents rising fast (+4.1%/yr); 219 active listings in the ZIP; 2 comparable units currently listed for rent nearby; solid renter incomes; 348 units permitted in Cowlitz County in 2024 (40 in 5+ unit buildings).
Forward outlook
- Local home prices are declining (-3.0%/yr); year-one equity from $688 of loan paydown is wiped out by about $3k of value loss. Plan a longer hold.
- Cowlitz County population projected to shrink 8% by 2050 — rents likely to lag national; underwrite the cash flow, not the appreciation.
- At projected returns (-3.0% appreciation + 4.1% rent growth), your $28k cash investment doubles in ~7 years — after that, you're playing with house money.
Negotiation context
- It's been on market 75 days — a 6% lower offer ($94k) is reasonable based on typical stale-listing flexibility.
- Current owner paid $24k; list at $100k implies a 323% gain — meaningful room to come down on a strong offer.
Questions for the listing agent
- It's been on market 75 days. Have you received any prior offers? Is the seller open to a 6% concession, seller financing, or rate buy-down credit?
- Built in 1972 — when were the roof, HVAC, electrical panel, plumbing, and water heater last replaced?
- Why hasn't it sold? Are there any deal-killer items the seller is aware of (foundation, flood, title, zoning, code violations)?
- Is there a deadline driving the sale (1031 exchange, divorce, estate, relocation)? That informs how much negotiation room exists.
- Schools are D-rated, which usually means shorter tenancies and higher turnover. Who's the typical renter profile here, and what's been the actual vacancy rate?
- What's the average days-on-market for RENTAL listings here right now (not sales)? A rising rental-DOM trend means longer vacancies and softer asking-rent achievability than the comps imply.
- What's the recent tenant-quality profile in this submarket — average credit score on applications, eviction rate, late-payment / NSF rate, and stable-employment percentage? A property-management company in the area should have these aggregated.
- How much new for-sale + rental construction is in the pipeline within 1–3 miles? Heavy new supply typically softens prices + rents 12–24 months out; constrained supply supports both.
Investment metrics
- 1% rule
- 1.24% ✓
- Cap rate
- 10.86%
- Cash-on-cash
- 16.32%
- DSCR
- 1.73
- GRM
- 6.7
CMA / ARV
- ARV (median comp)
- $369,611
- List price
- $99,500
- Delta
- -73.08%
- Verdict
- UNDERPRICED
- Comps
- 2 within 1.0 mi
Show comp detail 2 sales within ~0.75 mi
| Address | Dist | Beds/Ba | Sqft | Sold | Price | $/sf | Match |
|---|---|---|---|---|---|---|---|
| 308 Hawthorne St | 0.42mi | 2/2.0 | 1,200 (+4%) | 21mo | $300,000 | $250 | 56 |
| 245 Haussler Rd | 0.75mi | 3/2.0 (+1) | 1,306 (+13%) | 15mo | $379,900 | $291 | 25 |
Match score weights: distance 35% · size 25% · config 20% · recency 20%. Top-matched comps best support the ARV.
Projected returns pro-forma
-3.0% appreciation · 4.1% rent growth · sell at horizon
- IRR
- 8.5%
- Equity multiple
- 1.34×
- Total profit
- $9,355
- Equity at exit
- $14,836
- IRR
- 18.5%
- Equity multiple
- 2.61×
- Total profit
- $44,859
- Equity at exit
- $8,603
Cash invested: $27,860 (down + closing). Projections, not guarantees.
Landlord ↔ Tenant lean methodology
- Overall (STATE)
- 28 Tenant-Leaning
- State Washington
- 28 Tenant-Leaning · D+8
- County
- — inherits STATE
- City
- — inherits STATE
ZIP-level market 98626
- Rents YoY
- 4.1%
- Active inventory
- 219
- Price-to-rent
- 6.7×
Monthly cashflow live
- Estimated rent
- $1,233 medium interval (Pro) →
- Mortgage (P&I)
- −$522
- Tax from tax record
- −$32 /mo · $380/yr
- Insurance
- −$41
- HOA
- −$0
- Lot rent leased land?
- −$0
- Vacancy / Maint / Mgmt
- −$259
- Net cashflow
- $379
Break-even live
Sensitivity live
| Price | -10% $435 | -5% $407 | +0% $379 | +5% $351 | +10% $323 |
|---|---|---|---|---|---|
| Rent | -10% $282 | -5% $330 | +0% $379 | +5% $428 | +10% $476 |
| Rate | -1.0pp $429 | -0.5pp $404 | base $379 | +0.5pp $353 | +1.0pp $327 |
UW: 25.0% down · 7.5% · 30yr · 1.5% tax · 5.0% vac · 8.0% maint · 8.0% mgmt
Financing live
Cash to close
- Down payment
- $24,875
- Closing costs
- $2,985
- Reserves months
- —
- Total cash needed
- —
Loan-product check · same deal, 3 products live
Conventional
25% down · 7.5% · 30yr
- Down + closing
- —
- Monthly P&I
- —
- Monthly cashflow
- —
- DSCR
- —
- Eligible?
- —
Personal DTI + credit; lowest rate.
DSCR
20% down · 8.5% · 30yr
- Down + closing
- —
- Monthly P&I
- —
- Monthly cashflow
- —
- DSCR
- —
- Eligible?
- —
No personal income docs; deal must DSCR.
Hard money
10% down · 12.0% · 12mo
- Down + closing
- —
- Monthly P&I
- —
- Monthly cashflow
- —
- DSCR
- —
- Eligible?
- —
Short-term bridge; refi at stabilization.
Rent comps 2 comps
| Address | Beds | Baths | Sqft | Rent | $/sqft | DOM | Units | Dist |
|---|---|---|---|---|---|---|---|---|
| 910 Elizabeth St Kelso, WA | 3.0 | 1.0 | 1075 | $1,625 | $1.51 | 46d | 1 | 0.90mi |
| 909 Pacific Ave S Kelso, WA | 2.0 | 1.0 | 750 | $1,525 | $2.03 | 1d | 4 | 1.19mi |
Listing history 21 events
-
2026-06-21days on market $99,500 Active 75 DOM
-
2026-06-19days on market $99,500 Active 73 DOM
-
2026-06-18days on market $99,500 Active 72 DOM
-
2026-06-17days on market $99,500 Active 71 DOM
-
2026-06-16days on market $99,500 Active 70 DOM
-
2026-06-15days on market $99,500 Active 69 DOM
-
2026-06-14days on market $99,500 Active 67 DOM
-
2026-06-13days on market $99,500 Active 66 DOM
-
2026-06-10days on market $99,500 Active 64 DOM
-
2026-06-09days on market $99,500 Active 63 DOM
-
2026-06-08days on market $99,500 Active 62 DOM
-
2026-06-07days on market $99,500 Active 61 DOM
-
2026-06-03days on market $99,500 Active 57 DOM
-
2026-06-02days on market $99,500 Active 56 DOM
-
2026-06-01days on market $99,500 Active 55 DOM
-
2026-06-01price $99,500 Active 54 DOM
-
2026-05-31days on market $110,000 Active 54 DOM
-
2026-05-30days on market $110,000 Active 53 DOM
-
2026-05-12price $110,000
-
2026-04-07$115,000 Active
-
1992-02-04soldstatus $23,500
ⓘ Source: listings_history table (triggers on properties + properties_extension) + one-shot
backfill from property_details.listing_events for pre-trigger history.
Tax reassessment forecast WA · Resets to sale price
- Current annual tax
- $380 · $32/mo
- Projected year-2 tax
- $975 · $81/mo
- Expected delta
- +$595/yr (+$50/mo · 156.3%)
ⓘ Screening estimate from a state-policy table — verify with the county assessor before closing.
Climate risk First Street
- Flood 1/10 Low FEMA zone X · 0% chance over 30 yrs
- Wildfire 3/10 Moderate
- Heat 3/10 Moderate 7 d/yr ≥88°F today · 15 d/yr by 30 yrs out
- Wind 1/10 Low
- Air quality 7/10 Severe 9 unhealthy d/yr today · 10 by 30 yrs out
Nearby sold comps map
Loading sold comps map…
Walkable amenities ~0.75 mi
Loading nearby amenities…
Taxation est. · year 1
- Rental income
- $14,794
- − Mortgage interest
- −$5,574
- − Property taxes
- −$380
- − Insurance
- −$498
- − Repairs & maintenance
- −$1,184
- − Management
- −$1,184
- − Depreciation
- −$2,895
- Taxable income
- $3,081
- Est. tax owed @ 24.0%
- −$739
- After-tax cash flow
- $3,808/yr
For passive investors: Depreciation is non-cash, so a rental often shows a tax loss while cash-flowing — sheltering income. Rental losses are passive: they offset passive income freely, and up to $25,000/yr can offset ordinary (W-2) income if you actively participate and your MAGI is under $100k (phasing out to $0 by $150k); unused losses carry forward. On sale, claimed depreciation is recaptured at up to 25%, and gains may owe capital-gains tax (a 1031 exchange can defer both). Figures are a year-1 estimate at your 24.0% rate — not tax advice; consult a CPA.
Schools (NCES district)
- District
- Kelso School District
- NCES district ID
- 5300003
- Math proficiency
- 35% ▼ -2.00%
- Reading proficiency
- 53% ▼ -1.00%
- Median HH income
- $47,840
- Composite
- 39.83/100
- National rank
- #7963
- State rank
- #191 of 291 in WA
Livability — Kelso
- Score
- 65/100
- State rank
- #324
- US rank
- #12232
Category grades
Schools grade is shown separately in the Schools card above.
Census & demographics
- Census place
- Kelso, WA
- County
- Cowlitz County · 77,527 people
- City population
- 26,892
- Metro
- Longview, WA
- Population (ZIP)
- 26,892
- Household income
- $75,528
- Rent vs Own
- Severe rent burden
- 722.0
Population outlook (Cowlitz County) Hauer SSP2
- Today (2025)
- 104,780 people
- By 2030
- 103,980 · -0.8%
- By 2040
- 100,769 · -3.8%
- By 2050
- 96,685 · -7.7%
- By 2075
- 86,454 · -17.5%
- By 2100
- 74,052 · -29.3%
Race, ethnicity, and origin ACS 2023
- Neighborhood character
- Predominantly White (85%)
- Race & ethnicity
- White 85% Hispanic / Latino 7% Two or more races 7% Native American 2% Asian 1%
- Hispanic origin (detail)
- Mexican 5%
- Common ancestry
- Portuguese 5% Slovak 4% Italian 3%
- Foreign-born
- 3% · Canada
- Languages at home
- 95% English-only · Spanish 3% Tagalog/Filipino 1%
Political lean MEDSL · Cowlitz
- 2024 margin
- R (+19.9) · D 38.7% · R 58.6% · Other 2.7%
- 2008→2024 swing
- -31.1pp toward R · 2008: 11.2pp · 2024: -19.9pp
- All cycles
- 2024: R+19.9 2020: R+17.4 2016: R+13.7 2012: D+4.4 2008: D+11.2
Not yet ingested
- Civics
- —
Market trends
- HPI YoY
- ▼ -321.36%
- Current HPI
- 262.8196
- Rent YoY
- ▲ 4.10%
- Metro
- Longview, WA
- State GDP YoY
- ▲ 4.65%
- F500 in state
- 22
Industry mix (Fortune 500 HQ in WA)
| Industry | F500 HQs | Revenue |
|---|---|---|
| Retail | 2 | $269B |
|
||
| Technology / Retail | 1 | $638B |
|
||
| Technology | 1 | $245B |
|
||
| Telecommunications | 1 | $38B |
|
||
| Food / Beverage | 1 | $36B |
|
||
| Automotive / Trucks | 1 | $34B |
|
||
Price history
+368.1% since first listed3 events — show timeline
- 2026-05-12 Price Changed $110,000 NWMLS as Distributed by MLS Grid
- 2026-04-07 Listed $115,000 NWMLS as Distributed by MLS Grid
- 1992-02-04 Sold (Public Records) $23,500 Public Records
Property tax history
+20.8%/yrLatest (2026): $380 · +543.1% YoY. Source: county tax records.
Cash-flow waterfall
monthlySold comps — $/sqft
last 12 mo · ≤1 miLoading sold comps…