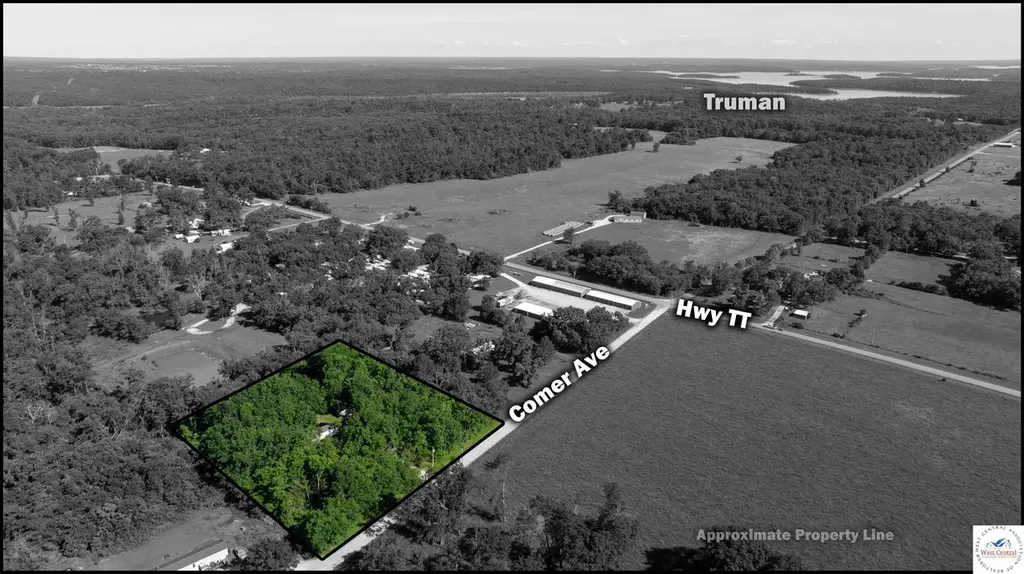
23358 Comer Ave · Warsaw, MO
Flood risk 1/10 · Minimal
- FEMA flood zone
- X (unshaded)
- Chance of flooding over 30 yrs
- 0.0%
- Est. flood insurance / yr
- $507 – $1,088
Fire risk 4/10 · Minor
- Est. fire insurance / yr
- $1,054 – $1,958
Heat risk 4/10 · Minor
- Hot days now (above 109°F)
- 7 days/yr
- Hot days in 30 yrs
- 18 days/yr
Wind risk 2/10 · Minimal
- Chance of severe wind over 30 yrs
- 1.0%
Air-quality risk 1/10 · Minimal
- Unhealthy air days now
- 0 days/yr
- Unhealthy air days in 30 yrs
- 0 days/yr
Risk factors via First Street. Map © Google.
Why this score? — see what drove the B+ grade
The composite is a weighted blend of 9 inputs, each scored 0–100. Each bar is that input's sub-score; the figure is the points it added to the 100-point composite (weight × sub-score).
- Cash flow +30.0/30.0
- 1% rule +10.0/10.0
- DSCR +10.0/10.0
- Appreciation +7.7/10.0
- ARV discount +7.5/15.0
- Schools +3.8/10.0
- Livability +3.2/5.0
- Rent growth +2.5/5.0
- Condition / age +2.5/5.0
$69,900
🖨 Deal sheet (PDF) 📄 Offer letter ✓ Due diligence
Listing remarks
2.5-Acre Property with Excellent Location Near Truman Lake! This 3-bedroom Warsaw home is situated on a spacious acreage lot, offering a fantastic layout for anyone looking to be near the water. The property is a blank canvas ready for updates and your personal touch. The true highlight is the phenomenal access to local recreation. The Bledsoe Ferry Public Boat Launch and Drake Harbor Concrete Boat Ramp are both a short drive away, putting premier boating and fishing right at your fingertips. If you're looking for acreage with incredible potential near the area's best boat launches, this is a must-see!
Key facts
- 2.5 acre property
- 2.5 acre lot
- Built 2011
Tags
Property features AI
Exterior
- Parking: No garage
- Utilities: Shared well water; Septic tank sewer; 220-volt electric service
- Home design: Manufactured house (single wide); Residential single-family property; One-story
- Construction: Metal siding; Composition roof; Built as a manufactured home
- Exterior features: Deck
Interior
- Flooring: Laminate
- Bathrooms: 1 full bathroom
- Heating & cooling: Forced air heating; Electric heating
- Interior features: Drapes; Laminate flooring; Electric water heater
Neighborhood map
What this means for you Summary
Snapshot
- This is a 3-bed/1.0-bath manufactured listed at $70k.
Deal economics
- At list price, monthly cash flow is $563 ($7k/yr) — positive.
- The deal already cash-flows at list — no discount required.
- Meets the 1% rule at list price ($1k rent vs $70k).
- Recommended offer: $69k (1.5% below list) — sets the bar for market timing.
- Cap rate 16.0% vs local median 3.4% in Warsaw — top-decile yield for the area; either an underpriced asset or a hidden risk that comps aren't pricing in. Stress-test before assuming the spread holds.
Location & tenants
- Location reads 63/100 on livability (#332 in MO) — a middle-class / working-renter tenant base. Strengths: cost of living A+, housing A+; Watch: crime D-, amenities F, commute F.
- Lincoln R-II (rural): math 43% / reading 50% proficiency, ranked #91 of 324 in MO (top 28%) — families likely to look elsewhere, expect single-tenant / working-renter base with shorter leases.
- Zoned schools: Lincoln Elem. (math 47% / reading 52%, grade D, #284 of 1,115 statewide, top 30%, 260 students, 60% FRL); Lincoln High (math 37% / reading 47%, grade F, #218 of 521 statewide, top 45%, 253 students, 54% FRL) — zoned schools at 57% FRL track the district average.
- Market conditions: 275 active listings in the ZIP; 9 units permitted in Benton County in 2024 (0 in 5+ unit buildings).
Forward outlook
- In year one you build about $4k of equity ($483 loan paydown + $4k appreciation (5.5% local appreciation)).
- Benton County population projected at -21% by 2050 — secular population decline; favor cash flow + early exit over multi-decade hold.
- At projected returns (5.5% appreciation + 3.0% rent growth), your $20k cash investment doubles in ~2 years — after that, you're playing with house money.
- By year 8, paydown + projected appreciation supports a ~$33k cash-out refi (75% LTV) — recoverable capital for the next deal without selling this one.
Negotiation context
- It's been on market 26 days — a 2% lower offer ($69k) is reasonable based on typical stale-listing flexibility.
Questions for the listing agent
- Is there a deadline driving the sale (1031 exchange, divorce, estate, relocation)? That informs how much negotiation room exists.
- Schools are F-rated, which usually means shorter tenancies and higher turnover. Who's the typical renter profile here, and what's been the actual vacancy rate?
- Crime grade is D in this area — have there been break-ins, vandalism, or insurance claims at this property in the last 3 years? What carrier currently insures it and at what premium?
- What's the average days-on-market for RENTAL listings here right now (not sales)? A rising rental-DOM trend means longer vacancies and softer asking-rent achievability than the comps imply.
- What's the recent tenant-quality profile in this submarket — average credit score on applications, eviction rate, late-payment / NSF rate, and stable-employment percentage? A property-management company in the area should have these aggregated.
- How much new for-sale + rental construction is in the pipeline within 1–3 miles? Heavy new supply typically softens prices + rents 12–24 months out; constrained supply supports both.
Investment metrics
- 1% rule
- 1.76% ✓
- Cap rate
- 15.96%
- Cash-on-cash
- 34.51%
- DSCR
- 2.54
- GRM
- 4.7
CMA / ARV
No comps found within radius.
Projected returns pro-forma
5.45% appreciation · 3.0% rent growth · sell at horizon
- IRR
- 44.0%
- Equity multiple
- 3.75×
- Total profit
- $53,748
- Equity at exit
- $41,537
- IRR
- 41.5%
- Equity multiple
- 7.68×
- Total profit
- $130,646
- Equity at exit
- $73,333
Cash invested: $19,572 (down + closing). Projections, not guarantees.
Landlord ↔ Tenant lean methodology
- Overall (STATE)
- 81 Strongly Landlord-Friendly
- State Missouri
- 81 Strongly Landlord-Friendly · R+10
- County
- — inherits STATE
- City
- — inherits STATE
ZIP-level market 65355
- Home prices YoY
- 2.4%
- Active inventory
- 275
- Price-to-rent
- 4.7×
Monthly cashflow live
- Estimated rent
- $1,233 medium interval (Pro) →
- Mortgage (P&I)
- −$367
- Tax from tax record
- −$15 /mo · $183/yr
- Insurance
- −$29
- HOA
- −$0
- Vacancy / Maint / Mgmt
- −$259
- Net cashflow
- $563
Break-even live
Sensitivity live
| Price | -10% $602 | -5% $583 | +0% $563 | +5% $543 | +10% $523 |
|---|---|---|---|---|---|
| Rent | -10% $466 | -5% $514 | +0% $563 | +5% $612 | +10% $660 |
| Rate | -1.0pp $598 | -0.5pp $581 | base $563 | +0.5pp $545 | +1.0pp $526 |
UW: 25.0% down · 7.5% · 30yr · 1.5% tax · 5.0% vac · 8.0% maint · 8.0% mgmt
Financing live
Cash to close
- Down payment
- $17,475
- Closing costs
- $2,097
- Reserves months
- —
- Total cash needed
- —
Loan-product check · same deal, 3 products live
Conventional
25% down · 7.5% · 30yr
- Down + closing
- —
- Monthly P&I
- —
- Monthly cashflow
- —
- DSCR
- —
- Eligible?
- —
Personal DTI + credit; lowest rate.
DSCR
20% down · 8.5% · 30yr
- Down + closing
- —
- Monthly P&I
- —
- Monthly cashflow
- —
- DSCR
- —
- Eligible?
- —
No personal income docs; deal must DSCR.
Hard money
10% down · 12.0% · 12mo
- Down + closing
- —
- Monthly P&I
- —
- Monthly cashflow
- —
- DSCR
- —
- Eligible?
- —
Short-term bridge; refi at stabilization.
Listing history 18 events
-
2026-06-21days on market $69,900 Active 26 DOM
-
2026-06-21days on market $69,900 Active 25 DOM
-
2026-06-18days on market $69,900 Active 23 DOM
-
2026-06-17days on market $69,900 Active 22 DOM
-
2026-06-16days on market $69,900 Active 21 DOM
-
2026-06-15days on market $69,900 Active 20 DOM
-
2026-06-13days on market $69,900 Active 18 DOM
-
2026-06-12days on market $69,900 Active 17 DOM
-
2026-06-09days on market $69,900 Active 14 DOM
-
2026-06-08days on market $69,900 Active 13 DOM
-
2026-06-07days on market $69,900 Active 12 DOM
-
2026-06-07days on market $69,900 Active 11 DOM
-
2026-06-04days on market $69,900 Active 8 DOM
-
2026-06-02days on market $69,900 Active 7 DOM
-
2026-06-01days on market $69,900 Active 6 DOM
-
2026-05-31days on market $69,900 Active 5 DOM
-
2026-05-26$69,900 Active
-
2003-04-01soldstatus
ⓘ Source: listings_history table (triggers on properties + properties_extension) + one-shot
backfill from property_details.listing_events for pre-trigger history.
Tax reassessment forecast MO · Resets to sale price
- Current annual tax
- $183 · $15/mo
- Projected year-2 tax
- $678 · $57/mo
- Expected delta
- +$495/yr (+$41/mo · 270.4%)
ⓘ Screening estimate from a state-policy table — verify with the county assessor before closing.
Climate risk First Street
- Flood 1/10 Low FEMA zone X (unshaded) · 0% chance over 30 yrs
- Wildfire 4/10 Moderate
- Heat 4/10 Moderate 7 d/yr ≥109°F today · 18 d/yr by 30 yrs out
- Wind 2/10 Low 100% chance of damaging wind over 30 yrs
- Air quality 1/10 Low 0 unhealthy d/yr today · 0 by 30 yrs out
Nearby sold comps map
Loading sold comps map…
Walkable amenities ~0.75 mi
Loading nearby amenities…
Taxation est. · year 1
- Rental income
- $14,793
- − Mortgage interest
- −$3,915
- − Property taxes
- −$183
- − Insurance
- −$350
- − Repairs & maintenance
- −$1,183
- − Management
- −$1,183
- − Depreciation
- −$2,033
- Taxable income
- $5,944
- Est. tax owed @ 24.0%
- −$1,427
- After-tax cash flow
- $5,328/yr
For passive investors: Depreciation is non-cash, so a rental often shows a tax loss while cash-flowing — sheltering income. Rental losses are passive: they offset passive income freely, and up to $25,000/yr can offset ordinary (W-2) income if you actively participate and your MAGI is under $100k (phasing out to $0 by $150k); unused losses carry forward. On sale, claimed depreciation is recaptured at up to 25%, and gains may owe capital-gains tax (a 1031 exchange can defer both). Figures are a year-1 estimate at your 24.0% rate — not tax advice; consult a CPA.
Schools (NCES district)
- District
- Lincoln R-II
- NCES district ID
- 2918670
- Math proficiency
- 43% ▼ -4.00%
- Reading proficiency
- 50% ▲ 8.00%
- Median HH income
- $35,713
- Composite
- 38.49/100
- National rank
- #4182
- State rank
- #91 of 324 in MO
Livability — Warsaw
- Score
- 63/100
- State rank
- #332
- US rank
- #15201
Category grades
Schools grade is shown separately in the Schools card above.
Census & demographics
- Population (ZIP)
- 11,029
Population outlook (Benton County) Hauer SSP2
- Today (2025)
- 17,355 people
- By 2030
- 16,513 · -4.9%
- By 2040
- 14,898 · -14.2%
- By 2050
- 13,662 · -21.3%
- By 2075
- 11,308 · -34.8%
- By 2100
- 8,755 · -49.6%
Race, ethnicity, and origin ACS 2023
- Neighborhood character
- Predominantly White (92%)
- Race & ethnicity
- White 92% Two or more races 6% Hispanic / Latino 2% Native American 1%
- Common ancestry
- Slovak 3% Italian 2% Iranian 2%
- Foreign-born
- 1% · Canada
Political lean MEDSL · Benton
- 2024 margin
- Solid R (+59.1) · D 20.1% · R 79.2%
- 2008→2024 swing
- -36.8pp toward R · 2008: -22.3pp · 2024: -59.1pp
- All cycles
- 2024: R+59.1 2020: R+56.6 2016: R+54.1 2012: R+34.3 2008: R+22.3
Not yet ingested
- Civics
- —
Market trends
- HPI YoY
- ▲ 5.45%
- Current HPI
- 232.6924
- Rent YoY
- —
- Metro
- —
- State GDP YoY
- ▲ 1.84%
- F500 in state
- 20
Industry mix (Fortune 500 HQ in MO)
| Industry | F500 HQs | Revenue |
|---|---|---|
| Healthcare | 1 | $163B |
|
||
| Insurance | 1 | $21B |
|
||
| Industrial Technology | 1 | $17B |
|
||
| Retail | 1 | $16B |
|
||
| Industrial Distribution | 1 | $10B |
|
||
| Utilities | 1 | $9B |
|
||
Price history
2 events — show timeline
- 2026-05-26 Listed $69,900 WCAR
- 2003-04-01 Sold (Public Records) — Public Records
Property tax history
+35.1%/yrLatest (2025): $183 · -2.4% YoY. Source: county tax records.
Cash-flow waterfall
monthlySold comps — $/sqft
last 12 mo · ≤1 miLoading sold comps…