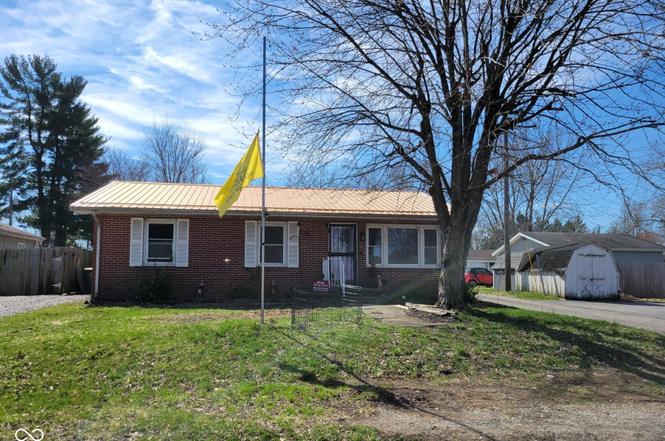
500 E 14th St · Seymour, IN
Flood risk 1/10 · Minimal
- FEMA flood zone
- X (unshaded)
- Chance of flooding over 30 yrs
- 0.0%
- Est. flood insurance / yr
- $507 – $1,088
Fire risk 1/10 · Minimal
- Est. fire insurance / yr
- $717 – $1,331
Heat risk 4/10 · Minor
- Hot days now (above 103°F)
- 7 days/yr
- Hot days in 30 yrs
- 19 days/yr
Wind risk 2/10 · Minimal
- Chance of severe wind over 30 yrs
- 2.0%
Air-quality risk 1/10 · Minimal
- Unhealthy air days now
- 0 days/yr
- Unhealthy air days in 30 yrs
- 0 days/yr
Risk factors via First Street. Map © Google.
Why this score? — see what drove the C+ grade
The composite is a weighted blend of 9 inputs, each scored 0–100. Each bar is that input's sub-score; the figure is the points it added to the 100-point composite (weight × sub-score).
- Cash flow +24.9/30.0
- ARV discount +15.0/15.0
- DSCR +8.1/10.0
- 1% rule +5.8/10.0
- Livability +3.4/5.0
- Schools +2.6/10.0
- Rent growth +2.5/5.0
- Condition / age +2.5/5.0
- Appreciation +0.0/10.0
$109,000
🖨 Deal sheet 📄 Offer letter ✓ Due diligence
Listing remarks MLS
Cute brick ranch. 3 beds, 1 bath, 2 car detached garage. Partial privacy fenced backyard, matching fencing to complete the yard is stored in the garage and will stay with the home. Beautiful hardwood floors! Possible 100% financing available for qualified buyers! Home warranty included with acceptable offer! Low utility bills! NO need to rent any longer!
Key facts
- Fenced yard
- Quiet street corner
- 7,100 sq ft lot
Tags
Neighborhood map
What this means for you Summary
Snapshot
- This is a 2-bed/1.0-bath single-family listed at $109k.
Deal economics
- At list price, monthly cash flow is $235 ($3k/yr) — positive.
- The deal already cash-flows at list — no discount required.
- Meets the 1% rule at list price ($1k rent vs $109k).
- Recommended offer: $102k (6.0% below list) — sets the bar for market timing.
- Cap rate 8.9% vs local median 3.5% in Seymour — top-decile yield for the area; either an underpriced asset or a hidden risk that comps aren't pricing in. Stress-test before assuming the spread holds.
Location & tenants
- Location reads 68/100 on livability (#211 in IN) — a middle-class / working-renter tenant base. Strengths: crime A+, cost of living A+, housing A+; Watch: employment D+, health & safety D, amenities F.
- Seymour Community Schools (town): math 27% / reading 33% proficiency, ranked #239 of 301 in IN (top 79%) — families likely to look elsewhere, expect single-tenant / working-renter base with shorter leases.
- Zoned schools: Seymour Senior High School (math 29% / reading 55%, grade F, #197 of 369 statewide, top 57%, 1,690 students, 57% FRL).
- Zoned-school proficiency averages 42% at this address vs 30% district-wide (+12 pts) — the actual schools serving this property are materially stronger than the Seymour Community Schools average implies; a family-tenant draw the district grade alone would hide.
- Market conditions: 245 active listings in the ZIP; 101 units permitted in Jackson County in 2024 (0 in 5+ unit buildings).
Forward outlook
- Local home prices are declining (-3.0%/yr); year-one equity from $754 of loan paydown is wiped out by about $3k of value loss. Plan a longer hold.
- Jackson County population projected at +7% by 2050 — modest demand growth; plan on rents tracking national, not racing it.
Negotiation context
- It's been on market 81 days — a 6% lower offer ($102k) is reasonable based on typical stale-listing flexibility.
- 3 sale attempts since 17y ago with the ask held roughly flat each time — persistent listings suggest the price (not the market) is what's stuck; bring a comps-based counter.
Risks & watch-outs
- Watch-outs: built in 1950 — expect roof / HVAC / electrical / plumbing capex.
Questions for the listing agent
- It's been on market 81 days. Have you received any prior offers? Is the seller open to a 6% concession, seller financing, or rate buy-down credit?
- Built in 1950 — when were the roof, HVAC, electrical panel, plumbing, and water heater last replaced?
- Why hasn't it sold? Are there any deal-killer items the seller is aware of (foundation, flood, title, zoning, code violations)?
- Is there a deadline driving the sale (1031 exchange, divorce, estate, relocation)? That informs how much negotiation room exists.
- What's the average days-on-market for RENTAL listings here right now (not sales)? A rising rental-DOM trend means longer vacancies and softer asking-rent achievability than the comps imply.
- What's the recent tenant-quality profile in this submarket — average credit score on applications, eviction rate, late-payment / NSF rate, and stable-employment percentage? A property-management company in the area should have these aggregated.
- How much new for-sale + rental construction is in the pipeline within 1–3 miles? Heavy new supply typically softens prices + rents 12–24 months out; constrained supply supports both.
Investment metrics
- 1% rule
- 1.08% ✓
- Cap rate
- 8.87%
- Cash-on-cash
- 9.22%
- DSCR
- 1.41
- GRM
- 7.7
CMA / ARV
- ARV (on-the-fly)
- $186,200
- Comps found
- 12
Show comp detail 12 sales within ~0.75 mi
| Address | Dist | Beds/Ba | Sqft | Sold | Price | $/sf | Match |
|---|---|---|---|---|---|---|---|
| 422 Skaggs Ct | 0.10mi | 3/1.0 (+1) | 1,038 (-2%) | 2mo | $194,900 | $188 | 84 |
| 425 Skaggs Ct | 0.13mi | 3/1.0 (+1) | 1,010 (-5%) | 1mo | $198,000 | $196 | 79 |
| 1417 Martin Ct | 0.09mi | 3/2.0 (+1) | 1,162 (+9%) | 4mo | $175,000 | $151 | 68 |
| 1815 1/2 N Ewing St | 0.67mi | 3/1.0 (+1) | 1,056 (-1%) | 0mo | $74,804 | $71 | 62 |
| 338 Redwood Dr | 0.16mi | 3/1.0 (+1) | 1,222 (+15%) | 7mo | $184,900 | $151 | 58 |
| 656 Berkshire Dr | 0.59mi | 3/1.0 (+1) | 1,008 (-5%) | 3mo | $193,800 | $192 | 56 |
| 611 Blish St | 0.55mi | 2/1.0 | 1,169 (+10%) | 6mo | $167,000 | $143 | 53 |
| 652 Berkshire Ct | 0.59mi | 3/1.0 (+1) | 1,008 (-5%) | 7mo | $98,000 | $97 | 53 |
| 650 Berkshire Ct | 0.59mi | 3/1.0 (+1) | 1,008 (-5%) | 9mo | $195,000 | $193 | 51 |
| 620 N Jackson Park Dr | 0.72mi | 3/1.5 (+1) | 1,118 (+5%) | 1mo | $196,000 | $175 | 50 |
| 737 Brookhaven Dr | 0.64mi | 3/1.0 (+1) | 925 (-13%) | 2mo | $174,900 | $189 | 42 |
| 724 Brookhaven Dr | 0.63mi | 3/1.0 (+1) | 925 (-13%) | 3mo | $152,000 | $164 | 41 |
Match score weights: distance 35% · size 25% · config 20% · recency 20%. Top-matched comps best support the ARV.
Projected returns pro-forma
-3.0% appreciation · 3.0% rent growth · sell at horizon
- IRR
- -2.4%
- Equity multiple
- 0.91×
- Total profit
- $-2,746
- Equity at exit
- $16,252
- IRR
- 7.3%
- Equity multiple
- 1.55×
- Total profit
- $16,761
- Equity at exit
- $9,424
Cash invested: $30,520 (down + closing). Projections, not guarantees.
Landlord ↔ Tenant lean methodology
- Overall (STATE)
- 90 Strongly Landlord-Friendly
- State Indiana
- 90 Strongly Landlord-Friendly · R+11
- County
- — inherits STATE
- City
- — inherits STATE
ZIP-level market 47274
- Active inventory
- 245
- Price-to-rent
- 7.7×
Monthly cashflow live
- Estimated rent
- $1,173 medium interval (Pro) →
- Mortgage (P&I)
- −$572
- Tax from tax record
- −$75 /mo · $904/yr
- Insurance
- −$45
- HOA
- −$0
- Vacancy / Maint / Mgmt
- −$246
- Net cashflow
- $235
Break-even live
UW: 25.0% down · 7.5% · 30yr · 1.5% tax · 5.0% vac · 8.0% maint · 8.0% mgmt
Financing live
Cash to close
- Down payment
- $27,250
- Closing costs
- $3,270
- Reserves months
- —
- Total cash needed
- —
Loan-product check · same deal, 3 products live
Conventional
25% down · 7.5% · 30yr
- Down + closing
- —
- Monthly P&I
- —
- Monthly cashflow
- —
- DSCR
- —
- Eligible?
- —
Personal DTI + credit; lowest rate.
DSCR
20% down · 8.5% · 30yr
- Down + closing
- —
- Monthly P&I
- —
- Monthly cashflow
- —
- DSCR
- —
- Eligible?
- —
No personal income docs; deal must DSCR.
Hard money
10% down · 12.0% · 12mo
- Down + closing
- —
- Monthly P&I
- —
- Monthly cashflow
- —
- DSCR
- —
- Eligible?
- —
Short-term bridge; refi at stabilization.
Listing history 7 events
-
2025-06-06status Pending
-
2025-03-17$109,000 Active
-
2018-06-29soldstatus $95,000 360-char remark
Show marketing remark (360 chars)
Cute brick ranch. 3 beds, 1 bath, 2 car detached garage. Partial privacy fenced backyard, matching fencing to complete the yard is stored in the garage and will stay with the home. Beautiful hardwood floors! Possible 100% financing available for qualified buyers! Home warranty included with acceptable offer! Low utility bills! NO need to rent any longer!
-
2018-05-16$103,000 360-char remark
Show marketing remark (360 chars)
Cute brick ranch. 3 beds, 1 bath, 2 car detached garage. Partial privacy fenced backyard, matching fencing to complete the yard is stored in the garage and will stay with the home. Beautiful hardwood floors! Possible 100% financing available for qualified buyers! Home warranty included with acceptable offer! Low utility bills! NO need to rent any longer!
-
2009-09-22soldstatus $70,000 144-char remark
Show marketing remark (144 chars)
Cozy three bedroom, one bath home near the golf course. Located on a quiet street on corner lot. Two car detached garage for your many projects.
-
2009-09-22soldstatus $70,000
Show marketing remark (144 chars)
Cozy three bedroom, one bath home near the golf course. Located on a quiet street on corner lot. Two car detached garage for your many projects.
-
2009-06-21$78,900 144-char remark
Show marketing remark (144 chars)
Cozy three bedroom, one bath home near the golf course. Located on a quiet street on corner lot. Two car detached garage for your many projects.
ⓘ Source: listings_history table (triggers on properties + properties_extension) + one-shot
backfill from property_details.listing_events for pre-trigger history.
Tax reassessment forecast IN · Partial reset (capped growth)
- Current annual tax
- $904 · $75/mo
- Projected year-2 tax
- $915 · $76/mo
- Expected delta
- +$11/yr (+$1/mo · 1.3%)
ⓘ Screening estimate from a state-policy table — verify with the county assessor before closing.
Climate risk First Street
- Flood 1/10 Low FEMA zone X (unshaded) · 0% chance over 30 yrs
- Wildfire 1/10 Low
- Heat 4/10 Moderate 7 d/yr ≥103°F today · 19 d/yr by 30 yrs out
- Wind 2/10 Low 2% chance of damaging wind over 30 yrs
- Air quality 1/10 Low 0 unhealthy d/yr today · 0 by 30 yrs out
Nearby sold comps map
Loading sold comps map…
Walkable amenities ~0.75 mi
Loading nearby amenities…
Taxation est. · year 1
- Rental income
- $14,079
- − Mortgage interest
- −$6,106
- − Property taxes
- −$904
- − Insurance
- −$545
- − Repairs & maintenance
- −$1,126
- − Management
- −$1,126
- − Depreciation
- −$3,171
- Taxable income
- $1,101
- Est. tax owed @ 24.0%
- −$264
- After-tax cash flow
- $2,550/yr
For passive investors: Depreciation is non-cash, so a rental often shows a tax loss while cash-flowing — sheltering income. Rental losses are passive: they offset passive income freely, and up to $25,000/yr can offset ordinary (W-2) income if you actively participate and your MAGI is under $100k (phasing out to $0 by $150k); unused losses carry forward. On sale, claimed depreciation is recaptured at up to 25%, and gains may owe capital-gains tax (a 1031 exchange can defer both). Figures are a year-1 estimate at your 24.0% rate — not tax advice; consult a CPA.
Schools (NCES district)
- District
- Seymour Community Schools
- NCES district ID
- 1810080
- Math proficiency
- 27% ▼ -10.00%
- Reading proficiency
- 33% ▼ -9.00%
- Median HH income
- $46,122
- Composite
- 25.81/100
- National rank
- #7362
- State rank
- #239 of 301 in IN
Livability — Seymour
- Score
- 68/100
- State rank
- #211
- US rank
- #9328
Category grades
Schools grade is shown separately in the Schools card above.
Census & demographics
- Census place
- Seymour, IN
- County
- Jackson County · 33,068 people
- City population
- 33,068
- Metro
- Seymour, IN
- Population (ZIP)
- 33,068
- Household income
- $71,457
- Rent vs Own
- Severe rent burden
- 453.0
Population outlook (Jackson County) Hauer SSP2
- Today (2025)
- 46,376 people
- By 2030
- 47,344 · +2.1%
- By 2040
- 48,936 · +5.5%
- By 2050
- 49,738 · +7.2%
- By 2075
- 50,435 · +8.8%
- By 2100
- 46,321 · -0.1%
Race, ethnicity, and origin ACS 2023
- Neighborhood character
- Predominantly White (74%)
- Race & ethnicity
- White 74% Hispanic / Latino 18% Two or more races 12% Asian 3% Black 1% Native American 1%
- Hispanic origin (detail)
- Mexican 10% Puerto Rican 2%
- Common ancestry
- Slovak 2% Romanian 2% Iranian 1%
- Foreign-born
- 11% · Canada
- Languages at home
- 85% English-only · Spanish 12% Other Asian/Pacific 2% Other Indo-European 1%
Political lean MEDSL · Jackson
- 2024 margin
- Solid R (+55.3) · D 21.5% · R 76.8% · Other 1.7%
- 2008→2024 swing
- -41.6pp toward R · 2008: -13.7pp · 2024: -55.3pp
- All cycles
- 2024: R+55.3 2020: R+53.3 2016: R+51.4 2012: R+27.4 2008: R+13.7
Not yet ingested
- Civics
- —
Market trends
- HPI YoY
- ▼ -146.47%
- Current HPI
- 211.9507
- Rent YoY
- —
- Metro
- Seymour, IN
- State GDP YoY
- ▲ 2.90%
- F500 in state
- 18
Industry mix (Fortune 500 HQ in IN)
| Industry | F500 HQs | Revenue |
|---|---|---|
| Industrial Machinery | 2 | $37B |
|
||
| Healthcare | 1 | $177B |
|
||
| Pharmaceuticals | 1 | $45B |
|
||
| Metals / Steel | 1 | $18B |
|
||
| Agriculture | 1 | $17B |
|
||
| Packaging | 1 | $12B |
|
||
Price history
+38.1% since first listed7 events — show timeline
- 2025-06-06 Pending — MIBOR as Distributed by MLS Grid
- 2025-03-17 Listed $109,000 MIBOR as Distributed by MLS Grid
- 2018-06-29 Sold (MLS) $95,000 MIBOR as Distributed by MLS Grid
- 2018-05-16 Listed $103,000 MIBOR as Distributed by MLS Grid
- 2009-09-22 Sold (Public Records) $70,000 Public Records
- 2009-09-22 Sold (MLS) $70,000 MIBOR as Distributed by MLS Grid
- 2009-06-21 Listed $78,900 MIBOR as Distributed by MLS Grid
Property tax history
+8.2%/yrLatest (2024): $904 · -19.8% YoY. Source: county tax records.
Cash-flow waterfall
monthlySold comps — $/sqft
last 12 mo · ≤1 miLoading sold comps…