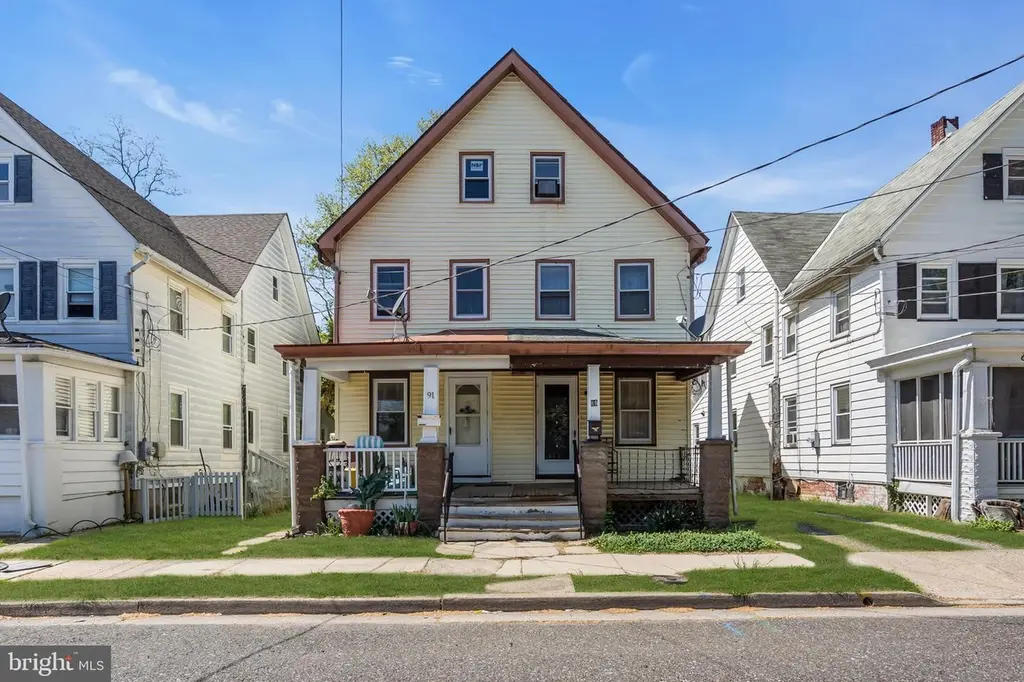
89 Chestnut St · Salem, NJ
Flood risk 8/10 · Major
- FEMA flood zone
- X (shaded)
- Chance of flooding over 30 yrs
- 0.98%
- Est. flood insurance / yr
- $507 – $1,088
Fire risk 2/10 · Minimal
- Est. fire insurance / yr
- $526 – $976
Heat risk 7/10 · Major
- Hot days now (above 103°F)
- 7 days/yr
- Hot days in 30 yrs
- 15 days/yr
Wind risk 6/10 · Moderate
- Chance of severe wind over 30 yrs
- 27.0%
Air-quality risk 3/10 · Minor
- Unhealthy air days now
- 2 days/yr
- Unhealthy air days in 30 yrs
- 4 days/yr
Risk factors via First Street. Map © Google.
Why this score? — see what drove the B+ grade
The composite is a weighted blend of 9 inputs, each scored 0–100. Each bar is that input's sub-score; the figure is the points it added to the 100-point composite (weight × sub-score).
- Cash flow +30.0/30.0
- ARV discount +15.0/15.0
- 1% rule +10.0/10.0
- DSCR +10.0/10.0
- Appreciation +4.8/10.0
- Livability +3.1/5.0
- Rent growth +2.5/5.0
- Condition / age +2.5/5.0
- Schools +1.2/10.0
$89,000
🖨 Deal sheet 📄 Offer letter ✓ Due diligence
Listing remarks MLS
This Home Is In Fair Condition With Some Newer Thermo Windows, Newer Vinyl Siding And A Heater Less Then 5Yrs Old. The House Is Being Sold As Is. Poss:Settlement
Key facts
- Built 1939
- Listed 54 days
Property features AI
Exterior
- Utilities: Public water; Public sewer
- Home design: Interior townhouse/rowhouse; Three floors in unit; Fee simple ownership
- Construction: Vinyl siding; Slab foundation; Above-grade structure
- Exterior features: No tidal water
Interior
- Bedrooms: Three bedrooms on the main level
- Bathrooms: One full bathroom on the main level
- Heating & cooling: Radiator heat; Natural gas heating; Hot water: Other
- Interior features: Estimated living area; Partial basement
Neighborhood map
What this means for you Summary
Snapshot
- This is a 3-bed/1.0-bath single-family listed at $89k.
Deal economics
- At list price, monthly cash flow is $505 ($6k/yr) — positive.
- The deal already cash-flows at list — no discount required.
- Meets the 1% rule at list price ($2k rent vs $89k).
- Recommended offer: $86k (3.0% below list) — sets the bar for market timing.
Location & tenants
- Location reads 61/100 on livability (#462 in NJ) — a middle-class / working-renter tenant base. Strengths: cost of living A+, health & safety A+, crime B; Watch: amenities F, commute F, employment F.
- Salem City School District (town): math 6% / reading 24% proficiency, ranked #464 of 472 in NJ (top 98%) — low school quality limits family demand, transient renter base, plan for 1-2y turnover; 85% free/reduced lunch — lower-income household profile, screen leases tightly.
- Zoned schools: Salem High School (math 17% / reading 37%, grade F, #312 of 399 statewide, top 79%, 420 students, 52% FRL) — zoned schools average 52% FRL vs 85% district-wide (33 pts lower); this property's tenant base skews higher-income than the district average.
- Zoned-school proficiency averages 27% at this address vs 15% district-wide (+12 pts) — the actual schools serving this property are materially stronger than the Salem City School District average implies; a family-tenant draw the district grade alone would hide.
- Market conditions: 100 active listings in the ZIP; 10 comparable units currently listed for rent nearby; rentals leasing fast (median 1d on market — plan ~1-2 weeks tenant-placement turnaround); 95 units permitted in Salem County in 2024 (0 in 5+ unit buildings).
Forward outlook
- In year one you build about $277 of equity ($615 loan paydown + $-338 appreciation (-0.4% local appreciation)).
- Salem County population projected at -23% by 2050 — secular population decline; favor cash flow + early exit over multi-decade hold.
- At projected returns (-0.4% appreciation + 3.0% rent growth), your $25k cash investment doubles in ~4 years — after that, you're playing with house money.
Negotiation context
- It's been on market 55 days — a 3% lower offer ($86k) is reasonable based on typical stale-listing flexibility.
- 2 sale attempts since 27y ago with the ask held roughly flat each time — persistent listings suggest the price (not the market) is what's stuck; bring a comps-based counter.
- Current owner paid $21k; list at $89k implies a 324% gain — meaningful room to come down on a strong offer.
Risks & watch-outs
- Watch-outs: flood insurance adds $66/mo; built in 1939 — expect roof / HVAC / electrical / plumbing capex.
- Climate carrying-cost: severe flood risk; major wind risk, 27% chance of damaging wind over 30y; extreme-heat days projected 7→15/yr by 2055 (HVAC capex compounding) — expect insurance premiums to compound above CPI over the hold.
Questions for the listing agent
- It's been on market 55 days. Have you received any prior offers? Is the seller open to a 3% concession, seller financing, or rate buy-down credit?
- Built in 1939 — when were the roof, HVAC, electrical panel, plumbing, and water heater last replaced?
- What's the actual annual flood-insurance premium (NFIP or private), and is the property in a SFHA with mandatory coverage?
- Is there a deadline driving the sale (1031 exchange, divorce, estate, relocation)? That informs how much negotiation room exists.
- Schools are D-rated, which usually means shorter tenancies and higher turnover. Who's the typical renter profile here, and what's been the actual vacancy rate?
- What's the average days-on-market for RENTAL listings here right now (not sales)? A rising rental-DOM trend means longer vacancies and softer asking-rent achievability than the comps imply.
- What's the recent tenant-quality profile in this submarket — average credit score on applications, eviction rate, late-payment / NSF rate, and stable-employment percentage? A property-management company in the area should have these aggregated.
- How much new for-sale + rental construction is in the pipeline within 1–3 miles? Heavy new supply typically softens prices + rents 12–24 months out; constrained supply supports both.
Investment metrics
- 1% rule
- 1.79% ✓
- Cap rate
- 13.99%
- Cash-on-cash
- 27.50%
- DSCR
- 2.22
- GRM
- 4.7
CMA / ARV
- ARV (on-the-fly)
- $174,816
- Comps found
- 12
Show comp detail 12 sales within ~0.75 mi
| Address | Dist | Beds/Ba | Sqft | Sold | Price | $/sf | Match |
|---|---|---|---|---|---|---|---|
| 304 New Market St | 0.11mi | 3/1.0 | 1,310 (+8%) | 4mo | $186,000 | $142 | 78 |
| 28 Chestnut St | 0.13mi | 3/1.0 | 1,152 (-5%) | 9mo | $118,000 | $102 | 78 |
| 115 Chestnut St | 0.07mi | 3/3.5 | 1,282 (+6%) | 8mo | $185,000 | $144 | 71 |
| 208 9th St | 0.46mi | 3/1.0 | 1,149 (-5%) | 1mo | $224,000 | $195 | 69 |
| 14 Yorke St | 0.68mi | 3/1.5 | 1,197 (-1%) | 1mo | $161,000 | $135 | 63 |
| 188 Cook Ave | 0.39mi | 4/2.0 (+1) | 1,260 (+4%) | 6mo | $210,000 | $167 | 61 |
| 197 Pine Ave | 0.51mi | 3/1.0 | 1,318 (+9%) | 2mo | $205,000 | $156 | 60 |
| 201 Chestnut St | 0.47mi | 3/1.0 | 1,308 (+8%) | 6mo | $128,500 | $98 | 60 |
| 51 S Third St | 0.26mi | 3/1.5 | 1,348 (+11%) | 9mo | $210,000 | $156 | 60 |
| 22 Davis Ave | 0.60mi | 3/1.0 | 1,158 (-5%) | 7mo | $185,000 | $160 | 58 |
| 410 Magnolia St | 0.63mi | 2/1.0 (-1) | 1,310 (+8%) | 1mo | $170,000 | $130 | 51 |
| 318 Fenwick Ave | 0.62mi | 3/1.0 | 1,344 (+11%) | 3mo | $191,250 | $142 | 51 |
Match score weights: distance 35% · size 25% · config 20% · recency 20%. Top-matched comps best support the ARV.
Projected returns pro-forma
-0.38% appreciation · 3.0% rent growth · sell at horizon
- IRR
- 23.7%
- Equity multiple
- 2.13×
- Total profit
- $28,062
- Equity at exit
- $24,164
- IRR
- 28.2%
- Equity multiple
- 4.06×
- Total profit
- $76,181
- Equity at exit
- $27,738
Cash invested: $24,920 (down + closing). Projections, not guarantees.
Landlord ↔ Tenant lean methodology
- Overall (STATE)
- 21 Tenant-Leaning
- State New Jersey
- 21 Tenant-Leaning · D+6
- County
- — inherits STATE
- City
- — inherits STATE
ZIP-level market 08079
- Home prices YoY
- -0.1%
- Active inventory
- 100
- Price-to-rent
- 4.7×
Monthly cashflow live
- Estimated rent
- $1,593 high interval (Pro) →
- Mortgage (P&I)
- −$467
- Tax from tax record
- −$183 /mo · $2,200/yr
- Insurance
- −$37
- Flood insurance flood zone
- −$66 /mo · $798/yr
- HOA
- −$0
- Vacancy / Maint / Mgmt
- −$334
- Net cashflow
- $505
Break-even live
UW: 25.0% down · 7.5% · 30yr · 1.5% tax · 5.0% vac · 8.0% maint · 8.0% mgmt
Financing live
Cash to close
- Down payment
- $22,250
- Closing costs
- $2,670
- Reserves months
- —
- Total cash needed
- —
Loan-product check · same deal, 3 products live
Conventional
25% down · 7.5% · 30yr
- Down + closing
- —
- Monthly P&I
- —
- Monthly cashflow
- —
- DSCR
- —
- Eligible?
- —
Personal DTI + credit; lowest rate.
DSCR
20% down · 8.5% · 30yr
- Down + closing
- —
- Monthly P&I
- —
- Monthly cashflow
- —
- DSCR
- —
- Eligible?
- —
No personal income docs; deal must DSCR.
Hard money
10% down · 12.0% · 12mo
- Down + closing
- —
- Monthly P&I
- —
- Monthly cashflow
- —
- DSCR
- —
- Eligible?
- —
Short-term bridge; refi at stabilization.
Rent comps 10 comps
| Address | Beds | Baths | Sqft | Rent | $/sqft | DOM | Units | Dist |
|---|---|---|---|---|---|---|---|---|
| 26 Walnut St Unit A Salem, NJ | 2.0 | 1.0 | 1000 | $1,225 | $1.23 | 1d | 1 | 0.24mi |
| 218 Sinnickson St Salem, NJ | 2.0 | 1.0 | 1008 | $1,500 | $1.49 | 1d | 1 | 0.27mi |
| 56 Olive St Salem, NJ | 2.0 | 1.0 | 700 | $1,200 | $1.71 | 1d | 1 | 0.37mi |
| 1 9th St Salem, NJ | 2.0 | 1.0 | 900 | $1,450 | $1.61 | 1d | 1 | 0.42mi |
| 242 Grant St Unit 1ST FLOOR Salem, NJ | 2.0 | 1.0 | 925 | $1,675 | $1.81 | 1d | 1 | 0.50mi |
| 380 E Broadway Salem, NJ | 2.0 | 1.0 | 1300 | $1,350 | $1.04 | 1d | 1 | 0.63mi |
| 37 Eighth St Salem, NJ | 3.0 | 1.0 | 1092 | $1,850 | $1.69 | 1d | 1 | 0.72mi |
| 23 7th St Unit B Salem, NJ | 3.0 | 1.0 | 1000 | $1,450 | $1.45 | 3d | 1 | 0.72mi |
| 124 Yorke St Unit 37 Salem, NJ | 2.0 | 1.0 | 1220 | $1,350 | $1.11 | 2d | 1 | 0.86mi |
| 124 Yorke St Unit 2BR Salem, NJ | 2.0 | 1.0 | 750 | $1,400 | $1.87 | 10d | 1 | 0.86mi |
Listing history 20 events
-
2026-06-18days on market $89,000 Active 55 DOM
-
2026-06-17days on market $89,000 Active 54 DOM
-
2026-06-16days on market $89,000 Active 53 DOM
-
2026-06-15days on market $89,000 Active 52 DOM
-
2026-06-13days on market $89,000 Active 50 DOM
-
2026-06-13days on market $89,000 Active 49 DOM
-
2026-06-09days on market $89,000 Active 46 DOM
-
2026-06-08days on market $89,000 Active 45 DOM
-
2026-06-07days on market $89,000 Active 44 DOM
-
2026-06-04days on market $89,000 Active 41 DOM
-
2026-06-03days on market $89,000 Active 40 DOM
-
2026-06-02days on market $89,000 Active 39 DOM
-
2026-06-01days on market $89,000 Active 38 DOM
-
2026-05-31days on market $89,000 Active 37 DOM
-
2026-04-25$89,000 Active
-
2026-04-21historical $89,000
-
1999-05-04soldstatus $21,000
-
1999-04-30soldstatus $21,000 161-char remark
Show marketing remark (161 chars)
This Home Is In Fair Condition With Some Newer Thermo Windows, Newer Vinyl Siding And A Heater Less Then 5Yrs Old. The House Is Being Sold As Is. Poss:Settlement
-
1999-03-30historical 161-char remark
Show marketing remark (161 chars)
This Home Is In Fair Condition With Some Newer Thermo Windows, Newer Vinyl Siding And A Heater Less Then 5Yrs Old. The House Is Being Sold As Is. Poss:Settlement
-
1999-03-01$21,000 161-char remark
Show marketing remark (161 chars)
This Home Is In Fair Condition With Some Newer Thermo Windows, Newer Vinyl Siding And A Heater Less Then 5Yrs Old. The House Is Being Sold As Is. Poss:Settlement
ⓘ Source: listings_history table (triggers on properties + properties_extension) + one-shot
backfill from property_details.listing_events for pre-trigger history.
Tax reassessment forecast NJ · Partial reset (capped growth)
- Current annual tax
- $2,200 · $183/mo
- Projected year-2 tax
- $2,208 · $184/mo
- Expected delta
- +$8/yr (+$1/mo · 0.4%)
ⓘ Screening estimate from a state-policy table — verify with the county assessor before closing.
Climate risk First Street
- Flood 8/10 Severe FEMA zone X (shaded) · 98% chance over 30 yrs
- Wildfire 2/10 Low
- Heat 7/10 Severe 7 d/yr ≥103°F today · 15 d/yr by 30 yrs out
- Wind 6/10 Major 27% chance of damaging wind over 30 yrs
- Air quality 3/10 Moderate 2 unhealthy d/yr today · 4 by 30 yrs out
Nearby sold comps map
Loading sold comps map…
Walkable amenities ~0.75 mi
Loading nearby amenities…
Taxation est. · year 1
- Rental income
- $19,111
- − Mortgage interest
- −$4,985
- − Property taxes
- −$2,200
- − Insurance
- −$1,242
- − Repairs & maintenance
- −$1,529
- − Management
- −$1,529
- − Depreciation
- −$2,589
- Taxable income
- $5,036
- Est. tax owed @ 24.0%
- −$1,209
- After-tax cash flow
- $4,846/yr
For passive investors: Depreciation is non-cash, so a rental often shows a tax loss while cash-flowing — sheltering income. Rental losses are passive: they offset passive income freely, and up to $25,000/yr can offset ordinary (W-2) income if you actively participate and your MAGI is under $100k (phasing out to $0 by $150k); unused losses carry forward. On sale, claimed depreciation is recaptured at up to 25%, and gains may owe capital-gains tax (a 1031 exchange can defer both). Figures are a year-1 estimate at your 24.0% rate — not tax advice; consult a CPA.
Schools (NCES district)
- District
- Salem City School District
- NCES district ID
- 3414550
- Math proficiency
- 6% ▼ -1.00%
- Reading proficiency
- 24% ▲ 2.00%
- Median HH income
- $27,118
- Composite
- 11.51/100
- National rank
- #9702
- State rank
- #464 of 472 in NJ
Livability — Salem
- Score
- 61/100
- State rank
- #462
- US rank
- #17533
Category grades
Schools grade is shown separately in the Schools card above.
Census & demographics
- Census place
- Salem, NJ
- County
- Salem County · 24,175 people
- City population
- 10,762
- Metro
- Philadelphia-Camden-Wilmington, PA-NJ-DE-MD
- Population (ZIP)
- 10,762
- Household income
- $54,641
- Rent vs Own
- Severe rent burden
- 663.0
Population outlook (Salem County) Hauer SSP2
- Today (2025)
- 59,905 people
- By 2030
- 57,351 · -4.3%
- By 2040
- 51,837 · -13.5%
- By 2050
- 46,356 · -22.6%
- By 2075
- 36,452 · -39.2%
- By 2100
- 28,907 · -51.7%
Race, ethnicity, and origin ACS 2023
- Neighborhood character
- Diverse neighborhood (Simpson 0.55)
- Race & ethnicity
- White 59% Black 31% Hispanic / Latino 6% Two or more races 5% Asian 1%
- Hispanic origin (detail)
- Puerto Rican 5%
- Common ancestry
- Romanian 3% Lithuanian 2% Italian 1%
- Foreign-born
- 2% · Canada
- Languages at home
- 94% English-only · Spanish 4% Tagalog/Filipino 1%
Political lean MEDSL · Salem
- 2024 margin
- R (+19.2) · D 39.6% · R 58.8% · Other 1.6%
- 2008→2024 swing
- -23.1pp toward R · 2008: 3.9pp · 2024: -19.2pp
- All cycles
- 2024: R+19.2 2020: R+12.8 2016: R+15.4 2012: D+0.8 2008: D+3.9
Not yet ingested
- Civics
- —
Market trends
- HPI YoY
- ▼ -0.38%
- Current HPI
- 258.0047
- Rent YoY
- —
- Metro
- Philadelphia-Camden-Wilmington, PA-NJ-DE-MD
- State GDP YoY
- ▲ 2.05%
- F500 in state
- 34
Industry mix (Fortune 500 HQ in NJ)
| Industry | F500 HQs | Revenue |
|---|---|---|
| Consumer Goods | 3 | $31B |
|
||
| Pharmaceuticals | 2 | $153B |
|
||
| Technology | 2 | $21B |
|
||
| Insurance | 2 | $20B |
|
||
| Healthcare | 2 | $19B |
|
||
| Financial Services | 1 | $70B |
|
||
Price history
+323.8% since first listed6 events — show timeline
- 2026-04-25 Listed $89,000 BRIGHT MLS
- 2026-04-21 Coming Soon $89,000 BRIGHT MLS
- 1999-05-04 Sold (Public Records) $21,000 Public Records
- 1999-04-30 Sold (MLS) $21,000 BRIGHT MLS
- 1999-03-30 Listing Removed — BRIGHT MLS
- 1999-03-01 Listed $21,000 BRIGHT MLS
Property tax history
+0.5%/yrLatest (2025): $2,200 · +4.9% YoY. Source: county tax records.
Cash-flow waterfall
monthlySold comps — $/sqft
last 12 mo · ≤1 miLoading sold comps…