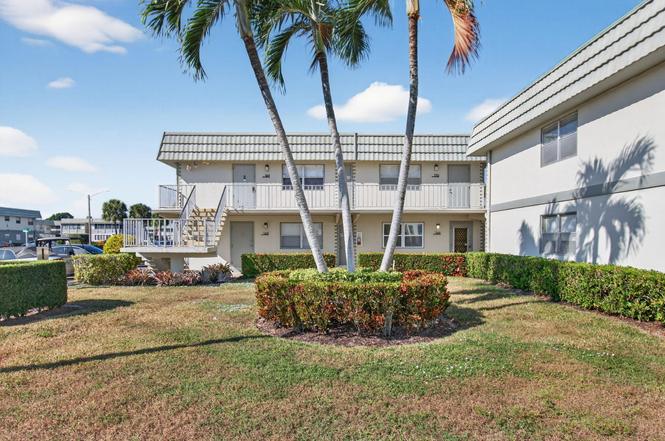
171 Monaco D · Delray Beach, FL
Flood risk 1/10 · Minimal
- FEMA flood zone
- X (unshaded)
- Chance of flooding over 30 yrs
- 0.0%
- Est. flood insurance / yr
- $507 – $1,088
Fire risk 1/10 · Minimal
- Est. fire insurance / yr
- $947 – $1,759
Heat risk 9/10 · Severe
- Hot days now (above 107°F)
- 7 days/yr
- Hot days in 30 yrs
- 23 days/yr
Wind risk 10/10 · Severe
- Chance of severe wind over 30 yrs
- 99.0%
Air-quality risk 2/10 · Minimal
- Unhealthy air days now
- 2 days/yr
- Unhealthy air days in 30 yrs
- 2 days/yr
Risk factors via First Street. Map © Google.
Why this score? — see what drove the B- grade
The composite is a weighted blend of 9 inputs, each scored 0–100. Each bar is that input's sub-score; the figure is the points it added to the 100-point composite (weight × sub-score).
- Cash flow +23.8/30.0
- 1% rule +10.0/10.0
- DSCR +7.7/10.0
- ARV discount +7.5/15.0
- Appreciation +5.3/10.0
- Schools +4.3/10.0
- Livability +3.9/5.0
- Rent growth +2.6/5.0
- Condition / age +2.5/5.0
$69,999
🖨 Deal sheet (PDF) 📄 Offer letter ✓ Due diligence
Listing remarks
BRAND NEW APPLIANCES. NEVER BEEN USED! Welcome to this charming residence located in the heart of Delray Beach at 171 Monaco Court, Unit D. Nestled within a well-maintained community, this home offers a bright and inviting layout with comfortable living and dining areas, perfect for relaxing or entertaining. Enjoy peaceful views and a serene atmosphere, just minutes from shopping, dining, and entertainment. Conveniently located near major roads and only a short drive to Delray Beach's vibrant downtown and beautiful beaches. Community amenities and lush surroundings enhance the South Florida lifestyle, making this property ideal as a primary residence, seasonal retreat, or investment opportu
Key facts
- Community amenities
- Lush surroundings
- $750 HOA
Tags
Property features AI
Finance
- Financial info: Pets allowed (breed restrictions and possible pet restrictions)
- HOA & community: Community amenities include clubhouse, fitness center, pool, tennis courts, and pickleball courts; Monthly HOA fee (reported): 750; HOA fee covers insurance, grounds maintenance, and trash
Exterior
- Parking: 2-car garage; 2 covered parking spaces; Garage parking
- Security: Gated community with guard; Security patrol
- Utilities: Public sewer; Cable available; Sewer available
- Home design: Condominium; Resale; 2 total stories; Faces west
- Construction: Built with block, brick, and concrete
- Exterior features: Not waterfront
Interior
- Kitchen: Dishwasher; Refrigerator
- Bedrooms: 1 bedroom on the main level
- Flooring: Vinyl flooring
- Bathrooms: 1 full bathroom; 1 half bathroom
- Heating & cooling: Has heating (type listed as Other); Central air conditioning
- Interior features: No notable interior features reported; Unfurnished
Neighborhood map
What this means for you Summary
Snapshot
- This is a 1-bed/1.5-bath condo listed at $70k.
Deal economics
- At list price, monthly cash flow is $134 ($2k/yr) — positive.
- The deal already cash-flows at list — no discount required.
- Meets the 1% rule at list price ($2k rent vs $70k).
- Recommended offer: $62k (12.0% below list) — sets the bar for market timing.
- Cap rate 8.6% vs local median 4.3% in Delray Beach — top-decile yield for the area; either an underpriced asset or a hidden risk that comps aren't pricing in. Stress-test before assuming the spread holds.
Location & tenants
- Location reads 77/100 on livability (#202 in FL, #3,160 nationally) — a middle-class / working-renter tenant base. Strengths: housing A+, health & safety A+, commute A-; Watch: cost of living C-, crime D-, amenities F.
- Palm Beach (suburban): math 46% / reading 53% proficiency, ranked #34 of 73 in FL (top 47%) — families likely to look elsewhere, expect single-tenant / working-renter base with shorter leases.
- Zoned schools: Orchard View Elementary School (math 48% / reading 47%, grade D, #1,182 of 2,144 statewide, top 55%, 596 students, 76% FRL); Carver Middle School (math 22% / reading 34%, grade F, #486 of 571 statewide, top 86%, 732 students, 73% FRL); Spanish River Community High School (math 64% / reading 74%, grade B, #63 of 667 statewide, top 10%, 2,578 students, 25% FRL).
- Market conditions: Rents flat; 584 active listings in the ZIP; 40 comparable units currently listed for rent nearby; rentals at typical pace (median 26d on market — plan ~3-4 weeks tenant-placement turnaround); solid renter incomes; 3,974 units permitted in Palm Beach County in 2024 (1,012 in 5+ unit buildings).
Forward outlook
- In year one you build about $965 of equity ($484 loan paydown + $481 appreciation (0.7% local appreciation)).
- Palm Beach County population projected at +30% by 2050 — long-run rental-demand tailwind backs the buy-and-hold thesis.
Negotiation context
- It's been on market 167 days — a 12% lower offer ($62k) is reasonable based on typical stale-listing flexibility.
- 6 sale attempts since 2y ago; this cycle's ask has dropped $19k (21%) from the opening price — seller is motivated, your offer sets the floor, not the list.
Risks & watch-outs
- Watch-outs: HOA is 43% of rent.
- Climate carrying-cost: severe wind risk, 99% chance of damaging wind over 30y; extreme-heat days projected 7→23/yr by 2055 (HVAC capex compounding) — expect insurance premiums to compound above CPI over the hold.
Questions for the listing agent
- It's been on market 167 days. Have you received any prior offers? Is the seller open to a 12% concession, seller financing, or rate buy-down credit?
- Built in 1974 — when were the roof, HVAC, electrical panel, plumbing, and water heater last replaced?
- What does the HOA fee cover, when was the last increase, and are there any pending special assessments or reserve-fund shortfalls?
- Any open or pending special assessments — roof, HVAC, plumbing, elevator, façade? What's the per-unit balance and payoff schedule, and is the seller paying it off at close or rolling it to the buyer?
- Why hasn't it sold? Are there any deal-killer items the seller is aware of (foundation, flood, title, zoning, code violations)?
- Is there a deadline driving the sale (1031 exchange, divorce, estate, relocation)? That informs how much negotiation room exists.
- Schools are B-rated — typically a magnet for longer-tenancy family renters. What's the average tenant stay here, and is there a school-zone premium baked into asking?
- Crime grade is D in this area — have there been break-ins, vandalism, or insurance claims at this property in the last 3 years? What carrier currently insures it and at what premium?
- What's the average days-on-market for RENTAL listings here right now (not sales)? A rising rental-DOM trend means longer vacancies and softer asking-rent achievability than the comps imply.
- What's the recent tenant-quality profile in this submarket — average credit score on applications, eviction rate, late-payment / NSF rate, and stable-employment percentage? A property-management company in the area should have these aggregated.
- How much new apartment / multifamily construction is in the pipeline within 1–3 miles? Heavy new supply (>2% of stock underway) typically softens rents 12–24 months out; light construction supports rent growth.
Investment metrics
- 1% rule
- 2.51% ✓
- Cap rate
- 8.59%
- Cash-on-cash
- 8.21%
- DSCR
- 1.37
- GRM
- 3.3
CMA / ARV
No comps found within radius.
Projected returns pro-forma
0.69% appreciation · 0.51% rent growth · sell at horizon
- IRR
- 5.3%
- Equity multiple
- 1.25×
- Total profit
- $4,987
- Equity at exit
- $22,763
- IRR
- 6.2%
- Equity multiple
- 1.64×
- Total profit
- $12,458
- Equity at exit
- $29,391
Cash invested: $19,600 (down + closing). Projections, not guarantees.
Landlord ↔ Tenant lean methodology
- Overall (STATE)
- 87 Strongly Landlord-Friendly
- State Florida
- 87 Strongly Landlord-Friendly · R+3
- County
- — inherits STATE
- City
- — inherits STATE
ZIP-level market 33446
- Home prices YoY
- 0.3%
- Rents YoY
- 0.5%
- Active inventory
- 584
- Price-to-rent
- 3.3×
Monthly cashflow live
- Estimated rent
- $1,756 high interval (Pro) →
- Mortgage (P&I)
- −$367
- Tax from tax record
- −$107 /mo · $1,281/yr
- Insurance
- −$29
- HOA
- −$750
- Vacancy / Maint / Mgmt
- −$369
- Net cashflow
- $134
Break-even live
Sensitivity live
| Price | -10% $174 | -5% $154 | +0% $134 | +5% $114 | +10% $94 |
|---|---|---|---|---|---|
| Rent | -10% $-5 | -5% $65 | +0% $134 | +5% $203 | +10% $273 |
| Rate | -1.0pp $169 | -0.5pp $152 | base $134 | +0.5pp $116 | +1.0pp $97 |
UW: 25.0% down · 7.5% · 30yr · 1.5% tax · 5.0% vac · 8.0% maint · 8.0% mgmt
Financing live
Cash to close
- Down payment
- $17,500
- Closing costs
- $2,100
- Reserves months
- —
- Total cash needed
- —
Loan-product check · same deal, 3 products live
Conventional
25% down · 7.5% · 30yr
- Down + closing
- —
- Monthly P&I
- —
- Monthly cashflow
- —
- DSCR
- —
- Eligible?
- —
Personal DTI + credit; lowest rate.
DSCR
20% down · 8.5% · 30yr
- Down + closing
- —
- Monthly P&I
- —
- Monthly cashflow
- —
- DSCR
- —
- Eligible?
- —
No personal income docs; deal must DSCR.
Hard money
10% down · 12.0% · 12mo
- Down + closing
- —
- Monthly P&I
- —
- Monthly cashflow
- —
- DSCR
- —
- Eligible?
- —
Short-term bridge; refi at stabilization.
Rent comps 40 comps
| Address | Beds | Baths | Sqft | Rent | $/sqft | DOM | Units | Dist |
|---|---|---|---|---|---|---|---|---|
| 153 Monaco D Delray Beach, FL | 2.0 | 2.0 | 880 | $1,750 | $1.99 | 18d | 1 | 0.04mi |
| 401 Monaco Way Unit 401 Delray Beach, FL | 2.0 | 2.0 | 920 | $1,950 | $2.12 | 26d | 1 | 0.05mi |
| 711 Monaco O Delray Beach, FL | 1.0 | 1.5 | 720 | $1,550 | $2.15 | 26d | 1 | 0.06mi |
| 459 Monaco Blvd Unit 459 Delray Beach, FL | 1.0 | 1.5 | 720 | $1,400 | $1.94 | 1d | 1 | 0.06mi |
| 581 Monaco Blvd Unit 581 Delray Beach, FL | 2.0 | 2.0 | 880 | $2,000 | $2.27 | 26d | 1 | 0.06mi |
| 451 Monaco Blvd Unit J Delray Beach, FL | 1.0 | 1.5 | 720 | $1,599 | $2.22 | 26d | 1 | 0.06mi |
| 399 Brittany I Delray Beach, FL | 1.0 | 1.5 | 720 | $1,450 | $2.01 | 20d | 1 | 0.06mi |
| 399 Brittany I Delray Beach, FL | 1.0 | 1.5 | 720 | $1,450 | $2.01 | 14d | 1 | 0.06mi |
| 482 Monaco Blvd #482 Delray Beach, FL | 1.0 | 1.5 | 726 | $1,400 | $1.93 | 26d | 1 | 0.06mi |
| 195 Monaco E Delray Beach, FL | 1.0 | 1.5 | 728 | $1,550 | $2.13 | 26d | 1 | 0.07mi |
| 569 Monaco L Delray Beach, FL | 2.0 | 2.0 | 880 | $1,500 | $1.70 | 26d | 1 | 0.10mi |
| 669 Monaco N Delray Beach, FL | 2.0 | 2.0 | 880 | $1,700 | $1.93 | 26d | 1 | 0.11mi |
| 459 Monaco J #459 Delray Beach, FL | 1.0 | 1.5 | 720 | $1,400 | $1.94 | 2d | 1 | 0.13mi |
| 58 Monaco Blvd Unit 58 Delray Beach, FL | 1.0 | 1.5 | 720 | $1,650 | $2.29 | 26d | 1 | 0.16mi |
| 72 Monaco Blvd Unit 72 Delray Beach, FL | 2.0 | 2.0 | 880 | $1,950 | $2.22 | 23d | 1 | 0.16mi |
| 276 Monaco F Delray Beach, FL | 2.0 | 2.0 | 883 | $1,650 | $1.87 | 26d | 1 | 0.16mi |
| 286 Monaco F Delray Beach, FL | 1.0 | 2.0 | 726 | $1,700 | $2.34 | 26d | 1 | 0.16mi |
| 318 Monaco G Delray Beach, FL | 2.0 | 2.0 | 907 | $2,200 | $2.43 | 26d | 1 | 0.16mi |
| 185 Valencia H Delray Beach, FL | 2.0 | 2.0 | 883 | $1,700 | $1.93 | 26d | 1 | 0.17mi |
| 175 Valencia H Delray Beach, FL | 1.0 | 1.5 | 726 | $1,500 | $2.07 | 9d | 1 | 0.17mi |
| 679 Saxony Way Delray Beach, FL | 1.0 | 1.5 | 720 | $1,600 | $2.22 | 7d | 1 | 0.17mi |
| 352 Saxony Trl Unit 352 Delray Beach, FL | 2.0 | 2.0 | 907 | $2,000 | $2.21 | 26d | 1 | 0.18mi |
| 23 Saxony a Delray Beach, FL | 1.0 | 1.5 | 726 | $1,300 | $1.79 | 9d | 1 | 0.19mi |
| 123 Saxony C Delray Beach, FL | 1.0 | 1.5 | 720 | $2,500 | $3.47 | 26d | 1 | 0.19mi |
| 445 Saxony Way #445 Delray Beach, FL | 2.0 | 2.0 | 883 | $1,550 | $1.76 | 26d | 1 | 0.19mi |
| 594 Saxony Trl Unit 594 Delray Beach, FL | 1.0 | 1.5 | 720 | $1,550 | $2.15 | 4d | 1 | 0.19mi |
| 189 Saxony Trl Unit 189 Delray Beach, FL | 2.0 | 2.0 | 880 | $1,475 | $1.68 | 23d | 1 | 0.19mi |
| 564 Saxony Dr #564 Delray Beach, FL | 2.0 | 2.0 | 880 | $2,200 | $2.50 | 6d | 1 | 0.19mi |
| 662 Saxony N Delray Beach, FL | 1.0 | 1.5 | 720 | $1,450 | $2.01 | 22d | 1 | 0.19mi |
| 516 Saxony K Delray Beach, FL | 2.0 | 2.0 | 880 | $1,450 | $1.65 | 26d | 1 | 0.19mi |
| 594 Saxony Trl Unit 594 Delray Beach, FL | 1.0 | 1.5 | 720 | $1,650 | $2.29 | 26d | 1 | 0.19mi |
| 370 Saxony H Delray Beach, FL | 1.0 | 1.5 | 726 | $1,500 | $2.07 | 7d | 1 | 0.21mi |
| 321 Saxony G Delray Beach, FL | 2.0 | 2.0 | 880 | $2,200 | $2.50 | 5d | 1 | 0.21mi |
| 468 Saxony J Delray Beach, FL | 2.0 | 2.0 | 907 | $1,850 | $2.04 | 26d | 1 | 0.21mi |
| 11 Brittany a Delray Beach, FL | 1.0 | 1.5 | 725 | $1,500 | $2.07 | 9d | 1 | 0.22mi |
| 52 Saxony Cir Unit 52 Delray Beach, FL | 2.0 | 2.0 | 1027 | $3,200 | $3.12 | 26d | 1 | 0.22mi |
| 520 Brittany K Unit K Delray Beach, FL | 2.0 | 2.0 | 880 | $1,400 | $1.59 | 1d | 1 | 0.22mi |
| 564 Brittany L Delray Beach, FL | 2.0 | 2.5 | 880 | $1,800 | $2.05 | 26d | 1 | 0.22mi |
| 419 Brittany I Delray Beach, FL | 1.0 | 1.5 | 720 | $1,450 | $2.01 | 26d | 1 | 0.22mi |
| 233 Brittany F Unit F Delray Beach, FL | 2.0 | 2.0 | 988 | $1,600 | $1.62 | 26d | 1 | 0.22mi |
HOA detail condo
- Monthly dues
- $750 · $9,000/yr
- Assessments
- None detected in remarks — confirm with the listing agent.
Listing history 34 events
-
2026-06-21days on market $69,999 Active 167 DOM
-
2026-06-18days on market $69,999 Active 164 DOM
-
2026-06-17days on market $69,999 Active 163 DOM
-
2026-06-16days on market $69,999 Active 162 DOM
-
2026-06-15days on market $69,999 Active 161 DOM
-
2026-06-13days on market $69,999 Active 159 DOM
-
2026-06-09remarks 699-char remark
-
2026-06-09pricedays on market $69,999 Active 155 DOM
-
2026-06-07days on market $79,900 Active 153 DOM
-
2026-06-04days on market $79,900 Active 150 DOM
-
2026-06-03days on market $79,900 Active 149 DOM
-
2026-06-01days on market $79,900 Active 147 DOM
-
2026-05-31days on market $79,900 Active 146 DOM
-
2026-02-27price $79,900
-
2026-01-05$89,000 Active
-
2026-01-01historical $1,550
-
2025-11-25historical
-
2025-11-25$89,000 Active
-
2025-11-08historical
-
2025-09-03$1,550
-
2025-07-08price $99,999
-
2025-04-24price $110,000
-
2025-03-24price $119,000
-
2025-02-11price $129,999
-
2025-01-27price $133,900
-
2024-12-27$139,900 Active
-
2024-12-18historical
-
2024-11-21price $149,000
-
2024-09-21price $159,900
-
2024-07-30$169,000 Active
-
2024-02-08soldstatus $83,128
-
2024-02-02soldstatus $83,128 Closed
-
2024-01-04historical
-
2024-01-04$83,000
ⓘ Source: listings_history table (triggers on properties + properties_extension) + one-shot
backfill from property_details.listing_events for pre-trigger history.
Tax reassessment forecast FL · Resets to sale price
- Current annual tax
- $1,281 · $107/mo
- Projected year-2 tax
- $1,281 · $107/mo
- Expected delta
- $0/yr ($0/mo · 0.0%)
ⓘ Screening estimate from a state-policy table — verify with the county assessor before closing.
Climate risk First Street
- Flood 1/10 Low FEMA zone X (unshaded) · 0% chance over 30 yrs
- Wildfire 1/10 Low
- Heat 9/10 Extreme 7 d/yr ≥107°F today · 23 d/yr by 30 yrs out
- Wind 10/10 Extreme 99% chance of damaging wind over 30 yrs
- Air quality 2/10 Low 2 unhealthy d/yr today · 2 by 30 yrs out
Nearby sold comps map
Loading sold comps map…
Walkable amenities ~0.75 mi
Loading nearby amenities…
Taxation est. · year 1
- Rental income
- $21,069
- − Mortgage interest
- −$3,921
- − Property taxes
- −$1,281
- − Insurance
- −$350
- − Repairs & maintenance
- −$1,686
- − Management
- −$1,686
- − HOA
- −$9,000
- − Depreciation
- −$2,036
- Taxable income
- $1,110
- Est. tax owed @ 24.0%
- −$266
- After-tax cash flow
- $1,342/yr
For passive investors: Depreciation is non-cash, so a rental often shows a tax loss while cash-flowing — sheltering income. Rental losses are passive: they offset passive income freely, and up to $25,000/yr can offset ordinary (W-2) income if you actively participate and your MAGI is under $100k (phasing out to $0 by $150k); unused losses carry forward. On sale, claimed depreciation is recaptured at up to 25%, and gains may owe capital-gains tax (a 1031 exchange can defer both). Figures are a year-1 estimate at your 24.0% rate — not tax advice; consult a CPA.
Schools (NCES district)
- District
- Palm Beach
- NCES district ID
- 1201500
- Math proficiency
- 46% ▼ -16.00%
- Reading proficiency
- 53% ▼ -4.00%
- Median HH income
- $53,943
- Composite
- 42.72/100
- National rank
- #3160
- State rank
- #34 of 73 in FL
Livability — Delray Beach
- Score
- 77/100
- State rank
- #202
- US rank
- #3160
Category grades
Schools grade is shown separately in the Schools card above.
Census & demographics
- County
- Palm Beach County · 1,438,312 people
- City population
- 123,167
- Metro
- Miami-Fort Lauderdale-Pompano Beach, FL
- Population (ZIP)
- 28,431
- Household income
- $80,187
- Rent vs Own
- Severe rent burden
- 494.0
Population outlook (Palm Beach County) Hauer SSP2
- Today (2025)
- 1,637,487 people
- By 2030
- 1,743,255 · +6.5%
- By 2040
- 1,948,712 · +19.0%
- By 2050
- 2,132,979 · +30.3%
- By 2075
- 2,530,027 · +54.5%
- By 2100
- 2,706,979 · +65.3%
Race, ethnicity, and origin ACS 2023
- Neighborhood character
- Predominantly White (79%)
- Race & ethnicity
- White 79% Hispanic / Latino 13% Two or more races 9% Black 4%
- Hispanic origin (detail)
- Puerto Rican 3% Dominican 1%
- Common ancestry
- Romanian 9% Scotch-Irish 9% Italian 2%
- Foreign-born
- 20% · Canada, Jamaica, Guatemala
- Languages at home
- 80% English-only · Spanish 12% Other Indo-European 2% French/Haitian/Cajun 2%
Political lean MEDSL · Palm Beach
- 2024 margin
- Toss-up / Even · D 50.0% · R 49.2%
- 2008→2024 swing
- -22.1pp toward R · 2008: 22.9pp · 2024: 0.8pp
- All cycles
- 2024: D+0.8 2020: D+12.8 2016: D+15.3 2012: D+17.0 2008: D+22.9
Not yet ingested
- Civics
- —
Market trends
- HPI YoY
- ▲ 0.69%
- Current HPI
- 242.5138
- Rent YoY
- ▲ 0.51%
- Metro
- Miami-Fort Lauderdale-Pompano Beach, FL
- State GDP YoY
- ▲ 3.28%
- F500 in state
- 36
Industry mix (Fortune 500 HQ in FL)
| Industry | F500 HQs | Revenue |
|---|---|---|
| Industrial Technology | 2 | $29B |
|
||
| Insurance | 2 | $17B |
|
||
| Retail | 1 | $60B |
|
||
| Technology Distribution | 1 | $58B |
|
||
| Homebuilding | 1 | $35B |
|
||
| Technology Manufacturing | 1 | $35B |
|
||
Price history
-3.7% since first listed21 events — show timeline
- 2026-02-27 Price Changed $79,900 Beaches MLS
- 2026-01-05 Listed $89,000 Beaches MLS
- 2026-01-01 Rental Removed $1,550 RMLSFL
- 2025-11-25 Listed $89,000 Beaches MLS
- 2025-11-25 Listing Removed — Beaches MLS
- 2025-11-08 Listing Removed — Beaches MLS
- 2025-09-03 Listed for Rent $1,550 RMLSFL
- 2025-07-08 Price Changed $99,999 Beaches MLS
- 2025-04-24 Price Changed $110,000 Beaches MLS
- 2025-03-24 Price Changed $119,000 Beaches MLS
- 2025-02-11 Price Changed $129,999 Beaches MLS
- 2025-01-27 Price Changed $133,900 Beaches MLS
- 2024-12-27 Listed $139,900 Beaches MLS
- 2024-12-18 Listing Removed — Beaches MLS
- 2024-11-21 Price Changed $149,000 Beaches MLS
- 2024-09-21 Price Changed $159,900 Beaches MLS
- 2024-07-30 Listed $169,000 Beaches MLS
- 2024-02-08 Sold (Public Records) $83,128 Public Records
- 2024-02-02 Sold (MLS) $83,128 Beaches MLS
- 2024-01-04 Listed $83,000 Beaches MLS
- 2024-01-04 Listing Removed — Beaches MLS
Property tax history
+8.7%/yrLatest (2025): $1,281 · -21.4% YoY. Source: county tax records.
Cash-flow waterfall
monthlySold comps — $/sqft
last 12 mo · ≤1 miLoading sold comps…