73450 Country Club Dr #261 · Palm Desert, CA
Flood risk 1/10 · Minimal
- FEMA flood zone
- X (unshaded)
- Chance of flooding over 30 yrs
- 0.0%
- Est. flood insurance / yr
- $507 – $1,088
Fire risk 1/10 · Minimal
- Est. fire insurance / yr
- $659 – $1,223
Heat risk 9/10 · Severe
- Hot days now (above 114°F)
- 5 days/yr
- Hot days in 30 yrs
- 15 days/yr
Wind risk 1/10 · Minimal
- Chance of severe wind over 30 yrs
- —
Air-quality risk 4/10 · Minor
- Unhealthy air days now
- 5 days/yr
- Unhealthy air days in 30 yrs
- 7 days/yr
Risk factors via First Street. Map © Google.
Why this score? — see what drove the B+ grade
The composite is a weighted blend of 9 inputs, each scored 0–100. Each bar is that input's sub-score; the figure is the points it added to the 100-point composite (weight × sub-score).
- Cash flow +30.0/30.0
- ARV discount +15.0/15.0
- DSCR +10.0/10.0
- 1% rule +9.9/10.0
- Schools +3.8/10.0
- Rent growth +2.9/5.0
- Livability +2.6/5.0
- Condition / age +2.5/5.0
- Appreciation +0.0/10.0
$239,900
🖨 Deal sheet 📄 Offer letter ✓ Due diligence
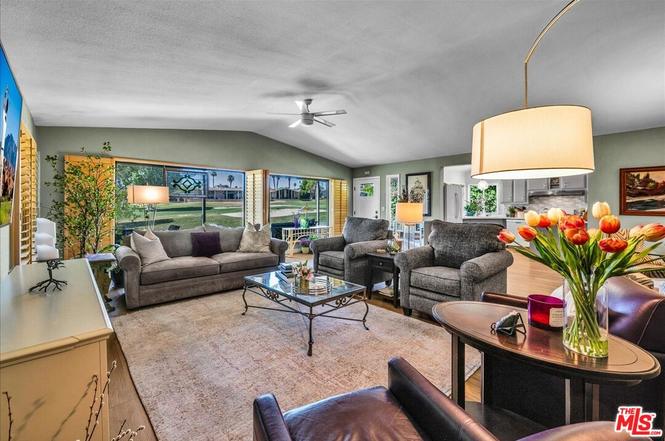
Listing remarks MLS
3D VIDEO. click the second photo and it will bring up the video Oodles of outdoor living space with great Golf Course and mountain views. Open, bright, spacious great rooms with vaulted ceilings and an entire wall of large windows out to Golf Course. This house has a really large welcoming kitchen with three windows over the sink that draws in the lush green view right into the kitchen. There is an outrageous amount of cabinets and storage, informal dining and formal. A great house for entertaining. Two beautiful new bathrooms. Move in ready!!! Outside just repainted, newer flooring, laminate and carpet, newer kitchen appliances, house replumbed recently and a new condenser for the furnace. I think Suncrest is a best manufactured home community in the desert. It boasts a lush green environment with wide meandering boulevard style streets. Great views, Club House hosts many activities (when not Covid time). There is a outstanding Golf Course that many call their 'favorite' with a pro shop and a cafe. Putting green, pickle ball, tennis just for fun. 3 pools, one with salt water, 3 spa's. Truly resort style 55+ living with warm friendly neighbors. I saved the best for last. .. .. RENT CONTROL. The lease payments have NOT gone up for 5 years. Fabulous location . .. .. .premier shopping and restaurants steps away. Eisenhower hospital and medical center 3 minutes away. Come see this neighborhood you will love it here. I do!
Key facts
- Tennis court
- Three swimming pools
- Covered lanai
Tags
Property features AI
Finance
- Other: Community pool and spa available; Directions: Enter Suncrest from Country Club Drive, head north; follow main road—home will be on the left
- Financial info: Listing terms: Cash or cash to new loan; Lot/land not included (space rental applicable); Monthly lot lease indicated
- HOA & community: Senior park (Suncrest Country Club) with onsite property management; Community amenities include clubhouse, card room, billiard room, pool, spa, sport courts, and tennis; Community of approximately 359 units; Manager approval required for park residency; Pets allowed per association rules (call for details)
Exterior
- Parking: Attached carport; Two total parking spaces (two covered)
- Security: Gated community; Smoke detector(s); Carbon monoxide detector(s); Resident manager on site
- Utilities: Public water; Sewer to street; Gas water heater (instant hot)
- Home design: Manufactured home; Single-story (1 floor); Faces north; Updated/remodeled condition; Triple-wide mobile home
- Construction: Manufactured construction; Foundation on pillars/posts/piers; Model manufactured in 1986 (Hallmark Southwest); Mobile home dimensions approximately 60 x 12
- Exterior features: Covered patio; Shed; On golf course lot location; Golf course and mountain views; Insulated doors
Interior
- Kitchen: Gas cooking; Kitchen island; Remodeled kitchen; Dishwasher; Garbage disposal; Microwave; Range/oven; Refrigerator; Breakfast counter/bar
- Bedrooms: Walk-in closet
- Flooring: Laminate floors; Carpeted floors
- Bathrooms: Two remodeled 3/4 bathrooms with tile and shower stalls
- Heating & cooling: Central heating (natural gas); Central air conditioning; Instant hot water (gas); Ceiling fan
- Interior features: Built-in shelving/cabinetry; Cathedral/vaulted ceilings; Drywall walls; Open floor plan; Entry from the living room; Plantation shutters; Double-pane windows; Mini blinds
- Laundry & utility: Interior laundry room with washer and dryer included; Utility room
Neighborhood map
What this means for you Summary
Snapshot
- This is a 2-bed/2.0-bath manufactured listed at $240k.
Deal economics
- At list price, monthly cash flow is $1k ($17k/yr) — positive.
- The deal already cash-flows at list — no discount required.
- Meets the 1% rule at list price ($4k rent vs $240k).
- Cap rate 13.2% vs local median 3.5% in Palm Desert — top-decile yield for the area; either an underpriced asset or a hidden risk that comps aren't pricing in. Stress-test before assuming the spread holds.
Location & tenants
- Location reads 51/100 on livability (#1,050 in CA) — a working-class tenant base; expect higher turnover. Strengths: schools A-, employment B+, housing B; Watch: crime D, amenities F, commute F.
- Desert Sands Unified (suburban): math 31% / reading 56% proficiency, ranked #199 of 517 in CA (top 38%) — families likely to look elsewhere, expect single-tenant / working-renter base with shorter leases.
- Market conditions: Rents rising (+1.6%/yr); 545 active listings in the ZIP; 40 comparable units currently listed for rent nearby; rentals lingering (median 44d on market — plan ~5-8 weeks vacancy on turnover, expect pricing pressure); 62% of comp listings sitting > 30 days — soft ceiling on asking rent; 9,195 units permitted in Riverside County in 2024 (1,512 in 5+ unit buildings).
- At $3,585/mo this rent would consume 61% of the median local household income ($70k/yr) (locally 1734% of renters already pay >50% of income on rent) — very limited rent-growth headroom before tenants either downsize or default.
Forward outlook
- Local home prices are declining (-3.0%/yr); year-one equity from $2k of loan paydown is wiped out by about $7k of value loss. Plan a longer hold.
- Riverside County population projected at +22% by 2050 — long-run rental-demand tailwind backs the buy-and-hold thesis.
- At projected returns (-3.0% appreciation + 1.6% rent growth), your $67k cash investment doubles in ~6 years — after that, you're playing with house money.
Negotiation context
- Only 7 days on market — expect competitive offers; lowballing is unlikely to land.
- 9 sale attempts since 23y ago with the ask held roughly flat each time — persistent listings suggest the price (not the market) is what's stuck; bring a comps-based counter.
- Current owner paid $165k; 45% above their basis — modest negotiation headroom, anchor on the comps not their cost.
Risks & watch-outs
- Climate carrying-cost: extreme-heat days projected 5→15/yr by 2055 (HVAC capex compounding) — expect insurance premiums to compound above CPI over the hold.
Questions for the listing agent
- Is there a deadline driving the sale (1031 exchange, divorce, estate, relocation)? That informs how much negotiation room exists.
- Schools are A-rated — typically a magnet for longer-tenancy family renters. What's the average tenant stay here, and is there a school-zone premium baked into asking?
- Crime grade is D in this area — have there been break-ins, vandalism, or insurance claims at this property in the last 3 years? What carrier currently insures it and at what premium?
- What's the average days-on-market for RENTAL listings here right now (not sales)? A rising rental-DOM trend means longer vacancies and softer asking-rent achievability than the comps imply.
- What's the recent tenant-quality profile in this submarket — average credit score on applications, eviction rate, late-payment / NSF rate, and stable-employment percentage? A property-management company in the area should have these aggregated.
- How much new for-sale + rental construction is in the pipeline within 1–3 miles? Heavy new supply typically softens prices + rents 12–24 months out; constrained supply supports both.
Investment metrics
- 1% rule
- 1.49% ✓
- Cap rate
- 13.24%
- Cash-on-cash
- 24.82%
- DSCR
- 2.10
- GRM
- 5.6
CMA / ARV
- ARV (on-the-fly)
- $357,696
- Comps found
- 12
Show comp detail 12 sales within ~0.75 mi
| Address | Dist | Beds/Ba | Sqft | Sold | Price | $/sf | Match |
|---|---|---|---|---|---|---|---|
| 73450 Country Club Dr Unit Sp. 91 | 0.00mi | 2/2.0 | 1,788 (+4%) | 0mo | $255,000 | $143 | 94 |
| 73450 Country Club Dr #87 | 0.00mi | 3/2.0 (+1) | 1,636 (-5%) | 1mo | $222,500 | $136 | 85 |
| 73297 Highland Springs Dr #2 | 0.34mi | 2/2.0 | 1,800 (+4%) | 0mo | $275,000 | $153 | 77 |
| 73045 Buck Springs Dr | 0.40mi | 2/2.0 | 1,680 (-3%) | 2mo | $468,000 | $279 | 75 |
| 38235 Poppet Canyon Dr | 0.50mi | 2/2.0 | 1,680 (-3%) | 0mo | $355,000 | $211 | 72 |
| 73330 Desert Greens Dr N | 0.67mi | 2/2.0 | 1,740 (+1%) | 1mo | $229,080 | $132 | 67 |
| 39800 Desert Greens Dr E | 0.72mi | 2/2.0 | 1,760 (+2%) | 1mo | $365,000 | $207 | 62 |
| 38668 Fawn Springs Dr | 0.40mi | 3/2.5 (+1) | 1,600 (-7%) | 0mo | $410,000 | $256 | 62 |
| 38251 Desert Greens Dr E | 0.72mi | 2/2.0 | 1,780 (+3%) | 1mo | $253,000 | $142 | 61 |
| 73701 Half Way Dr | 0.49mi | 2/2.5 | 1,890 (+9%) | 2mo | $400,000 | $212 | 58 |
| 73651 Adobe Dr | 0.43mi | 2/2.0 | 1,488 (-14%) | 1mo | $199,000 | $134 | 56 |
| 39759 Manzanita Dr | 0.64mi | 3/2.0 (+1) | 1,940 (+12%) | 1mo | $449,900 | $232 | 44 |
Match score weights: distance 35% · size 25% · config 20% · recency 20%. Top-matched comps best support the ARV.
Projected returns pro-forma
-3.0% appreciation · 1.6% rent growth · sell at horizon
- IRR
- 16.7%
- Equity multiple
- 1.66×
- Total profit
- $44,571
- Equity at exit
- $35,770
- IRR
- 24.3%
- Equity multiple
- 2.97×
- Total profit
- $132,586
- Equity at exit
- $20,742
Cash invested: $67,172 (down + closing). Projections, not guarantees.
Landlord ↔ Tenant lean methodology
- Overall (STATE)
- 18 Strongly Tenant-Friendly
- State California
- 18 Strongly Tenant-Friendly · D+13
- County
- — inherits STATE
- City
- — inherits STATE
ZIP-level market 92260
- Rents YoY
- 1.6%
- Active inventory
- 545
- Price-to-rent
- 5.6×
Monthly cashflow live
- Estimated rent
- $3,585 high interval (Pro) →
- Mortgage (P&I)
- −$1,258
- Tax from tax record
- −$85 /mo · $1,015/yr
- Insurance
- −$100
- HOA
- −$0
- Vacancy / Maint / Mgmt
- −$753
- Net cashflow
- $1,390
Break-even live
UW: 25.0% down · 7.5% · 30yr · 1.5% tax · 5.0% vac · 8.0% maint · 8.0% mgmt
Financing live
Cash to close
- Down payment
- $59,975
- Closing costs
- $7,197
- Reserves months
- —
- Total cash needed
- —
Loan-product check · same deal, 3 products live
Conventional
25% down · 7.5% · 30yr
- Down + closing
- —
- Monthly P&I
- —
- Monthly cashflow
- —
- DSCR
- —
- Eligible?
- —
Personal DTI + credit; lowest rate.
DSCR
20% down · 8.5% · 30yr
- Down + closing
- —
- Monthly P&I
- —
- Monthly cashflow
- —
- DSCR
- —
- Eligible?
- —
No personal income docs; deal must DSCR.
Hard money
10% down · 12.0% · 12mo
- Down + closing
- —
- Monthly P&I
- —
- Monthly cashflow
- —
- DSCR
- —
- Eligible?
- —
Short-term bridge; refi at stabilization.
Rent comps 40 comps
| Address | Beds | Baths | Sqft | Rent | $/sqft | DOM | Units | Dist |
|---|---|---|---|---|---|---|---|---|
| 73450 Country Club Dr #120 Palm Desert, CA | 2.0 | 2.0 | 1856 | $2,995 | $1.61 | 11d | 1 | 0.03mi |
| 4162 Via Mattina Palm Desert, CA | 2.0 | 2.0 | 1867 | $2,950 | $1.58 | 12d | 1 | 0.17mi |
| 3253 Via Giorna Palm Desert, CA | 2.0 | 2.0 | 1961 | $4,500 | $2.29 | 24d | 1 | 0.22mi |
| 248 Strada Fortuna Palm Desert, CA | 2.0 | 2.0 | 1400 | $2,500 | $1.79 | 43d | 1 | 0.26mi |
| 170 Via Tramonto Palm Desert, CA | 3.0 | 2.0 | 1910 | $3,900 | $2.04 | 10d | 1 | 0.29mi |
| 170 Via Tramonto Palm Desert, CA | 3.0 | 2.0 | 1910 | $4,000 | $2.09 | 43d | 1 | 0.29mi |
| 73075 Buck Springs Dr Palm Desert, CA | 2.0 | 2.0 | 1440 | $1,950 | $1.35 | 43d | 1 | 0.36mi |
| 38520 Poppet Canyon Dr Palm Desert, CA | 2.0 | 2.0 | 1392 | $3,700 | $2.66 | 43d | 1 | 0.41mi |
| 40064 Silktree Ct Palm Desert, CA | 3.0 | 2.0 | 1712 | $3,200 | $1.87 | 24d | 1 | 0.45mi |
| 73639 Cabazon Peak Dr Palm Desert, CA | 2.0 | 2.0 | 1717 | $2,400 | $1.40 | 43d | 1 | 0.46mi |
| 40255 Sagewood Dr Palm Desert, CA | 3.0 | 2.0 | 1712 | $3,300 | $1.93 | 18d | 1 | 0.56mi |
| 38250 Azalea Dr Palm Desert, CA | 2.0 | 2.0 | 1806 | $5,500 | $3.05 | 43d | 1 | 0.56mi |
| 73843 Line Canyon Ln Palm Desert, CA | 2.0 | 2.0 | 1570 | $2,100 | $1.34 | 11d | 1 | 0.57mi |
| 2701 Via Calderia Palm Desert, CA | 2.0 | 2.0 | 1559 | $2,850 | $1.83 | 24d | 1 | 0.59mi |
| 40605 Ventana Ct Palm Desert, CA | 3.0 | 2.5 | 2093 | $4,500 | $2.15 | 18d | 1 | 0.62mi |
| 40556 Clover Ln Palm Desert, CA | 3.0 | 2.5 | 1880 | $4,200 | $2.23 | 43d | 1 | 0.66mi |
| 1803 Via San Martino Palm Desert, CA | 2.0 | 2.0 | 1559 | $3,900 | $2.50 | 43d | 1 | 0.67mi |
| 40560 Glenwood Ln Palm Desert, CA | 3.0 | 3.0 | 2052 | $6,500 | $3.17 | 43d | 1 | 0.67mi |
| 41517 Armanac Ct Palm Desert, CA | 3.0 | 2.0 | 1537 | $3,400 | $2.21 | 2d | 1 | 0.71mi |
| 73983 Munn Cir Palm Desert, CA | 3.0 | 2.0 | 2064 | $3,400 | $1.65 | 43d | 1 | 0.75mi |
| 73750 Calle Bisque Palm Desert, CA | 3.0 | 2.0 | 1537 | $6,500 | $4.23 | 43d | 1 | 0.78mi |
| 40445 Portola Ave Palm Desert, CA | 1.0–2.0 | 1.0–2.0 | 975 | $3,215 | $3.30 | 5d | 15 | 0.85mi |
| 217 Las Lomas Palm Desert, CA | 2.0 | 2.0 | 1656 | $6,300 | $3.80 | 43d | 1 | 0.88mi |
| 142 Lake Shore Dr Rancho Mirage, CA | 3.0 | 3.0 | 1888 | $4,850 | $2.57 | 43d | 1 | 0.88mi |
| 205 Las Lomas Palm Desert, CA | 2.0 | 2.0 | 1457 | $6,000 | $4.12 | 43d | 1 | 0.88mi |
| 255 San Remo St Palm Desert, CA | 2.0 | 2.0 | 1656 | $6,600 | $3.99 | 43d | 1 | 0.88mi |
| 72460 Rodeo Way Rancho Mirage, CA | 2.0 | 2.0 | 1851 | $2,500 | $1.35 | 4d | 1 | 0.89mi |
| 177 Las Lomas Palm Desert, CA | 2.0 | 2.0 | 1800 | $7,500 | $4.17 | 43d | 1 | 0.89mi |
| 72385 Beverly Way Rancho Mirage, CA | 2.0 | 2.0 | 1851 | $2,500 | $1.35 | 18d | 1 | 0.92mi |
| 8 Las Cruces Ln Palm Desert, CA | 2.0 | 2.0 | 1705 | $5,000 | $2.93 | 43d | 1 | 0.92mi |
| 323 San Remo St Palm Desert, CA | 2.0 | 2.0 | 1556 | $8,500 | $5.46 | 43d | 1 | 0.94mi |
| 1701 Retreat Cir Palm Desert, CA | 3.0 | 2.5 | 2034 | $5,300 | $2.61 | 43d | 1 | 0.95mi |
| 264 Avenida del Sol Palm Desert, CA | 2.0 | 2.0 | 1800 | $6,000 | $3.33 | 43d | 1 | 0.95mi |
| 37677 Emerson Dr Palm Desert, CA | 3.0 | 2.0 | 1896 | $3,600 | $1.90 | 43d | 1 | 0.97mi |
| 214 La Paz Way Palm Desert, CA | 2.0 | 1.5 | 1670 | $6,700 | $4.01 | 43d | 1 | 0.97mi |
| 336 Villena Way Palm Desert, CA | 2.0 | 2.0 | 1303 | $5,500 | $4.22 | 43d | 1 | 0.97mi |
| 191 Winterhaven Cir Palm Desert, CA | 2.0 | 1.5 | 1250 | $2,800 | $2.24 | 43d | 1 | 0.97mi |
| 144 Las Lomas Palm Desert, CA | 2.0 | 2.0 | 1584 | $6,000 | $3.79 | 24d | 1 | 0.97mi |
| 166 Wimbledon Ct Palm Desert, CA | 2.0 | 2.0 | 1250 | $3,200 | $2.56 | 43d | 1 | 0.98mi |
| 311 Villena Way Palm Desert, CA | 2.0 | 2.0 | 1653 | $7,000 | $4.23 | 24d | 1 | 1.00mi |
Listing history 6 events
-
2026-06-18days on market $239,900 Active 7 DOM
-
2026-06-17days on market $239,900 Active 6 DOM
-
2026-06-16days on market $239,900 Active 5 DOM
-
2026-06-15days on market $239,900 Active 4 DOM
-
2026-06-13remarks 687-char remark
-
2026-06-13$239,900 Active 2 DOM
ⓘ Source: listings_history table (triggers on properties + properties_extension) + one-shot
backfill from property_details.listing_events for pre-trigger history.
Tax reassessment forecast CA · Resets to sale price
- Current annual tax
- $1,015 · $85/mo
- Projected year-2 tax
- $1,823 · $152/mo
- Expected delta
- +$808/yr (+$67/mo · 79.6%)
ⓘ Screening estimate from a state-policy table — verify with the county assessor before closing.
Climate risk First Street
- Flood 1/10 Low FEMA zone X (unshaded) · 0% chance over 30 yrs
- Wildfire 1/10 Low
- Heat 9/10 Extreme 5 d/yr ≥114°F today · 15 d/yr by 30 yrs out
- Wind 1/10 Low
- Air quality 4/10 Moderate 5 unhealthy d/yr today · 7 by 30 yrs out
Nearby sold comps map
Loading sold comps map…
Walkable amenities ~0.75 mi
Loading nearby amenities…
Taxation est. · year 1
- Rental income
- $43,021
- − Mortgage interest
- −$13,438
- − Property taxes
- −$1,015
- − Insurance
- −$1,200
- − Repairs & maintenance
- −$3,442
- − Management
- −$3,442
- − Depreciation
- −$6,979
- Taxable income
- $13,506
- Est. tax owed @ 24.0%
- −$3,241
- After-tax cash flow
- $13,434/yr
For passive investors: Depreciation is non-cash, so a rental often shows a tax loss while cash-flowing — sheltering income. Rental losses are passive: they offset passive income freely, and up to $25,000/yr can offset ordinary (W-2) income if you actively participate and your MAGI is under $100k (phasing out to $0 by $150k); unused losses carry forward. On sale, claimed depreciation is recaptured at up to 25%, and gains may owe capital-gains tax (a 1031 exchange can defer both). Figures are a year-1 estimate at your 24.0% rate — not tax advice; consult a CPA.
Schools (NCES district)
- District
- Desert Sands Unified
- NCES district ID
- 0611110
- Math proficiency
- 31% ▼ -4.00%
- Reading proficiency
- 56% ▲ 7.00%
- Median HH income
- $54,957
- Composite
- 37.77/100
- National rank
- #4346
- State rank
- #199 of 517 in CA
Livability — Palm Desert
- Score
- 51/100
- State rank
- #1050
- US rank
- #25164
Category grades
Schools grade is shown separately in the Schools card above.
Census & demographics
- Census place
- Palm Desert, CA
- County
- Riverside County · 2,287,001 people
- City population
- 58,615
- Metro
- Riverside-San Bernardino-Ontario, CA
- Population (ZIP)
- 30,523
- Household income
- $70,091
- Rent vs Own
- Severe rent burden
- 1734.0
Population outlook (Riverside County) Hauer SSP2
- Today (2025)
- 2,664,475 people
- By 2030
- 2,802,692 · +5.2%
- By 2040
- 3,050,904 · +14.5%
- By 2050
- 3,256,783 · +22.2%
- By 2075
- 3,655,058 · +37.2%
- By 2100
- 3,766,594 · +41.4%
Race, ethnicity, and origin ACS 2023
- Neighborhood character
- Majority White (61%)
- Race & ethnicity
- White 61% Hispanic / Latino 31% Two or more races 20% Asian 4% Black 2%
- Hispanic origin (detail)
- Mexican 25%
- Common ancestry
- Italian 4% Lithuanian 3% Slovak 2%
- Foreign-born
- 18% · Canada, South Korea, Vietnam
- Languages at home
- 73% English-only · Spanish 22% French/Haitian/Cajun 1% Other Indo-European 1%
Political lean MEDSL · Riverside
- 2024 margin
- Toss-up / Even · D 48.0% · R 49.3% · Other 2.6%
- 2008→2024 swing
- -3.6pp toward R · 2008: 2.3pp · 2024: -1.3pp
- All cycles
- 2024: R+1.3 2020: D+8.0 2016: D+4.3 2012: R+0.4 2008: D+2.3
Not yet ingested
- Civics
- —
Market trends
- HPI YoY
- ▼ -364.94%
- Current HPI
- 294.9425
- Rent YoY
- ▲ 1.60%
- Metro
- Riverside-San Bernardino-Ontario, CA
- State GDP YoY
- ▲ 3.21%
- F500 in state
- 116
Industry mix (Fortune 500 HQ in CA)
| Industry | F500 HQs | Revenue |
|---|---|---|
| Technology | 27 | $1,492B |
|
||
| Financial Services | 3 | $174B |
|
||
| Retail | 3 | $44B |
|
||
| Insurance | 3 | $26B |
|
||
| Media / Entertainment | 2 | $115B |
|
||
| Pharmaceuticals / Biotech | 2 | $62B |
|
||
Price history
+128.5% since first listed21 events — show timeline
- 2026-06-11 Listed $239,900 TheMLS
- 2021-04-05 Sold (MLS) $165,000 GPSMLS
- 2021-02-26 Pending — GPSMLS
- 2021-02-13 Listed $169,950 GPSMLS
- 2017-09-06 Sold (MLS) $86,250 GPSMLS
- 2017-09-06 Sold (MLS) $86,250 GPSMLS
- 2017-07-15 Pending — GPSMLS
- 2017-04-19 Price Changed $89,900 GPSMLS
- 2017-01-05 Listed $92,000 GPSMLS
- 2016-12-28 Listing Removed — GPSMLS
- 2016-10-05 Listed $99,000 GPSMLS
- 2010-07-25 Listing Removed — GPSMLS
- 2010-04-14 Listed $89,900 GPSMLS
- 2004-06-04 Listing Removed — GPSMLS
- 2004-03-25 Listing Removed — GPSMLS
- 2004-02-13 Listed $95,000 GPSMLS
- 2004-02-06 Listed $97,500 GPSMLS
- 2004-01-31 Listing Removed — GPSMLS
- 2003-11-05 Listing Removed — GPSMLS
- 2003-10-31 Listed $97,500 GPSMLS
- 2003-04-11 Listed $105,000 GPSMLS
Property tax history
-1.3%/yrLatest (2025): $1,015 · +4.6% YoY. Source: county tax records.
Cash-flow waterfall
monthlySold comps — $/sqft
last 12 mo · ≤1 miLoading sold comps…