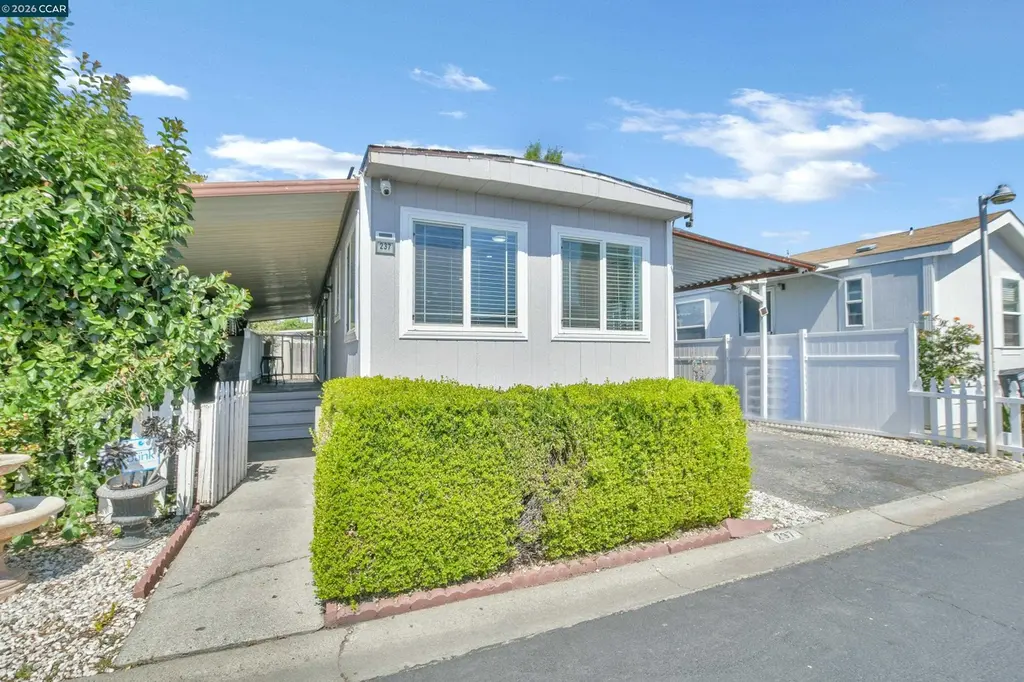
237 Orangevale · Pittsburg, CA
Flood risk 1/10 · Minimal
- FEMA flood zone
- X (unshaded)
- Chance of flooding over 30 yrs
- 0.0%
- Est. flood insurance / yr
- $507 – $1,088
Fire risk 6/10 · Moderate
- Est. fire insurance / yr
- $659 – $1,223
Heat risk 5/10 · Moderate
- Hot days now (above 97°F)
- 7 days/yr
- Hot days in 30 yrs
- 14 days/yr
Wind risk 1/10 · Minimal
- Chance of severe wind over 30 yrs
- —
Air-quality risk 8/10 · Major
- Unhealthy air days now
- 14 days/yr
- Unhealthy air days in 30 yrs
- 14 days/yr
Risk factors via First Street. Map © Google.
Why this score? — see what drove the C grade
The composite is a weighted blend of 9 inputs, each scored 0–100. Each bar is that input's sub-score; the figure is the points it added to the 100-point composite (weight × sub-score).
- Cash flow +25.6/30.0
- DSCR +8.5/10.0
- ARV discount +7.5/15.0
- 1% rule +6.7/10.0
- Livability +2.9/5.0
- Rent growth +2.8/5.0
- Schools +2.8/10.0
- Condition / age +2.5/5.0
- Appreciation +0.0/10.0
$185,000
🖨 Deal sheet 📄 Offer letter ✓ Due diligence
Listing remarks
Welcome to 237 Orangevale Ave, Pittsburg, CA 94565, a beautifully remodeled and modernized home offering comfort, style, and move-in-ready convenience. This charming 2-bedroom, 1-bath home has been completely updated from top to bottom with quality finishes throughout. Features include a brand-new modern kitchen, updated bathroom, new flooring, dual-pane windows, new siding, and fresh interior and exterior paint. Every detail has been thoughtfully renovated to create a clean, contemporary feel while maintaining the home’s charm. LOT FEE $890.00 Perfect for first-time buyers, downsizers, or investors looking for a turnkey property conveniently located near shopping, dining, schools, a
Key facts
- New siding
- Dual-pane windows
- New flooring
Tags
Property features AI
Finance
- HOA & community: Pets allowed; Community clubhouse; Community playground; Park name: THE MEADOWS
Exterior
- Parking: Carport
- Utilities: Public water; Public sewer
- Home design: Manufactured in park (mobile home); Single-wide
- Construction: Wood siding
- Exterior features: Side yard; Community pool
Interior
- Kitchen: Gas range
- Bedrooms: 1 bedroom (street level)
- Flooring: Laminate flooring
- Bathrooms: 1 full bathroom
- Heating & cooling: Forced air heating; Central air; Ceiling fan(s)
- Interior features: No additional rooms; Eat-in kitchen
Neighborhood map
What this means for you Summary
Snapshot
- This is a 2-bed/1.0-bath manufactured listed at $185k.
Deal economics
- At list price, monthly cash flow is $437 ($5k/yr) — positive.
- The deal already cash-flows at list — no discount required.
- Meets the 1% rule at list price ($2k rent vs $185k).
- Recommended offer: $182k (1.5% below list) — sets the bar for market timing.
- Cap rate 9.1% vs local median 3.4% in Pittsburg — top-decile yield for the area; either an underpriced asset or a hidden risk that comps aren't pricing in. Stress-test before assuming the spread holds.
Location & tenants
- Location reads 58/100 on livability (#687 in CA) — a working-class tenant base; expect higher turnover. Strengths: employment A+, housing A+; Watch: schools F, crime D-, amenities F.
- Pittsburg Unified (suburban): math 21% / reading 35% proficiency, ranked #1,069 of 1,400 in CA (top 76%) — low school quality limits family demand, transient renter base, plan for 1-2y turnover; 66% free/reduced lunch — lower-income household profile, screen leases tightly.
- Market conditions: Rents rising (+1.1%/yr); 265 active listings in the ZIP; 4 comparable units currently listed for rent nearby; rentals leasing fast (median 11d on market — plan ~1-2 weeks tenant-placement turnaround); solid renter incomes; 2,169 units permitted in Contra Costa County in 2024 (896 in 5+ unit buildings).
Forward outlook
- Local home prices are declining (-3.0%/yr); year-one equity from $1k of loan paydown is wiped out by about $6k of value loss. Plan a longer hold.
- Contra Costa County population projected at +26% by 2050 — long-run rental-demand tailwind backs the buy-and-hold thesis.
Negotiation context
- It's been on market 21 days — a 2% lower offer ($182k) is reasonable based on typical stale-listing flexibility.
Risks & watch-outs
- Climate carrying-cost: major wildfire risk; extreme-heat days projected 7→14/yr by 2055 (HVAC capex compounding) — expect insurance premiums to compound above CPI over the hold.
Questions for the listing agent
- Is there a deadline driving the sale (1031 exchange, divorce, estate, relocation)? That informs how much negotiation room exists.
- Schools are F-rated, which usually means shorter tenancies and higher turnover. Who's the typical renter profile here, and what's been the actual vacancy rate?
- Crime grade is D in this area — have there been break-ins, vandalism, or insurance claims at this property in the last 3 years? What carrier currently insures it and at what premium?
- What's the average days-on-market for RENTAL listings here right now (not sales)? A rising rental-DOM trend means longer vacancies and softer asking-rent achievability than the comps imply.
- What's the recent tenant-quality profile in this submarket — average credit score on applications, eviction rate, late-payment / NSF rate, and stable-employment percentage? A property-management company in the area should have these aggregated.
- How much new for-sale + rental construction is in the pipeline within 1–3 miles? Heavy new supply typically softens prices + rents 12–24 months out; constrained supply supports both.
Investment metrics
- 1% rule
- 1.17% ✓
- Cap rate
- 9.13%
- Cash-on-cash
- 10.13%
- DSCR
- 1.45
- GRM
- 7.1
CMA / ARV
- ARV (on-the-fly)
- $116,928
- Comps found
- 1
Show comp detail 1 sale within ~0.75 mi
| Address | Dist | Beds/Ba | Sqft | Sold | Price | $/sf | Match |
|---|---|---|---|---|---|---|---|
| 153 Shannon | 0.21mi | 2/1.0 | 720 (+7%) | 10mo | $125,000 | $174 | 70 |
Match score weights: distance 35% · size 25% · config 20% · recency 20%. Top-matched comps best support the ARV.
Projected returns pro-forma
-3.0% appreciation · 1.11% rent growth · sell at horizon
- IRR
- -3.2%
- Equity multiple
- 0.88×
- Total profit
- $-6,153
- Equity at exit
- $27,584
- IRR
- 4.2%
- Equity multiple
- 1.28×
- Total profit
- $14,616
- Equity at exit
- $15,995
Cash invested: $51,800 (down + closing). Projections, not guarantees.
Landlord ↔ Tenant lean methodology
- Overall (STATE)
- 18 Strongly Tenant-Friendly
- State California
- 18 Strongly Tenant-Friendly · D+13
- County
- — inherits STATE
- City
- — inherits STATE
ZIP-level market 94565
- Rents YoY
- 1.1%
- Active inventory
- 265
- Price-to-rent
- 7.1×
Monthly cashflow live
- Estimated rent
- $2,172 medium interval (Pro) →
- Mortgage (P&I)
- −$970
- Tax est. 1.5%
- −$231 /mo · $2,775/yr
- Insurance
- −$77
- HOA
- −$0
- Vacancy / Maint / Mgmt
- −$456
- Net cashflow
- $437
Break-even live
UW: 25.0% down · 7.5% · 30yr · 1.5% tax · 5.0% vac · 8.0% maint · 8.0% mgmt
Financing live
Cash to close
- Down payment
- $46,250
- Closing costs
- $5,550
- Reserves months
- —
- Total cash needed
- —
Loan-product check · same deal, 3 products live
Conventional
25% down · 7.5% · 30yr
- Down + closing
- —
- Monthly P&I
- —
- Monthly cashflow
- —
- DSCR
- —
- Eligible?
- —
Personal DTI + credit; lowest rate.
DSCR
20% down · 8.5% · 30yr
- Down + closing
- —
- Monthly P&I
- —
- Monthly cashflow
- —
- DSCR
- —
- Eligible?
- —
No personal income docs; deal must DSCR.
Hard money
10% down · 12.0% · 12mo
- Down + closing
- —
- Monthly P&I
- —
- Monthly cashflow
- —
- DSCR
- —
- Eligible?
- —
Short-term bridge; refi at stabilization.
Rent comps 4 comps
| Address | Beds | Baths | Sqft | Rent | $/sqft | DOM | Units | Dist |
|---|---|---|---|---|---|---|---|---|
| 1010 Power Ave Pittsburg, CA | 1.0–2.0 | 1.0–2.0 | 818 | $2,169 | $2.65 | 2d | 12 | 0.32mi |
| 4 Covington Dr Unit A Pittsburg, CA | 1.0 | 1.0 | 600 | $2,000 | $3.33 | 11d | 1 | 0.37mi |
| 505 W 10th St Pittsburg, CA | 1.0–4.0 | 1.0–2.0 | 416 | $2,141 | $5.14 | 5d | 8 | 1.01mi |
| 310 Snow Flake Way Pittsburg, CA | 1.0 | 1.0 | 400 | $1,700 | $4.25 | 18d | 1 | 1.29mi |
Listing history 15 events
-
2026-06-18days on market $185,000 Active 21 DOM
-
2026-06-17days on market $185,000 Active 20 DOM
-
2026-06-16days on market $185,000 Active 19 DOM
-
2026-06-15days on market $185,000 Active 18 DOM
-
2026-06-13days on market $185,000 Active 16 DOM
-
2026-06-13days on market $185,000 Active 15 DOM
-
2026-06-09days on market $185,000 Active 12 DOM
-
2026-06-08days on market $185,000 Active 11 DOM
-
2026-06-07days on market $185,000 Active 10 DOM
-
2026-06-04days on market $185,000 Active 7 DOM
-
2026-06-03days on market $185,000 Active 6 DOM
-
2026-06-02days on market $185,000 Active 5 DOM
-
2026-06-01days on market $185,000 Active 4 DOM
-
2026-05-31days on market $185,000 Active 3 DOM
-
2026-05-28$185,000 Active
ⓘ Source: listings_history table (triggers on properties + properties_extension) + one-shot
backfill from property_details.listing_events for pre-trigger history.
Climate risk First Street
- Flood 1/10 Low FEMA zone X (unshaded) · 0% chance over 30 yrs
- Wildfire 6/10 Major
- Heat 5/10 Major 7 d/yr ≥97°F today · 14 d/yr by 30 yrs out
- Wind 1/10 Low
- Air quality 8/10 Severe 14 unhealthy d/yr today · 14 by 30 yrs out
Nearby sold comps map
Loading sold comps map…
Walkable amenities ~0.75 mi
Loading nearby amenities…
Taxation est. · year 1
- Rental income
- $26,061
- − Mortgage interest
- −$10,363
- − Property taxes
- −$2,775
- − Insurance
- −$925
- − Repairs & maintenance
- −$2,085
- − Management
- −$2,085
- − Depreciation
- −$5,382
- Taxable income
- $2,447
- Est. tax owed @ 24.0%
- −$587
- After-tax cash flow
- $4,659/yr
For passive investors: Depreciation is non-cash, so a rental often shows a tax loss while cash-flowing — sheltering income. Rental losses are passive: they offset passive income freely, and up to $25,000/yr can offset ordinary (W-2) income if you actively participate and your MAGI is under $100k (phasing out to $0 by $150k); unused losses carry forward. On sale, claimed depreciation is recaptured at up to 25%, and gains may owe capital-gains tax (a 1031 exchange can defer both). Figures are a year-1 estimate at your 24.0% rate — not tax advice; consult a CPA.
Schools (NCES district)
- District
- Pittsburg Unified
- NCES district ID
- 0630600
- Math proficiency
- 21% ▲ 1.00%
- Reading proficiency
- 35% ▲ 1.00%
- Median HH income
- $55,872
- Composite
- 27.99/100
- National rank
- #12238
- State rank
- #1069 of 1400 in CA
Livability — Pittsburg
- Score
- 58/100
- State rank
- #687
- US rank
- #20922
Category grades
Schools grade is shown separately in the Schools card above.
Census & demographics
- Census place
- Pittsburg, CA
- County
- Contra Costa County · 1,059,880 people
- City population
- 100,488
- Metro
- San Francisco-Oakland-Berkeley, CA
- Population (ZIP)
- 100,488
- Household income
- $95,556
- Rent vs Own
- Severe rent burden
- 3942.0
Population outlook (Contra Costa County) Hauer SSP2
- Today (2025)
- 1,287,720 people
- By 2030
- 1,364,937 · +6.0%
- By 2040
- 1,506,209 · +17.0%
- By 2050
- 1,624,373 · +26.1%
- By 2075
- 1,853,193 · +43.9%
- By 2100
- 1,901,231 · +47.6%
Race, ethnicity, and origin ACS 2023
- Neighborhood character
- Diverse neighborhood (Simpson 0.70)
- Race & ethnicity
- Hispanic / Latino 48% Two or more races 19% Asian 17% White 16% Black 13% Pacific Islander 1% Native American 1%
- Hispanic origin (detail)
- Mexican 38% Puerto Rican 1%
- Common ancestry
- Italian 1% Russian 1% Lithuanian 1%
- Foreign-born
- 34% · Canada, China, Vietnam
- Languages at home
- 47% English-only · Spanish 37% Tagalog/Filipino 6% Other Indo-European 4%
Political lean MEDSL · Contra Costa
- 2024 margin
- Solid D (+38.0) · D 67.3% · R 29.4% · Other 3.3%
- 2008→2024 swing
- +0.2pp no change · 2008: 37.8pp · 2024: 38.0pp
- All cycles
- 2024: D+38.0 2020: D+45.3 2016: D+43.5 2012: D+33.7 2008: D+37.8
Not yet ingested
- Civics
- —
Market trends
- HPI YoY
- ▼ -478.40%
- Current HPI
- 376.2576
- Rent YoY
- ▲ 1.11%
- Metro
- San Francisco-Oakland-Berkeley, CA
- State GDP YoY
- ▲ 3.21%
- F500 in state
- 116
Industry mix (Fortune 500 HQ in CA)
| Industry | F500 HQs | Revenue |
|---|---|---|
| Technology | 27 | $1,492B |
|
||
| Financial Services | 3 | $174B |
|
||
| Retail | 3 | $44B |
|
||
| Insurance | 3 | $26B |
|
||
| Media / Entertainment | 2 | $115B |
|
||
| Pharmaceuticals / Biotech | 2 | $62B |
|
||
Price history
1 event — show timeline
- 2026-05-28 Listed $185,000 bridgeMLS, Bay East AOR, or Contra Costa AOR
Property tax history
+2.8%/yrLatest (2025): $112 · +6.3% YoY. Source: county tax records.
Cash-flow waterfall
monthlySold comps — $/sqft
last 12 mo · ≤1 miLoading sold comps…