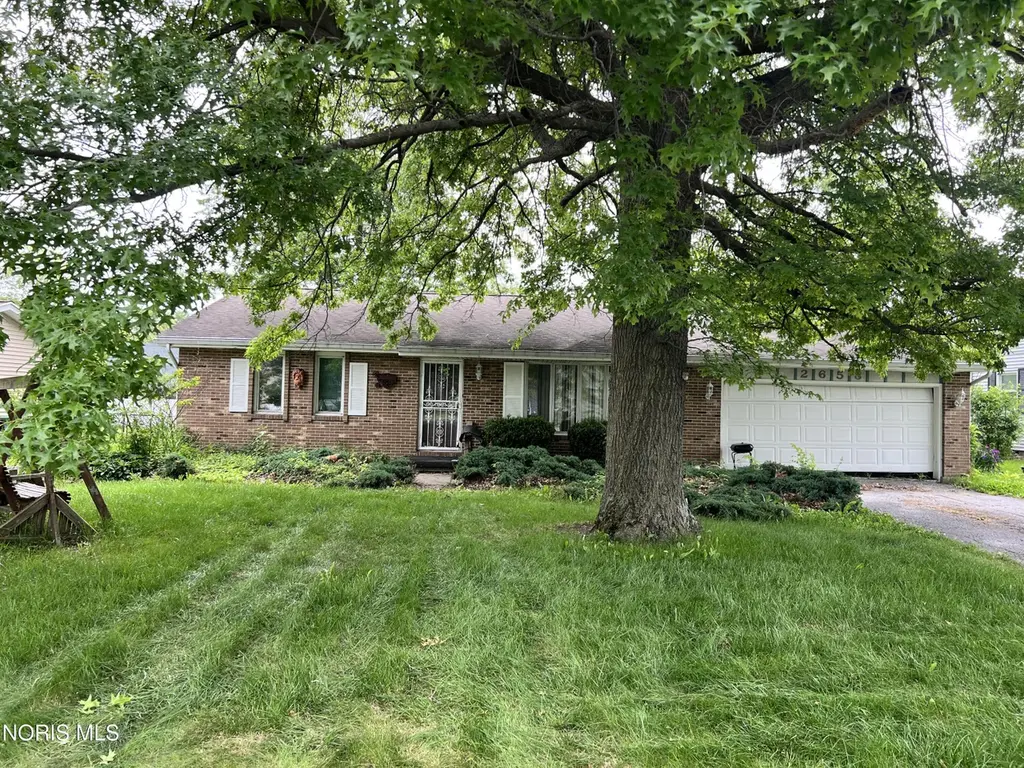
2658 N Cole St · Lima, OH
Flood risk 1/10 · Minimal
- FEMA flood zone
- X (unshaded)
- Chance of flooding over 30 yrs
- 0.0%
- Est. flood insurance / yr
- $473 – $860
Fire risk 1/10 · Minimal
- Est. fire insurance / yr
- $713 – $1,323
Heat risk 3/10 · Minor
- Hot days now (above 100°F)
- 7 days/yr
- Hot days in 30 yrs
- 18 days/yr
Wind risk 2/10 · Minimal
- Chance of severe wind over 30 yrs
- —
Air-quality risk 2/10 · Minimal
- Unhealthy air days now
- 1 days/yr
- Unhealthy air days in 30 yrs
- 2 days/yr
Risk factors via First Street. Map © Google.
Why this score? — see what drove the B grade
The composite is a weighted blend of 9 inputs, each scored 0–100. Each bar is that input's sub-score; the figure is the points it added to the 100-point composite (weight × sub-score).
- Cash flow +30.0/30.0
- 1% rule +10.0/10.0
- DSCR +10.0/10.0
- ARV discount +7.5/15.0
- Schools +5.0/10.0
- Livability +3.2/5.0
- Rent growth +2.5/5.0
- Condition / age +2.5/5.0
- Appreciation +0.0/10.0
$65,000
🖨 Deal sheet 📄 Offer letter ✓ Due diligence
Listing remarks
Online Only Real Estate Auction. Minimum Bid $65,000. Bidding opens June 16th and closes June 29th @ 4pm. This brick home offers 3-bedrooms, 1-bathroom, 1,064 square feet of living space, 2-car garage, and a spacious lot! Whether you're a first-time home buyer, downsizing or looking for an investment opportunity, this property has plenty of potential! Open House Event June 24th 4-6pm. Guaranteed clear title, possession at closing. Info & Terms on Auctioneer's website. 10% Buyer's Premium.
Key facts
- 9,757 sq ft lot
- 2 garage spots
- Built 1978
Property features AI
Exterior
- Parking: Attached 2-car garage; Total parking for 2 vehicles
- Utilities: Cable connected; Electricity connected (150 Amp service); Public water; Public sewer
- Home design: Single-family residence (house); One story; No common walls
- Construction: Brick construction; Crawl space foundation
- Exterior features: Shingle roof; Chain link fencing; Shed(s)
Interior
- Kitchen: Electric range; Refrigerator
- Bedrooms: Bedroom 2 on main level (10 x 10); Bedroom 3 on main level (11 x 9)
- Flooring: Carpet; Vinyl
- Bathrooms: 1 full bathroom
- Heating & cooling: Baseboard heating; Window air conditioning units
- Interior features: Double-pane windows; Storm door(s); Other interior features
- Laundry & utility: Washer; Dryer; Laundry located inside
Neighborhood map
What this means for you Summary
Snapshot
- This is a 3-bed/1.0-bath single-family listed at $65k.
Deal economics
- At list price, monthly cash flow is $653 ($8k/yr) — positive.
- The deal already cash-flows at list — no discount required.
- Meets the 1% rule at list price ($1k rent vs $65k).
- Cap rate 18.4% vs local median 7.7% in Lima — top-decile yield for the area; either an underpriced asset or a hidden risk that comps aren't pricing in. Stress-test before assuming the spread holds.
Location & tenants
- Location reads 64/100 on livability (#787 in OH) — a middle-class / working-renter tenant base. Strengths: cost of living A+, housing A+, health & safety A-; Watch: crime F, amenities F, commute F.
- Elida Local (rural): math 59% / reading 59% proficiency, ranked #311 of 656 in OH (top 47%) — acceptable for families but not a draw, mixed tenant base, ~2y average lease.
- Zoned schools: Elida Elementary (math 73% / reading 61%, grade B+, #456 of 1,584 statewide, top 31%, 1,018 students, 56% FRL); Elida Middle School (math 56% / reading 57%, grade B, #313 of 654 statewide, top 48%, 537 students, 59% FRL); Elida High School (math 47% / reading 62%, grade C-, #303 of 781 statewide, top 42%, 628 students, 42% FRL).
- Market conditions: 74 active listings in the ZIP; 88 units permitted in Allen County in 2024 (0 in 5+ unit buildings).
- This rent runs 32% of the median local income ($52k/yr) — at the standard rent-burdened threshold; future hikes will face affordability resistance.
Forward outlook
- Local home prices are declining (-3.0%/yr); year-one equity from $449 of loan paydown is wiped out by about $2k of value loss. Plan a longer hold.
- Allen County population projected at -14% by 2050 — secular population decline; favor cash flow + early exit over multi-decade hold.
- At projected returns (-3.0% appreciation + 3.0% rent growth), your $18k cash investment doubles in ~3 years — after that, you're playing with house money.
Negotiation context
- Only 3 days on market — expect competitive offers; lowballing is unlikely to land.
Questions for the listing agent
- Built in 1978 — when were the roof, HVAC, electrical panel, plumbing, and water heater last replaced?
- Is there a deadline driving the sale (1031 exchange, divorce, estate, relocation)? That informs how much negotiation room exists.
- Crime grade is F in this area — have there been break-ins, vandalism, or insurance claims at this property in the last 3 years? What carrier currently insures it and at what premium?
- What's the average days-on-market for RENTAL listings here right now (not sales)? A rising rental-DOM trend means longer vacancies and softer asking-rent achievability than the comps imply.
- What's the recent tenant-quality profile in this submarket — average credit score on applications, eviction rate, late-payment / NSF rate, and stable-employment percentage? A property-management company in the area should have these aggregated.
- How much new for-sale + rental construction is in the pipeline within 1–3 miles? Heavy new supply typically softens prices + rents 12–24 months out; constrained supply supports both.
Investment metrics
- 1% rule
- 2.10% ✓
- Cap rate
- 18.36%
- Cash-on-cash
- 43.08%
- DSCR
- 2.92
- GRM
- 4.0
CMA / ARV
- ARV (on-the-fly)
- $173,432
- Comps found
- 6
Show comp detail 6 sales within ~0.75 mi
| Address | Dist | Beds/Ba | Sqft | Sold | Price | $/sf | Match |
|---|---|---|---|---|---|---|---|
| 2286 N Cole St | 0.45mi | 3/1.0 | 1,092 (+3%) | 2mo | $205,000 | $188 | 73 |
| 2351 Burden Dr | 0.49mi | 3/1.0 | 1,044 (-2%) | 6mo | $64,000 | $61 | 69 |
| 2380 Mandolin Dr | 0.40mi | 3/2.0 | 1,120 (+5%) | 1mo | $182,900 | $163 | 68 |
| 1143 Brower Rd | 0.44mi | 3/1.0 | 1,180 (+11%) | 3mo | $179,000 | $152 | 59 |
| 611 St. Clair Ave | 0.63mi | 3/1.0 | 1,190 (+12%) | 11mo | $60,000 | $50 | 42 |
| 2129 Reinell Ave | 0.72mi | 3/2.5 | 1,206 (+13%) | 2mo | $280,000 | $232 | 37 |
Match score weights: distance 35% · size 25% · config 20% · recency 20%. Top-matched comps best support the ARV.
Projected returns pro-forma
-3.0% appreciation · 3.0% rent growth · sell at horizon
- IRR
- 39.9%
- Equity multiple
- 2.71×
- Total profit
- $31,092
- Equity at exit
- $9,692
- IRR
- 46.2%
- Equity multiple
- 5.43×
- Total profit
- $80,692
- Equity at exit
- $5,620
Cash invested: $18,200 (down + closing). Projections, not guarantees.
Landlord ↔ Tenant lean methodology
- Overall (STATE)
- 73 Landlord-Friendly
- State Ohio
- 73 Landlord-Friendly · R+6
- County
- — inherits STATE
- City
- — inherits STATE
ZIP-level market 45801
- Active inventory
- 74
- Price-to-rent
- 4.0×
Monthly cashflow live
- Estimated rent
- $1,367 medium interval (Pro) →
- Mortgage (P&I)
- −$341
- Tax from tax record
- −$59 /mo · $707/yr
- Insurance
- −$27
- HOA
- −$0
- Vacancy / Maint / Mgmt
- −$287
- Net cashflow
- $653
Break-even live
UW: 25.0% down · 7.5% · 30yr · 1.5% tax · 5.0% vac · 8.0% maint · 8.0% mgmt
Financing live
Cash to close
- Down payment
- $16,250
- Closing costs
- $1,950
- Reserves months
- —
- Total cash needed
- —
Loan-product check · same deal, 3 products live
Conventional
25% down · 7.5% · 30yr
- Down + closing
- —
- Monthly P&I
- —
- Monthly cashflow
- —
- DSCR
- —
- Eligible?
- —
Personal DTI + credit; lowest rate.
DSCR
20% down · 8.5% · 30yr
- Down + closing
- —
- Monthly P&I
- —
- Monthly cashflow
- —
- DSCR
- —
- Eligible?
- —
No personal income docs; deal must DSCR.
Hard money
10% down · 12.0% · 12mo
- Down + closing
- —
- Monthly P&I
- —
- Monthly cashflow
- —
- DSCR
- —
- Eligible?
- —
Short-term bridge; refi at stabilization.
Listing history 7 events
-
2026-06-19days on market $65,000 Active 3 DOM
-
2026-06-18days on market $65,000 Active 2 DOM
-
2026-06-16statusdays on market $65,000 Active 1 DOM
-
2026-06-15days on market $65,000 Coming Soon 6 DOM
-
2026-06-14days on market $65,000 Coming Soon 4 DOM
-
2026-06-12remarks 495-char remark
-
2026-06-12$65,000 Coming Soon 3 DOM
ⓘ Source: listings_history table (triggers on properties + properties_extension) + one-shot
backfill from property_details.listing_events for pre-trigger history.
Tax reassessment forecast OH · Partial reset (capped growth)
- Current annual tax
- $707 · $59/mo
- Projected year-2 tax
- $861 · $72/mo
- Expected delta
- +$153/yr (+$13/mo · 21.7%)
ⓘ Screening estimate from a state-policy table — verify with the county assessor before closing.
Climate risk First Street
- Flood 1/10 Low FEMA zone X (unshaded) · 0% chance over 30 yrs
- Wildfire 1/10 Low
- Heat 3/10 Moderate 7 d/yr ≥100°F today · 18 d/yr by 30 yrs out
- Wind 2/10 Low
- Air quality 2/10 Low 1 unhealthy d/yr today · 2 by 30 yrs out
Nearby sold comps map
Loading sold comps map…
Walkable amenities ~0.75 mi
Loading nearby amenities…
Taxation est. · year 1
- Rental income
- $16,410
- − Mortgage interest
- −$3,641
- − Property taxes
- −$707
- − Insurance
- −$325
- − Repairs & maintenance
- −$1,313
- − Management
- −$1,313
- − Depreciation
- −$1,891
- Taxable income
- $7,220
- Est. tax owed @ 24.0%
- −$1,733
- After-tax cash flow
- $6,108/yr
For passive investors: Depreciation is non-cash, so a rental often shows a tax loss while cash-flowing — sheltering income. Rental losses are passive: they offset passive income freely, and up to $25,000/yr can offset ordinary (W-2) income if you actively participate and your MAGI is under $100k (phasing out to $0 by $150k); unused losses carry forward. On sale, claimed depreciation is recaptured at up to 25%, and gains may owe capital-gains tax (a 1031 exchange can defer both). Figures are a year-1 estimate at your 24.0% rate — not tax advice; consult a CPA.
Schools (NCES district)
- District
- Elida Local
- NCES district ID
- 3904577
- Math proficiency
- 59% ▼ -11.00%
- Reading proficiency
- 59% ▼ -7.00%
- Median HH income
- $46,632
- Composite
- 49.93/100
- National rank
- #1934
- State rank
- #311 of 656 in OH
Livability — Lima
- Score
- 64/100
- State rank
- #787
- US rank
- #14288
Category grades
Schools grade is shown separately in the Schools card above.
Census & demographics
- Census place
- Lima, OH
- County
- Allen County · 21,739 people
- City population
- 21,739
- Metro
- Lima, OH
- Population (ZIP)
- 21,739
- Household income
- $51,731
- Rent vs Own
- Severe rent burden
- 1141.0
Population outlook (Allen County) Hauer SSP2
- Today (2025)
- 100,321 people
- By 2030
- 97,693 · -2.6%
- By 2040
- 91,802 · -8.5%
- By 2050
- 86,152 · -14.1%
- By 2075
- 73,659 · -26.6%
- By 2100
- 58,716 · -41.5%
Race, ethnicity, and origin ACS 2023
- Neighborhood character
- Predominantly White (71%)
- Race & ethnicity
- White 71% Black 14% Two or more races 8% Hispanic / Latino 6% Asian 1%
- Hispanic origin (detail)
- Mexican 5%
- Common ancestry
- Lithuanian 2% Italian 1% Iranian 1%
- Foreign-born
- 2% · Canada, China
- Languages at home
- 96% English-only · Spanish 2%
Political lean MEDSL · Allen
- 2024 margin
- Solid R (+44.1) · D 27.5% · R 71.6%
- 2008→2024 swing
- -23.4pp toward R · 2008: -20.7pp · 2024: -44.1pp
- All cycles
- 2024: R+44.1 2020: R+39.5 2016: R+38.2 2012: R+25.7 2008: R+20.7
Not yet ingested
- Civics
- —
Market trends
- HPI YoY
- ▼ -164.79%
- Current HPI
- 219.5329
- Rent YoY
- —
- Metro
- Lima, OH
- State GDP YoY
- ▲ 1.98%
- F500 in state
- 48
Industry mix (Fortune 500 HQ in OH)
| Industry | F500 HQs | Revenue |
|---|---|---|
| Insurance | 3 | $145B |
|
||
| Industrial Machinery | 3 | $49B |
|
||
| Financial Services | 3 | $24B |
|
||
| Consumer Goods | 2 | $93B |
|
||
| Aerospace / Defense | 2 | $47B |
|
||
| Utilities | 2 | $33B |
|
||
Price history
1 event — show timeline
- 2026-06-10 Coming Soon $65,000 NORIS
Property tax history
+1.8%/yrLatest (2025): $707 · -2.8% YoY. Source: county tax records.
Cash-flow waterfall
monthlySold comps — $/sqft
last 12 mo · ≤1 miLoading sold comps…