 Multi-family
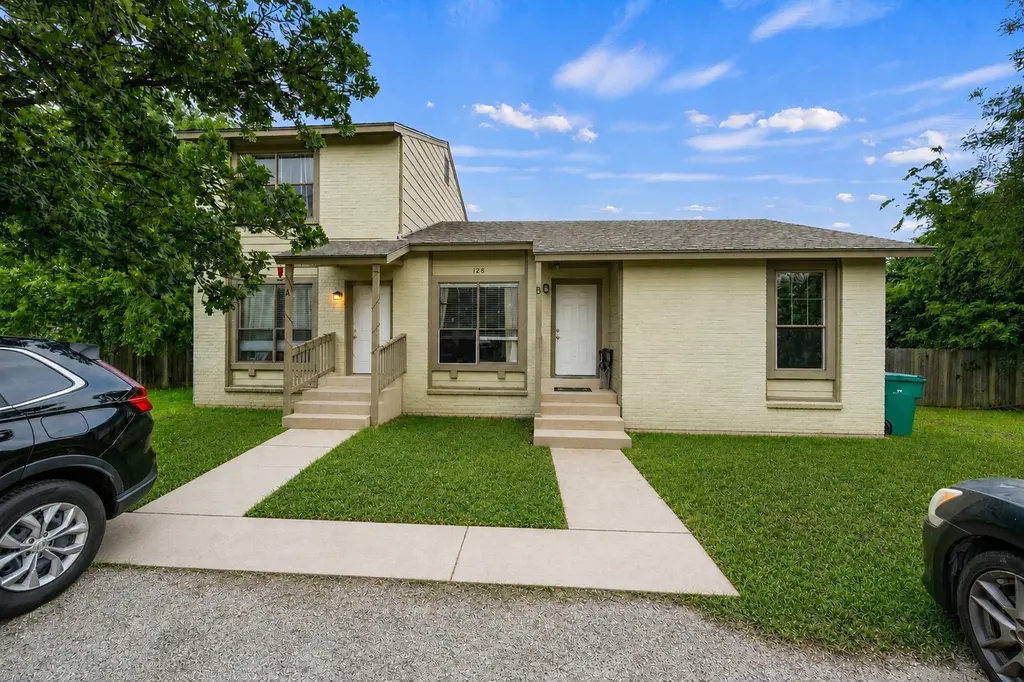
128 Hillside Dr · Elgin, TX
Flood risk 1/10 · Minimal
- FEMA flood zone
- X (unshaded)
- Chance of flooding over 30 yrs
- 0.0%
- Est. flood insurance / yr
- $507 – $1,088
Fire risk 4/10 · Minor
- Est. fire insurance / yr
- $1,222 – $2,270
Heat risk 8/10 · Major
- Hot days now (above 109°F)
- 7 days/yr
- Hot days in 30 yrs
- 23 days/yr
Wind risk 8/10 · Major
- Chance of severe wind over 30 yrs
- 80.0%
Air-quality risk 1/10 · Minimal
- Unhealthy air days now
- 0 days/yr
- Unhealthy air days in 30 yrs
- 0 days/yr
Risk factors via First Street. Map © Google.
Why this score? — see what drove the C- grade
The composite is a weighted blend of 9 inputs, each scored 0–100. Each bar is that input's sub-score; the figure is the points it added to the 100-point composite (weight × sub-score).
- Cash flow +13.6/30.0
- Appreciation +10.0/10.0
- ARV discount +7.3/15.0
- 1% rule +4.2/10.0
- DSCR +4.1/10.0
- Livability +3.7/5.0
- Rent growth +3.3/5.0
- Condition / age +2.5/5.0
- Schools +2.0/10.0
$289,000
🖨 Deal sheet 📄 Offer letter ✓ Due diligence
Multi-family units
County records classify this as Multi-Family (2-4 Unit). Listing-text estimate: 1 unit. estimate disagrees with records
Listing remarks MLS
Duplex for Sale walking distance to downtown Elgin! Side B has long term tenants (2/1 single level- 795 sq. ft) and has new AC and fence. Rented at $810/mo. Side A (2/1 - 896 sq. ft - beds are up, living and kitchen down) is occupied month-to-month at $900/mo. Has new water heater. Both could be mildly updated and rented between $950-1100. Great as a personal purchase or investment.
Key facts
- Ample parking
- Private backyard
- Upgraded kitchen
Tags
Property features AI
Finance
- Financial info: Two-unit property; Total actual rent: $2,500; Unit A actual rent: $1,350 (deposit $1,350) — leased through May 31, 2026; Unit B actual rent: $1,150 (deposit $1,075) — leased through August 30, 2026; Pets: negotiable; Owner pays: see remarks
Exterior
- Parking: Asphalt driveway; Parking for 4 vehicles
- Utilities: Electricity available and connected; Public water connected; Public sewer
- Home design: Two-story building; Faces south; Resale property
- Construction: Brick, HardiPlank type, and wood siding; Composition roof; Pillar/post/pier foundation; Built (year per public records)
- Exterior features: Rear porch; Front porch; Fenced yard (wood)
Interior
- Kitchen: Free-standing range; Dishwasher; Garbage disposal; Refrigerator; Eat-in kitchen
- Bedrooms: Two 2-bedroom units (Unit A and Unit B)
- Flooring: Carpet; Vinyl
- Bathrooms: Unit A: 2 bathrooms (1 full, 1 half); Unit B: 1 full bathroom
- Heating & cooling: Central heating (electric); Central air conditioning (electric)
- Interior features: Ceiling fan(s); Eat-in kitchen; Vinyl windows
- Laundry & utility: Washer and dryer included; Laundry available in multiple locations; Electric water heater
Neighborhood map
What this means for you Summary
Snapshot
- This is a 4-bed/2.5-bath multifamily listed at $289k.
Deal economics
- At list price, monthly cash flow is $17 ($198/yr) — positive.
- The deal already cash-flows at list — no discount required.
- To meet the 1% rule (rent ≥ 1% of price), the offer needs to be $266k (8.1% below list).
- Recommended offer: $266k (8.1% below list) — sets the bar for 1% rule.
- Cap rate 6.4% vs local median 4.4% in Elgin — top-decile yield for the area; either an underpriced asset or a hidden risk that comps aren't pricing in. Stress-test before assuming the spread holds.
Location & tenants
- Location reads 74/100 on livability (#167 in TX, #4,404 nationally) — a middle-class / working-renter tenant base. Strengths: cost of living A+, housing A+, health & safety A+; Watch: schools F, amenities F, commute F.
- Elgin ISD (rural): math 17% / reading 26% proficiency, ranked #741 of 826 in TX (top 90%) — low school quality limits family demand, transient renter base, plan for 1-2y turnover; 67% free/reduced lunch — lower-income household profile, screen leases tightly.
- Market conditions: Rents rising (+3.1%/yr); 807 active listings in the ZIP; 1 comparable units currently listed for rent nearby; solid renter incomes; 1,841 units permitted in Bastrop County in 2024 (150 in 5+ unit buildings).
- This rent runs 32% of the median local income ($99k/yr) — at the standard rent-burdened threshold; future hikes will face affordability resistance.
Forward outlook
- In year one you build about $31k of equity ($2k loan paydown + $29k appreciation (10.0% local appreciation)).
- Bastrop County population projected at +37% by 2050 — long-run rental-demand tailwind backs the buy-and-hold thesis.
- At projected returns (10.0% appreciation + 3.1% rent growth), your $81k cash investment doubles in ~3 years — after that, you're playing with house money.
- By year 2, paydown + projected appreciation supports a ~$50k cash-out refi (75% LTV) — recoverable capital for the next deal without selling this one.
Negotiation context
- It's been on market 39 days — a 3% lower offer ($280k) is reasonable based on typical stale-listing flexibility.
- 7 sale attempts since 28y ago with the ask held roughly flat each time — persistent listings suggest the price (not the market) is what's stuck; bring a comps-based counter.
Risks & watch-outs
- Climate carrying-cost: severe wind risk, 80% chance of damaging wind over 30y; extreme-heat days projected 7→23/yr by 2055 (HVAC capex compounding) — expect insurance premiums to compound above CPI over the hold.
Questions for the listing agent
- It's been on market 39 days. Have you received any prior offers? Is the seller open to a 8% concession, seller financing, or rate buy-down credit?
- Is there a deadline driving the sale (1031 exchange, divorce, estate, relocation)? That informs how much negotiation room exists.
- Schools are F-rated, which usually means shorter tenancies and higher turnover. Who's the typical renter profile here, and what's been the actual vacancy rate?
- What's the average days-on-market for RENTAL listings here right now (not sales)? A rising rental-DOM trend means longer vacancies and softer asking-rent achievability than the comps imply.
- What's the recent tenant-quality profile in this submarket — average credit score on applications, eviction rate, late-payment / NSF rate, and stable-employment percentage? A property-management company in the area should have these aggregated.
- How much new apartment / multifamily construction is in the pipeline within 1–3 miles? Heavy new supply (>2% of stock underway) typically softens rents 12–24 months out; light construction supports rent growth.
Investment metrics
- 1% rule
- 0.92% ✗
- Cap rate
- 6.36%
- Cash-on-cash
- 0.25%
- DSCR
- 1.01
- GRM
- 9.1
CMA / ARV
- ARV (median comp)
- $287,694
- List price
- $289,000
- Delta
- 0.45%
- Verdict
- FAIR
- Comps
- 12 within 1.0 mi
Projected returns pro-forma
10.0% appreciation · 3.12% rent growth · sell at horizon
- IRR
- 24.5%
- Equity multiple
- 2.96×
- Total profit
- $158,862
- Equity at exit
- $260,354
- IRR
- 21.7%
- Equity multiple
- 6.78×
- Total profit
- $467,832
- Equity at exit
- $561,463
Cash invested: $80,920 (down + closing). Projections, not guarantees.
Landlord ↔ Tenant lean methodology
- Overall (STATE)
- 87 Strongly Landlord-Friendly
- State Texas
- 87 Strongly Landlord-Friendly · R+5
- County
- — inherits STATE
- City
- — inherits STATE
ZIP-level market 78621
- Home prices YoY
- 7.6%
- Rents YoY
- 3.1%
- Active inventory
- 807
- Price-to-rent
- 18.1×
Monthly cashflow live
- Estimated rent
- $2,655 medium interval (Pro) →
- Mortgage (P&I)
- −$1,516
- Tax from tax record
- −$445 /mo · $5,339/yr
- Insurance
- −$120
- HOA
- −$0
- Vacancy / Maint / Mgmt
- −$558
- Net cashflow
- $17
Break-even live
2-unit breakdown (identical units grouped — click to expand)
| Units | Beds | Baths | Est. rent |
|---|---|---|---|
| 1× unit | 2 | 1.5 | $1,327 |
| 1× unit | 2 | 1 | $1,327 |
| Total (2 units) | $2,655 | ||
UW: 25.0% down · 7.5% · 30yr · 1.5% tax · 5.0% vac · 8.0% maint · 8.0% mgmt
Financing live
Cash to close
- Down payment
- $72,250
- Closing costs
- $8,670
- Reserves months
- —
- Total cash needed
- —
Loan-product check · same deal, 3 products live
Conventional
25% down · 7.5% · 30yr
- Down + closing
- —
- Monthly P&I
- —
- Monthly cashflow
- —
- DSCR
- —
- Eligible?
- —
Personal DTI + credit; lowest rate.
DSCR
20% down · 8.5% · 30yr
- Down + closing
- —
- Monthly P&I
- —
- Monthly cashflow
- —
- DSCR
- —
- Eligible?
- —
No personal income docs; deal must DSCR.
Hard money
10% down · 12.0% · 12mo
- Down + closing
- —
- Monthly P&I
- —
- Monthly cashflow
- —
- DSCR
- —
- Eligible?
- —
Short-term bridge; refi at stabilization.
Rent comps 1 comps
| Address | Beds | Baths | Sqft | Rent | $/sqft | DOM | Units | Dist |
|---|---|---|---|---|---|---|---|---|
| 110 S Main St #104 Elgin, TX | 3.0 | 2.0 | 1061 | $1,700 | $1.60 | 43d | 1 | 0.43mi |
Listing history 36 events
-
2026-06-18days on market $289,000 Active 39 DOM
-
2026-06-17days on market $289,000 Active 38 DOM
-
2026-06-16days on market $289,000 Active 37 DOM
-
2026-06-15days on market $289,000 Active 36 DOM
-
2026-06-13pricedays on market $289,000 Active 34 DOM
-
2026-06-09days on market $278,000 Active 30 DOM
-
2026-06-08days on market $278,000 Active 29 DOM
-
2026-06-07days on market $278,000 Active 28 DOM
-
2026-06-04days on market $278,000 Active 25 DOM
-
2026-06-03days on market $278,000 Active 24 DOM
-
2026-06-02days on market $278,000 Active 23 DOM
-
2026-06-02price $278,000 Active 22 DOM
-
2026-06-01days on market $292,500 Active 22 DOM
-
2026-05-31days on market $292,500 Active 21 DOM
-
2026-05-10$292,500 Active 598-char remark
-
2022-08-15soldstatus
-
2022-08-15soldstatus
-
2022-08-10soldstatus Closed 385-char remark
Show marketing remark (385 chars)
Duplex for Sale walking distance to downtown Elgin! Side B has long term tenants (2/1 single level- 795 sq. ft) and has new AC and fence. Rented at $810/mo. Side A (2/1 - 896 sq. ft - beds are up, living and kitchen down) is occupied month-to-month at $900/mo. Has new water heater. Both could be mildly updated and rented between $950-1100. Great as a personal purchase or investment.
-
2022-07-08status Pending 385-char remark
Show marketing remark (385 chars)
Duplex for Sale walking distance to downtown Elgin! Side B has long term tenants (2/1 single level- 795 sq. ft) and has new AC and fence. Rented at $810/mo. Side A (2/1 - 896 sq. ft - beds are up, living and kitchen down) is occupied month-to-month at $900/mo. Has new water heater. Both could be mildly updated and rented between $950-1100. Great as a personal purchase or investment.
-
2022-07-06historical Active Under Contract 385-char remark
Show marketing remark (385 chars)
Duplex for Sale walking distance to downtown Elgin! Side B has long term tenants (2/1 single level- 795 sq. ft) and has new AC and fence. Rented at $810/mo. Side A (2/1 - 896 sq. ft - beds are up, living and kitchen down) is occupied month-to-month at $900/mo. Has new water heater. Both could be mildly updated and rented between $950-1100. Great as a personal purchase or investment.
-
2022-06-14status Active 385-char remark
Show marketing remark (385 chars)
Duplex for Sale walking distance to downtown Elgin! Side B has long term tenants (2/1 single level- 795 sq. ft) and has new AC and fence. Rented at $810/mo. Side A (2/1 - 896 sq. ft - beds are up, living and kitchen down) is occupied month-to-month at $900/mo. Has new water heater. Both could be mildly updated and rented between $950-1100. Great as a personal purchase or investment.
-
2022-06-07historical Active Under Contract 385-char remark
Show marketing remark (385 chars)
Duplex for Sale walking distance to downtown Elgin! Side B has long term tenants (2/1 single level- 795 sq. ft) and has new AC and fence. Rented at $810/mo. Side A (2/1 - 896 sq. ft - beds are up, living and kitchen down) is occupied month-to-month at $900/mo. Has new water heater. Both could be mildly updated and rented between $950-1100. Great as a personal purchase or investment.
-
2022-06-02$275,000 Active 385-char remark
Show marketing remark (385 chars)
Duplex for Sale walking distance to downtown Elgin! Side B has long term tenants (2/1 single level- 795 sq. ft) and has new AC and fence. Rented at $810/mo. Side A (2/1 - 896 sq. ft - beds are up, living and kitchen down) is occupied month-to-month at $900/mo. Has new water heater. Both could be mildly updated and rented between $950-1100. Great as a personal purchase or investment.
-
2020-06-08soldstatus
-
2020-05-02status Pending - Taking Backups
-
2020-04-22historical Withdrawn
-
2020-03-30Active
-
2005-03-15soldstatus
-
2004-10-21historical
-
2004-08-02$69,900
-
2003-07-02soldstatus
-
2003-06-19historical
-
2003-06-15$205,000
-
1999-08-01soldstatus
-
1999-04-01historical
-
1998-08-19$60,000
ⓘ Source: listings_history table (triggers on properties + properties_extension) + one-shot
backfill from property_details.listing_events for pre-trigger history.
Tax reassessment forecast TX · Resets to sale price
- Current annual tax
- $5,339 · $445/mo
- Projected year-2 tax
- $5,339 · $445/mo
- Expected delta
- $0/yr ($0/mo · 0.0%)
ⓘ Screening estimate from a state-policy table — verify with the county assessor before closing.
Climate risk First Street
- Flood 1/10 Low FEMA zone X (unshaded) · 0% chance over 30 yrs
- Wildfire 4/10 Moderate
- Heat 8/10 Severe 7 d/yr ≥109°F today · 23 d/yr by 30 yrs out
- Wind 8/10 Severe 80% chance of damaging wind over 30 yrs
- Air quality 1/10 Low 0 unhealthy d/yr today · 0 by 30 yrs out
Nearby sold comps map
Loading sold comps map…
Walkable amenities ~0.75 mi
Loading nearby amenities…
Taxation est. · year 1
- Rental income
- $31,860
- − Mortgage interest
- −$16,188
- − Property taxes
- −$5,339
- − Insurance
- −$1,445
- − Repairs & maintenance
- −$2,549
- − Management
- −$2,549
- − Depreciation
- −$8,407
- Taxable loss
- −$4,618
- Est. tax savings @ 24.0%
- +$1,108
- After-tax cash flow
- $1,307/yr
For passive investors: Depreciation is non-cash, so a rental often shows a tax loss while cash-flowing — sheltering income. Rental losses are passive: they offset passive income freely, and up to $25,000/yr can offset ordinary (W-2) income if you actively participate and your MAGI is under $100k (phasing out to $0 by $150k); unused losses carry forward. On sale, claimed depreciation is recaptured at up to 25%, and gains may owe capital-gains tax (a 1031 exchange can defer both). Figures are a year-1 estimate at your 24.0% rate — not tax advice; consult a CPA.
Schools (NCES district)
- District
- Elgin ISD
- NCES district ID
- 4818360
- Math proficiency
- 17% ▼ -9.00%
- Reading proficiency
- 26% ▼ -5.00%
- Median HH income
- $55,176
- Composite
- 19.62/100
- National rank
- #8749
- State rank
- #741 of 826 in TX
Livability — Elgin
- Score
- 74/100
- State rank
- #167
- US rank
- #4404
Category grades
Schools grade is shown separately in the Schools card above.
Census & demographics
- Census place
- Elgin, TX
- County
- Bastrop County · 68,601 people
- City population
- 27,860
- Metro
- Austin-Round Rock-Georgetown, TX
- Population (ZIP)
- 30,411
- Household income
- $98,534
- Rent vs Own
- Severe rent burden
- 235.0
Population outlook (Bastrop County) Hauer SSP2
- Today (2025)
- 94,260 people
- By 2030
- 101,355 · +7.5%
- By 2040
- 115,578 · +22.6%
- By 2050
- 129,464 · +37.3%
- By 2075
- 168,068 · +78.3%
- By 2100
- 194,857 · +106.7%
Race, ethnicity, and origin ACS 2023
- Neighborhood character
- Diverse neighborhood (Simpson 0.64)
- Race & ethnicity
- Hispanic / Latino 46% White 38% Two or more races 19% Black 11% Native American 1%
- Hispanic origin (detail)
- Mexican 38%
- Common ancestry
- Slovak 2% Italian 2% Romanian 1%
- Foreign-born
- 17% · Canada, Vietnam
- Languages at home
- 63% English-only · Spanish 36%
Political lean MEDSL · Bastrop
- 2024 margin
- R (+18.4) · D 40.2% · R 58.6% · Other 1.2%
- 2008→2024 swing
- -10.2pp toward R · 2008: -8.2pp · 2024: -18.4pp
- All cycles
- 2024: R+18.4 2020: R+13.8 2016: R+20.4 2012: R+17.0 2008: R+8.2
Not yet ingested
- Civics
- —
Market trends
- HPI YoY
- ▲ 29.47%
- Current HPI
- 416.87
- Rent YoY
- ▲ 3.12%
- Metro
- Austin-Round Rock-Georgetown, TX
- State GDP YoY
- ▲ 3.95%
- F500 in state
- 110
Industry mix (Fortune 500 HQ in TX)
| Industry | F500 HQs | Revenue |
|---|---|---|
| Energy | 16 | $1,198B |
|
||
| Technology | 5 | $198B |
|
||
| Engineering / Construction | 4 | $72B |
|
||
| Energy Services | 3 | $60B |
|
||
| Utilities | 3 | $41B |
|
||
| Healthcare | 2 | $330B |
|
||
Price history
+381.7% since first listed24 events — show timeline
- 2026-06-11 Price Changed $289,000 Unlock MLS
- 2026-06-02 Price Changed $278,000 Unlock MLS
- 2026-05-10 Listed $292,500 Unlock MLS
- 2022-08-15 Sold (Public Records) — Public Records
- 2022-08-15 Sold (Public Records) — Public Records
- 2022-08-10 Sold (MLS) — Unlock MLS
- 2022-07-08 Pending — Unlock MLS
- 2022-07-06 Contingent — Unlock MLS
- 2022-06-14 Relisted — Unlock MLS
- 2022-06-07 Contingent — Unlock MLS
- 2022-06-02 Listed $275,000 Unlock MLS
- 2020-06-08 Sold (Public Records) — Public Records
- 2020-05-02 Pending — Unlock MLS
- 2020-04-22 Delisted — Unlock MLS
- 2020-03-30 Listed — Unlock MLS
- 2005-03-15 Sold (MLS) — Unlock MLS
- 2004-10-21 Delisted — Unlock MLS
- 2004-08-02 Listed $69,900 Unlock MLS
- 2003-07-02 Sold (MLS) — Unlock MLS
- 2003-06-19 Delisted — Unlock MLS
- 2003-06-15 Listed $205,000 Unlock MLS
- 1999-08-01 Sold (MLS) — Unlock MLS
- 1999-04-01 Delisted — Unlock MLS
- 1998-08-19 Listed $60,000 Unlock MLS
Property tax history
+6.6%/yrLatest (2026): $5,339 · -6.9% YoY. Source: county tax records.
Cash-flow waterfall
monthlySold comps — $/sqft
last 12 mo · ≤1 miLoading sold comps…