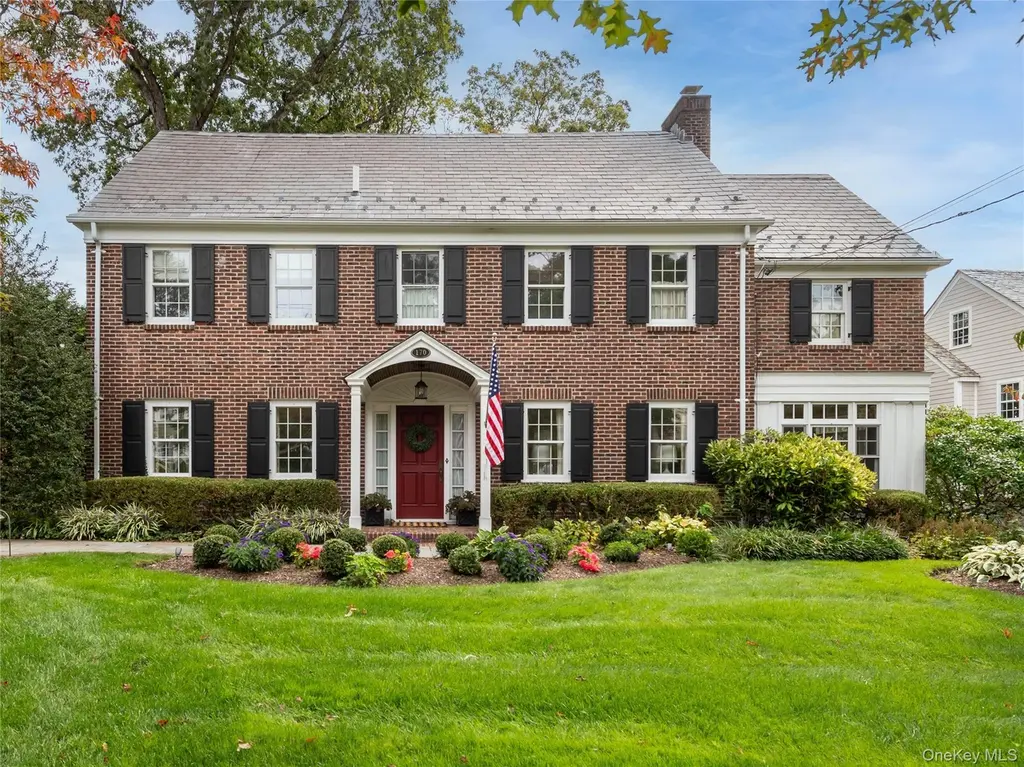
170 Manhasset Woods Rd · Munsey Park, NY
Flood risk 1/10 · Minimal
- FEMA flood zone
- X (unshaded)
- Chance of flooding over 30 yrs
- 0.0%
- Est. flood insurance / yr
- $473 – $860
Fire risk 3/10 · Minor
- Est. fire insurance / yr
- $691 – $1,283
Heat risk 5/10 · Moderate
- Hot days now (above 98°F)
- 7 days/yr
- Hot days in 30 yrs
- 15 days/yr
Wind risk 6/10 · Moderate
- Chance of severe wind over 30 yrs
- 27.0%
Air-quality risk 4/10 · Minor
- Unhealthy air days now
- 6 days/yr
- Unhealthy air days in 30 yrs
- 7 days/yr
Risk factors via First Street. Map © Google.
Why this score? — see what drove the D- grade
The composite is a weighted blend of 9 inputs, each scored 0–100. Each bar is that input's sub-score; the figure is the points it added to the 100-point composite (weight × sub-score).
- Schools +8.3/10.0
- Appreciation +7.7/10.0
- ARV discount +7.1/15.0
- Cash flow +4.5/30.0
- Livability +3.8/5.0
- Rent growth +2.5/5.0
- Condition / age +2.5/5.0
- 1% rule +0.0/10.0
- DSCR +0.0/10.0
$3,198,000
🖨 Deal sheet 📄 Offer letter ✓ Due diligence
Listing remarks
Quintessential Munsey Park - this stately, grand brick colonial will impress you with its spacious rooms and high quality finishes, while feeling like the home you have been dreaming about from the moment you enter. The first floor provides all the important rooms to gather, celebrate and enjoy life's special moments. From the formal living and dining rooms, ideal for holidays and cocktail parties, to the custom kitchen, great room, and secluded family room where you can take in a movie or curl up with a book in a cozy nook, it's not easy to pick a favorite spot. Having a bespoke mudroom/laundry room with garage access completes the practicality of the first floor. Upstairs, the serene prim
Key facts
- 0.25 acre lot
- Garage
- Built 1933
Property features AI
Exterior
- Parking: Driveway; Garage with 1 garage space
- Security: Security system; Smoke detector(s)
- Utilities: PSEG electric; Natural gas connected; Water connected; Sewer: Cesspool; Cable connected; Trash collection (public)
- Home design: Single family residence; Updated / Remodeled
- Construction: Brick construction
- Exterior features: Brick construction; Patio; Security system; Smoke detectors
Interior
- Kitchen: Convection oven; Gas oven; Dishwasher; Microwave
- Bedrooms: 9 total rooms (includes bedrooms and living spaces)
- Flooring: Hardwood flooring
- Bathrooms: 4 full bathrooms; 1 half bathroom
- Heating & cooling: Natural gas heating; Central air conditioning
- Interior features: Built-in features; Chandelier; Chef's kitchen; Crown molding; Double vanity; Eat-in kitchen; Formal dining; Kitchen island; Marble counters; Pantry; Primary bathroom; Recessed lighting; Soaking tub; Walk-in closets; Wet bar; Finished basement; Pull-down attic stairs; Patio
- Laundry & utility: Washer; Dryer; Dedicated laundry room
Neighborhood map
What this means for you Summary
Snapshot
- This is a 4-bed/3.5-bath single-family listed at $3.20M.
Deal economics
- At list price, monthly cash flow is $-8k ($-99k/yr) — negative.
- To cash-flow at today's rent, offer at most $1.74M (45.7% below list).
- To meet the 1% rule (rent ≥ 1% of price), the offer needs to be $1.50M (53.1% below list).
- Recommended offer: $1.50M (53.1% below list) — sets the bar for 1% rule.
Location & tenants
- Location reads 76/100 on livability (#223 in NY, #3,484 nationally) — a middle-class / working-renter tenant base. Strengths: crime A+, commute A+, employment A+; Watch: amenities D+, cost of living F.
- Manhasset Union Free School District (suburban): math 86% / reading 84% proficiency, ranked #8 of 590 in NY (top 1%) — strong family-tenant draw, lease renewals of 3-5y typical; only 4% free/reduced lunch — higher-income household profile.
- Zoned schools: Munsey Park Elementary School (math 82% / reading 87%, grade A+, #93 of 2,108 statewide, top 6%, 863 students, 7% FRL); Manhasset Middle School (math 84% / reading 79%, grade A+, #22 of 729 statewide, top 3%, 521 students, 6% FRL); Manhasset Secondary School (math 100% / reading 87%, grade A+, #141 of 1,100 statewide, top 13%, 962 students, 8% FRL) — zoned schools at 7% FRL track the district average.
- Market conditions: 118 active listings in the ZIP; 2 comparable units currently listed for rent nearby; 824 units permitted in Nassau County in 2024 (153 in 5+ unit buildings).
Forward outlook
- In year one you build about $194k of equity ($22k loan paydown + $172k appreciation (5.4% local appreciation)).
- Nassau County population projected at +7% by 2050 — modest demand growth; plan on rents tracking national, not racing it.
- By year 2, paydown + projected appreciation supports a ~$311k cash-out refi (75% LTV) — recoverable capital for the next deal without selling this one.
Negotiation context
- Only 7 days on market — expect competitive offers; lowballing is unlikely to land.
- Current owner paid $850k; list at $3.20M implies a 276% gain — meaningful room to come down on a strong offer.
Risks & watch-outs
- Watch-outs: built in 1933 — expect roof / HVAC / electrical / plumbing capex.
- Climate carrying-cost: major wind risk, 27% chance of damaging wind over 30y; extreme-heat days projected 7→15/yr by 2055 (HVAC capex compounding) — expect insurance premiums to compound above CPI over the hold.
Questions for the listing agent
- What do current leases actually rent for vs. the listed asking? Can we see a recent rent roll and the last 12 months of T-12 income?
- Built in 1933 — when were the roof, HVAC, electrical panel, plumbing, and water heater last replaced?
- Is there a deadline driving the sale (1031 exchange, divorce, estate, relocation)? That informs how much negotiation room exists.
- Schools are B-rated — typically a magnet for longer-tenancy family renters. What's the average tenant stay here, and is there a school-zone premium baked into asking?
- The area grade is low — what's the realistic commute time and amenity access for the typical tenant pool here? Any planned neighborhood developments (good or bad) we should know about?
- What's the average days-on-market for RENTAL listings here right now (not sales)? A rising rental-DOM trend means longer vacancies and softer asking-rent achievability than the comps imply.
- What's the recent tenant-quality profile in this submarket — average credit score on applications, eviction rate, late-payment / NSF rate, and stable-employment percentage? A property-management company in the area should have these aggregated.
- How much new for-sale + rental construction is in the pipeline within 1–3 miles? Heavy new supply typically softens prices + rents 12–24 months out; constrained supply supports both.
Investment metrics
- 1% rule
- 0.47% ✗
- Cap rate
- 3.19%
- Cash-on-cash
- -11.10%
- DSCR
- 0.51
- GRM
- 17.8
CMA / ARV
- ARV (on-the-fly)
- $3,168,125
- Comps found
- 12
Show comp detail 12 sales within ~0.75 mi
| Address | Dist | Beds/Ba | Sqft | Sold | Price | $/sf | Match |
|---|---|---|---|---|---|---|---|
| 74 Eakins Rd | 0.13mi | 4/2.5 | 3,168 (-8%) | 7mo | $2,600,000 | $821 | 72 |
| 137 Remington Rd | 0.24mi | 4/4.0 | 3,258 (-5%) | 9mo | $3,013,700 | $925 | 71 |
| 336 Nassau Ave | 0.29mi | 4/3.5 | 3,277 (-4%) | 11mo | $2,700,000 | $824 | 70 |
| 45 Mason Dr | 0.33mi | 5/3.5 (+1) | 3,579 (+4%) | 8mo | $3,500,000 | $978 | 65 |
| 22 Homer Pl | 0.36mi | 4/4.5 | 3,200 (-7%) | 10mo | $3,255,022 | $1,017 | 60 |
| 39 Hawthorne Pl | 0.27mi | 5/3.5 (+1) | 3,019 (-12%) | 4mo | $3,135,000 | $1,038 | 59 |
| 77 Crabapple Rd | 0.72mi | 4/3.5 | 3,406 (-1%) | 9mo | $3,700,000 | $1,086 | 58 |
| 67 Village Rd | 0.64mi | 4/2.5 | 3,257 (-5%) | 9mo | $2,425,000 | $745 | 50 |
| 52 Northwoods Rd | 0.33mi | 4/4.5 | 3,912 (+14%) | 10mo | $3,175,000 | $812 | 49 |
| 32 Barnard Pl | 0.51mi | 4/2.5 | 2,986 (-13%) | 3mo | $2,888,000 | $967 | 48 |
| 44 Mountain Cut | 0.65mi | 5/3.5 (+1) | 3,185 (-7%) | 8mo | $2,600,000 | $816 | 47 |
| 57 Aldershot Ln | 0.70mi | 5/5.5 (+1) | 3,700 (+8%) | 8mo | $3,375,000 | $912 | 34 |
Match score weights: distance 35% · size 25% · config 20% · recency 20%. Top-matched comps best support the ARV.
Projected returns pro-forma
5.38% appreciation · 3.0% rent growth · sell at horizon
- IRR
- 4.7%
- Equity multiple
- 1.31×
- Total profit
- $278,824
- Equity at exit
- $1,886,759
- IRR
- 7.2%
- Equity multiple
- 2.41×
- Total profit
- $1,266,228
- Equity at exit
- $3,319,615
Cash invested: $895,440 (down + closing). Projections, not guarantees.
Landlord ↔ Tenant lean methodology
- Overall (STATE)
- 15 Strongly Tenant-Friendly
- State New York
- 15 Strongly Tenant-Friendly · D+10
- County
- — inherits STATE
- City
- — inherits STATE
ZIP-level market 11030
- Home prices YoY
- 1.9%
- Active inventory
- 118
- Price-to-rent
- 17.8×
Monthly cashflow live
- Estimated rent
- $14,987 medium interval (Pro) →
- Mortgage (P&I)
- −$16,771
- Tax from tax record
- −$2,016 /mo · $24,186/yr
- Insurance
- −$1,332
- HOA
- −$0
- Vacancy / Maint / Mgmt
- −$3,147
- Net cashflow
- $-8,279
Break-even live
UW: 25.0% down · 7.5% · 30yr · 1.5% tax · 5.0% vac · 8.0% maint · 8.0% mgmt
Financing live
Cash to close
- Down payment
- $799,500
- Closing costs
- $95,940
- Reserves months
- —
- Total cash needed
- —
Loan-product check · same deal, 3 products live
Conventional
25% down · 7.5% · 30yr
- Down + closing
- —
- Monthly P&I
- —
- Monthly cashflow
- —
- DSCR
- —
- Eligible?
- —
Personal DTI + credit; lowest rate.
DSCR
20% down · 8.5% · 30yr
- Down + closing
- —
- Monthly P&I
- —
- Monthly cashflow
- —
- DSCR
- —
- Eligible?
- —
No personal income docs; deal must DSCR.
Hard money
10% down · 12.0% · 12mo
- Down + closing
- —
- Monthly P&I
- —
- Monthly cashflow
- —
- DSCR
- —
- Eligible?
- —
Short-term bridge; refi at stabilization.
Rent comps 2 comps
| Address | Beds | Baths | Sqft | Rent | $/sqft | DOM | Units | Dist |
|---|---|---|---|---|---|---|---|---|
| 106 Thayer Rd Manhasset, NY | 5.0 | 3.0 | 2793 | $12,000 | $4.30 | 2d | 1 | 0.29mi |
| 18 Heights Rd Manhasset, NY | 5.0 | 4.5 | 4411 | $25,000 | $5.67 | 6d | 1 | 0.92mi |
Listing history 7 events
-
2026-06-13statusdays on market $3,198,000 Pending 7 DOM
-
2026-06-09days on market $3,198,000 Active 6 DOM
-
2026-06-08days on market $3,198,000 Active 5 DOM
-
2026-06-07days on market $3,198,000 Active 4 DOM
-
2026-06-04status $3,198,000 Active 1 DOM
-
2026-06-03remarks 699-char remark
-
2026-06-03$3,198,000 Coming Soon 1 DOM
ⓘ Source: listings_history table (triggers on properties + properties_extension) + one-shot
backfill from property_details.listing_events for pre-trigger history.
Tax reassessment forecast NY · Partial reset (capped growth)
- Current annual tax
- $24,186 · $2,016/mo
- Projected year-2 tax
- $39,116 · $3,260/mo
- Expected delta
- +$14,930/yr (+$1,244/mo · 61.7%)
ⓘ Screening estimate from a state-policy table — verify with the county assessor before closing.
Climate risk First Street
- Flood 1/10 Low FEMA zone X (unshaded) · 0% chance over 30 yrs
- Wildfire 3/10 Moderate
- Heat 5/10 Major 7 d/yr ≥98°F today · 15 d/yr by 30 yrs out
- Wind 6/10 Major 27% chance of damaging wind over 30 yrs
- Air quality 4/10 Moderate 6 unhealthy d/yr today · 7 by 30 yrs out
Nearby sold comps map
Loading sold comps map…
Walkable amenities ~0.75 mi
Loading nearby amenities…
Taxation est. · year 1
- Rental income
- $179,841
- − Mortgage interest
- −$179,138
- − Property taxes
- −$24,186
- − Insurance
- −$15,990
- − Repairs & maintenance
- −$14,387
- − Management
- −$14,387
- − Depreciation
- −$93,033
- Taxable loss
- −$161,280
- Est. tax savings @ 24.0%
- +$38,707
- After-tax cash flow
- $-60,642/yr
For passive investors: Depreciation is non-cash, so a rental often shows a tax loss while cash-flowing — sheltering income. Rental losses are passive: they offset passive income freely, and up to $25,000/yr can offset ordinary (W-2) income if you actively participate and your MAGI is under $100k (phasing out to $0 by $150k); unused losses carry forward. On sale, claimed depreciation is recaptured at up to 25%, and gains may owe capital-gains tax (a 1031 exchange can defer both). Figures are a year-1 estimate at your 24.0% rate — not tax advice; consult a CPA.
Schools (NCES district)
- District
- Manhasset Union Free School District
- NCES district ID
- 3618270
- Math proficiency
- 86% ▬ 0.00%
- Reading proficiency
- 84% ▲ 2.00%
- Median HH income
- $166,795
- Composite
- 82.99/100
- National rank
- #17
- State rank
- #8 of 590 in NY
Livability — Munsey Park
- Score
- 76/100
- State rank
- #223
- US rank
- #3484
Category grades
Schools grade is shown separately in the Schools card above.
Census & demographics
- Census place
- Munsey Park, NY
- Population (ZIP)
- 17,703
Population outlook (Nassau County) Hauer SSP2
- Today (2025)
- 1,409,302 people
- By 2030
- 1,431,482 · +1.6%
- By 2040
- 1,471,607 · +4.4%
- By 2050
- 1,502,845 · +6.6%
- By 2075
- 1,575,403 · +11.8%
- By 2100
- 1,554,356 · +10.3%
Race, ethnicity, and origin ACS 2023
- Neighborhood character
- Predominantly White (67%)
- Race & ethnicity
- White 67% Asian 20% Hispanic / Latino 8% Two or more races 7% Black 1%
- Hispanic origin (detail)
- Puerto Rican 2% Cuban 1%
- Common ancestry
- Romanian 5% Scotch-Irish 3% Italian 2%
- Foreign-born
- 18% · China, South Korea, Canada
- Languages at home
- 74% English-only · Chinese 9% Other Indo-European 8% Korean 3%
Political lean MEDSL · Nassau
- 2024 margin
- Toss-up / Even · D 47.9% · R 52.1%
- 2008→2024 swing
- -12.6pp toward R · 2008: 8.4pp · 2024: -4.2pp
- All cycles
- 2024: R+4.2 2020: D+9.5 2016: D+5.3 2012: D+6.7 2008: D+8.4
Not yet ingested
- Civics
- —
Market trends
- HPI YoY
- ▲ 5.38%
- Current HPI
- 288.8947
- Rent YoY
- —
- Metro
- —
- State GDP YoY
- ▲ 2.60%
- F500 in state
- 92
Industry mix (Fortune 500 HQ in NY)
| Industry | F500 HQs | Revenue |
|---|---|---|
| Financial Services | 10 | $950B |
|
||
| Consumer Goods | 9 | $162B |
|
||
| Insurance | 4 | $225B |
|
||
| Telecommunications | 2 | $144B |
|
||
| Pharmaceuticals | 2 | $112B |
|
||
| Media / Entertainment | 2 | $69B |
|
||
Price history
+490.0% since first listed4 events — show timeline
- 2026-06-03 Coming Soon $3,198,000 OneKey® MLS as Distributed by MLS Grid
- 2000-06-08 Sold (Public Records) $850,000 Public Records
- 1996-04-25 Sold (Public Records) $550,000 Public Records
- 1994-07-06 Sold (Public Records) $542,000 Public Records
Property tax history
+2.2%/yrLatest (2024): $24,186 · +10.0% YoY. Source: county tax records.
Cash-flow waterfall
monthlySold comps — $/sqft
last 12 mo · ≤1 miLoading sold comps…