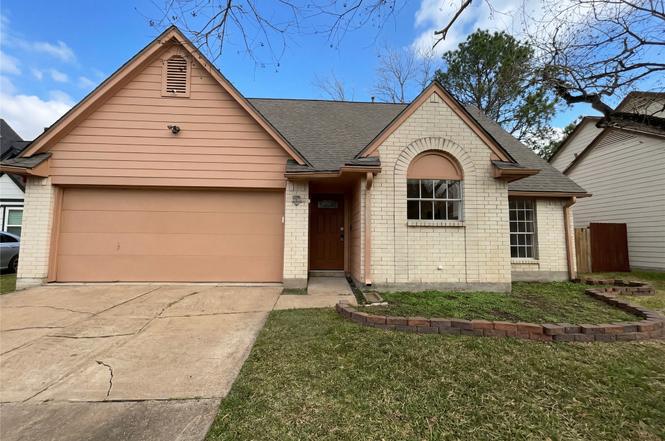
1606 Blue Heather Ln · Fresno, TX
Flood risk 4/10 · Minor
- FEMA flood zone
- X (unshaded)
- Chance of flooding over 30 yrs
- 0.24%
- Est. flood insurance / yr
- $507 – $1,088
Fire risk 5/10 · Moderate
- Est. fire insurance / yr
- $1,222 – $2,270
Heat risk 9/10 · Severe
- Hot days now (above 111°F)
- 7 days/yr
- Hot days in 30 yrs
- 24 days/yr
Wind risk 9/10 · Severe
- Chance of severe wind over 30 yrs
- 99.0%
Air-quality risk 2/10 · Minimal
- Unhealthy air days now
- 2 days/yr
- Unhealthy air days in 30 yrs
- 2 days/yr
Risk factors via First Street. Map © Google.
Why this score? — see what drove the C grade
The composite is a weighted blend of 9 inputs, each scored 0–100. Each bar is that input's sub-score; the figure is the points it added to the 100-point composite (weight × sub-score).
- Cash flow +19.7/30.0
- ARV discount +7.4/15.0
- DSCR +6.2/10.0
- 1% rule +5.9/10.0
- Schools +4.5/10.0
- Appreciation +4.0/10.0
- Livability +3.1/5.0
- Condition / age +2.5/5.0
- Rent growth +2.3/5.0
$222,000
🖨 Deal sheet 📄 Offer letter ✓ Due diligence
Listing remarks
Welcome to 1606 Blue Heather Ln, a home that exudes charm and sophistication. The kitchen is a chef's dream, boasting all stainless steel appliances that gleam against the backdrop of fresh interior paint. The living room is made cozy with a beautiful fireplace, perfect for those chilly evenings. The primary bathroom is a haven of relaxation, featuring double sinks for added convenience. Step outside to a lovely patio, ideal for entertaining or simply enjoying a quiet morning coffee. The fenced-in backyard provides privacy and a safe space for outdoor activities. The home also benefits from a partial flooring replacement, enhancing its modern appeal. This property is a perfect blend of comf
Key facts
- Double sinks
- Beautiful fireplace
- Lovely patio
Tags
Property features AI
Finance
- HOA & community: Association: RealManage; Annual association fee of $715
Exterior
- Parking: Attached garage with 2 spaces
- Security: Owned security system
- Utilities: Public water; Public sewer
- Home design: Residential property; Built in 1985; Slab foundation; Composition roof
- Construction: Wood siding construction; Built in 1985; Slab foundation; Composition roof
- Exterior features: Security system (owned); Lot described as 'Other'
Interior
- Kitchen: Microwave
- Bedrooms: Primary bedroom on the first floor (approx. 12 x 14); Bedroom on the first floor (approx. 11 x 12); Bedroom on the first floor (approx. 11 x 9)
- Flooring: Tile floors
- Bathrooms: 2 full bathrooms
- Heating & cooling: Central heating (gas); Central electric air conditioning
- Interior features: Gas fireplace (one); Microwave
Neighborhood map
What this means for you Summary
Snapshot
- This is a 3-bed/2.0-bath single-family listed at $222k.
Deal economics
- At list price, monthly cash flow is $261 ($3k/yr) — positive.
- The deal already cash-flows at list — no discount required.
- Meets the 1% rule at list price ($2k rent vs $222k).
- Recommended offer: $215k (3.0% below list) — sets the bar for market timing.
- Cap rate 7.7% vs local median 5.4% in Fresno — top-decile yield for the area; either an underpriced asset or a hidden risk that comps aren't pricing in. Stress-test before assuming the spread holds.
Location & tenants
- Location reads 62/100 on livability (#943 in TX) — a middle-class / working-renter tenant base. Strengths: employment A+, housing A+, cost of living A; Watch: crime C-, amenities F, commute F.
- Fort Bend ISD (suburban): math 44% / reading 53% proficiency, ranked #140 of 826 in TX (top 17%) — families likely to look elsewhere, expect single-tenant / working-renter base with shorter leases.
- Zoned schools: Lake Olympia Middle (math 18% / reading 31%, grade F, #1,279 of 1,662 statewide, top 78%, 1,170 students, 71% FRL); Hightower H S (math 23% / reading 45%, grade F, #1,002 of 1,632 statewide, top 62%, 2,535 students, 67% FRL) — zoned schools average 69% FRL vs 35% district-wide (34 pts higher); higher-poverty schools than district average — tighter screening recommended.
- Zoned-school proficiency averages 29% at this address vs 48% district-wide (-19 pts) — the specific schools serving this property underperform the Fort Bend ISD average; the district grade overstates school quality for this exact location.
- Market conditions: Rents soft (-0.9%/yr); 175 active listings in the ZIP; 7 comparable units currently listed for rent nearby; rentals lingering (median 44d on market — plan ~5-8 weeks vacancy on turnover, expect pricing pressure); 57% of comp listings sitting > 30 days — soft ceiling on asking rent; solid renter incomes; 12,093 units permitted in Fort Bend County in 2024 (815 in 5+ unit buildings).
- This rent runs 31% of the median local income ($94k/yr) — at the standard rent-burdened threshold; future hikes will face affordability resistance.
Forward outlook
- Local home prices are declining (-2.0%/yr); year-one equity from $2k of loan paydown is wiped out by about $4k of value loss. Plan a longer hold.
- Fort Bend County population projected at +75% by 2050 — long-run rental-demand tailwind backs the buy-and-hold thesis.
Negotiation context
- It's been on market 58 days — a 3% lower offer ($215k) is reasonable based on typical stale-listing flexibility.
- 2 sale attempts; this cycle's ask has dropped $15k (6%) from the opening price — seller is motivated, your offer sets the floor, not the list.
Risks & watch-outs
- Climate carrying-cost: severe wind risk, 99% chance of damaging wind over 30y; moderate wildfire risk; extreme-heat days projected 7→24/yr by 2055 (HVAC capex compounding) — expect insurance premiums to compound above CPI over the hold.
Questions for the listing agent
- It's been on market 58 days. Have you received any prior offers? Is the seller open to a 3% concession, seller financing, or rate buy-down credit?
- What does the HOA fee cover, when was the last increase, and are there any pending special assessments or reserve-fund shortfalls?
- Is there a deadline driving the sale (1031 exchange, divorce, estate, relocation)? That informs how much negotiation room exists.
- Schools are D-rated, which usually means shorter tenancies and higher turnover. Who's the typical renter profile here, and what's been the actual vacancy rate?
- What's the average days-on-market for RENTAL listings here right now (not sales)? A rising rental-DOM trend means longer vacancies and softer asking-rent achievability than the comps imply.
- What's the recent tenant-quality profile in this submarket — average credit score on applications, eviction rate, late-payment / NSF rate, and stable-employment percentage? A property-management company in the area should have these aggregated.
- How much new for-sale + rental construction is in the pipeline within 1–3 miles? Heavy new supply typically softens prices + rents 12–24 months out; constrained supply supports both.
Investment metrics
- 1% rule
- 1.09% ✓
- Cap rate
- 7.70%
- Cash-on-cash
- 5.03%
- DSCR
- 1.22
- GRM
- 7.7
CMA / ARV
- ARV (on-the-fly)
- $221,592
- Comps found
- 7
Show comp detail 7 sales within ~0.75 mi
| Address | Dist | Beds/Ba | Sqft | Sold | Price | $/sf | Match |
|---|---|---|---|---|---|---|---|
| 1606 Blue Heather Ln | 0.00mi | 3/2.0 | 1,319 (0%) | 1mo | $222,000 | $168 | 99 |
| 4914 Oakwood Dr | 0.55mi | 3/2.0 | 1,409 (+7%) | 10mo | $312,990 | $222 | 55 |
| 4918 Natchez Trce | 0.60mi | 3/2.0 | 1,440 (+9%) | 4mo | $245,000 | $170 | 54 |
| 1807 Oxford Green Ct | 0.56mi | 3/2.0 | 1,515 (+15%) | 8mo | $239,900 | $158 | 42 |
| 4934 Pine Haven Ln | 0.60mi | 3/2.0 | 1,409 (+7%) | 23mo | $306,990 | $218 | 41 |
| 4710 Brazos Point Ln | 0.72mi | 3/2.0 | 1,455 (+10%) | 13mo | $239,000 | $164 | 38 |
| 1031 Andover Glen Dr | 0.75mi | 3/2.0 | 1,506 (+14%) | 16mo | $249,000 | $165 | 28 |
Match score weights: distance 35% · size 25% · config 20% · recency 20%. Top-matched comps best support the ARV.
Projected returns pro-forma
-1.98% appreciation · 0.0% rent growth · sell at horizon
- IRR
- -6.9%
- Equity multiple
- 0.73×
- Total profit
- $-16,737
- Equity at exit
- $43,314
- IRR
- -2.6%
- Equity multiple
- 0.81×
- Total profit
- $-11,508
- Equity at exit
- $37,204
Cash invested: $62,160 (down + closing). Projections, not guarantees.
Landlord ↔ Tenant lean methodology
- Overall (STATE)
- 87 Strongly Landlord-Friendly
- State Texas
- 87 Strongly Landlord-Friendly · R+5
- County
- — inherits STATE
- City
- — inherits STATE
ZIP-level market 77545
- Home prices YoY
- -0.8%
- Rents YoY
- -0.9%
- Active inventory
- 175
- Price-to-rent
- 7.7×
Monthly cashflow live
- Estimated rent
- $2,410 high interval (Pro) →
- Mortgage (P&I)
- −$1,164
- Tax from tax record
- −$326 /mo · $3,917/yr
- Insurance
- −$92
- HOA
- −$60
- Vacancy / Maint / Mgmt
- −$506
- Net cashflow
- $261
Break-even live
UW: 25.0% down · 7.5% · 30yr · 1.5% tax · 5.0% vac · 8.0% maint · 8.0% mgmt
Financing live
Cash to close
- Down payment
- $55,500
- Closing costs
- $6,660
- Reserves months
- —
- Total cash needed
- —
Loan-product check · same deal, 3 products live
Conventional
25% down · 7.5% · 30yr
- Down + closing
- —
- Monthly P&I
- —
- Monthly cashflow
- —
- DSCR
- —
- Eligible?
- —
Personal DTI + credit; lowest rate.
DSCR
20% down · 8.5% · 30yr
- Down + closing
- —
- Monthly P&I
- —
- Monthly cashflow
- —
- DSCR
- —
- Eligible?
- —
No personal income docs; deal must DSCR.
Hard money
10% down · 12.0% · 12mo
- Down + closing
- —
- Monthly P&I
- —
- Monthly cashflow
- —
- DSCR
- —
- Eligible?
- —
Short-term bridge; refi at stabilization.
Rent comps 7 comps
| Address | Beds | Baths | Sqft | Rent | $/sqft | DOM | Units | Dist |
|---|---|---|---|---|---|---|---|---|
| 11727 Highway 6 Fresno, TX | 1.0–3.0 | 1.0–2.0 | 962 | $2,929 | $3.04 | 5d | 15 | 0.63mi |
| 4931 Natchez Trce Fresno, TX | 4.0 | 2.0 | 1835 | $2,350 | $1.28 | 43d | 1 | 0.64mi |
| 1402 Windom Court Way Fresno, TX | 4.0 | 2.5 | 1831 | $2,300 | $1.26 | 43d | 1 | 0.76mi |
| 919 Yorkshire Holw Fresno, TX | 3.0 | 2.0 | 1506 | $2,100 | $1.39 | 43d | 1 | 0.85mi |
| 3623 Elmwood Dale Dr Fresno, TX | 3.0 | 2.0 | 1545 | $1,765 | $1.14 | 43d | 1 | 0.89mi |
| 1740 Trammel-Fresno Rd Fresno, TX | 2.0 | 2.0 | 949 | $2,000 | $2.11 | 24d | 1 | 0.91mi |
| 2403 Orchard Run Fresno, TX | 3.0 | 2.0 | 1459 | $2,800 | $1.92 | 3d | 1 | 1.01mi |
HOA detail
- Monthly dues
- $60 · $720/yr
Listing history 8 events
-
2026-04-30status Pending
-
2026-04-23price $222,000
-
2026-04-10status Active
-
2026-03-27status Pending
-
2026-03-05price $232,000
-
2026-02-17$237,000 Active
-
2026-01-05soldstatus
-
2007-04-10soldstatus
ⓘ Source: listings_history table (triggers on properties + properties_extension) + one-shot
backfill from property_details.listing_events for pre-trigger history.
Tax reassessment forecast TX · Resets to sale price
- Current annual tax
- $3,917 · $326/mo
- Projected year-2 tax
- $4,063 · $339/mo
- Expected delta
- +$145/yr (+$12/mo · 3.7%)
ⓘ Screening estimate from a state-policy table — verify with the county assessor before closing.
Climate risk First Street
- Flood 4/10 Moderate FEMA zone X (unshaded) · 24% chance over 30 yrs
- Wildfire 5/10 Major
- Heat 9/10 Extreme 7 d/yr ≥111°F today · 24 d/yr by 30 yrs out
- Wind 9/10 Extreme 99% chance of damaging wind over 30 yrs
- Air quality 2/10 Low 2 unhealthy d/yr today · 2 by 30 yrs out
Nearby sold comps map
Loading sold comps map…
Walkable amenities ~0.75 mi
Loading nearby amenities…
Taxation est. · year 1
- Rental income
- $28,917
- − Mortgage interest
- −$12,435
- − Property taxes
- −$3,917
- − Insurance
- −$1,110
- − Repairs & maintenance
- −$2,313
- − Management
- −$2,313
- − HOA
- −$720
- − Depreciation
- −$6,458
- Taxable loss
- −$351
- Est. tax savings @ 24.0%
- +$84
- After-tax cash flow
- $3,211/yr
For passive investors: Depreciation is non-cash, so a rental often shows a tax loss while cash-flowing — sheltering income. Rental losses are passive: they offset passive income freely, and up to $25,000/yr can offset ordinary (W-2) income if you actively participate and your MAGI is under $100k (phasing out to $0 by $150k); unused losses carry forward. On sale, claimed depreciation is recaptured at up to 25%, and gains may owe capital-gains tax (a 1031 exchange can defer both). Figures are a year-1 estimate at your 24.0% rate — not tax advice; consult a CPA.
Schools (NCES district)
- District
- Fort Bend ISD
- NCES district ID
- 4819650
- Math proficiency
- 44% ▼ -15.00%
- Reading proficiency
- 53% ▼ -4.00%
- Median HH income
- $82,360
- Composite
- 44.61/100
- National rank
- #2779
- State rank
- #140 of 826 in TX
Livability — Fresno
- Score
- 62/100
- State rank
- #943
- US rank
- #16815
Category grades
Schools grade is shown separately in the Schools card above.
Census & demographics
- Census place
- Fresno, TX
- County
- Fort Bend County · 836,777 people
- City population
- 26,236
- Metro
- Houston-The Woodlands-Sugar Land, TX
- Population (ZIP)
- 26,236
- Household income
- $94,474
- Rent vs Own
- Severe rent burden
- 360.0
Population outlook (Fort Bend County) Hauer SSP2
- Today (2025)
- 1,004,526 people
- By 2030
- 1,153,104 · +14.8%
- By 2040
- 1,453,718 · +44.7%
- By 2050
- 1,753,781 · +74.6%
- By 2075
- 2,455,772 · +144.5%
- By 2100
- 2,930,528 · +191.7%
Race, ethnicity, and origin ACS 2023
- Neighborhood character
- Diverse neighborhood (Simpson 0.61)
- Race & ethnicity
- Black 51% Hispanic / Latino 34% Two or more races 12% White 8% Asian 2%
- Hispanic origin (detail)
- Mexican 29%
- Common ancestry
- Portuguese 1%
- Foreign-born
- 18% · Canada
- Languages at home
- 67% English-only · Spanish 29% Other Asian/Pacific 1% Other Indo-European 1%
Political lean MEDSL · Fort Bend
- 2024 margin
- Toss-up / Even · D 49.5% · R 47.9% · Other 2.6%
- 2008→2024 swing
- +4.0pp toward D · 2008: -2.4pp · 2024: 1.6pp
- All cycles
- 2024: D+1.6 2020: D+10.6 2016: D+6.6 2012: R+6.8 2008: R+2.4
Not yet ingested
- Civics
- —
Market trends
- HPI YoY
- ▼ -1.98%
- Current HPI
- 231.3921
- Rent YoY
- ▼ -0.95%
- Metro
- Houston-The Woodlands-Sugar Land, TX
- State GDP YoY
- ▲ 3.95%
- F500 in state
- 110
Industry mix (Fortune 500 HQ in TX)
| Industry | F500 HQs | Revenue |
|---|---|---|
| Energy | 16 | $1,198B |
|
||
| Technology | 5 | $198B |
|
||
| Engineering / Construction | 4 | $72B |
|
||
| Energy Services | 3 | $60B |
|
||
| Utilities | 3 | $41B |
|
||
| Healthcare | 2 | $330B |
|
||
Price history
-6.3% since first listed8 events — show timeline
- 2026-04-30 Pending — HARMLS
- 2026-04-23 Price Changed $222,000 HARMLS
- 2026-04-10 Relisted — HARMLS
- 2026-03-27 Pending — HARMLS
- 2026-03-05 Price Changed $232,000 HARMLS
- 2026-02-17 Listed $237,000 HARMLS
- 2026-01-05 Sold (Public Records) — Public Records
- 2007-04-10 Sold (Public Records) — Public Records
Property tax history
+3.7%/yrLatest (2025): $3,917 · +6.7% YoY. Source: county tax records.
Cash-flow waterfall
monthlySold comps — $/sqft
last 12 mo · ≤1 miLoading sold comps…