170 S 4th St · Silsbee, TX
Flood risk 1/10 · Minimal
- FEMA flood zone
- X (unshaded)
- Chance of flooding over 30 yrs
- 0.0%
- Est. flood insurance / yr
- $507 – $1,088
Fire risk 3/10 · Minor
- Est. fire insurance / yr
- $1,222 – $2,270
Heat risk 9/10 · Severe
- Hot days now (above 112°F)
- 7 days/yr
- Hot days in 30 yrs
- 24 days/yr
Wind risk 8/10 · Major
- Chance of severe wind over 30 yrs
- 99.0%
Air-quality risk 2/10 · Minimal
- Unhealthy air days now
- 1 days/yr
- Unhealthy air days in 30 yrs
- 1 days/yr
Risk factors via First Street. Map © Google.
Why this score? — see what drove the D+ grade
The composite is a weighted blend of 9 inputs, each scored 0–100. Each bar is that input's sub-score; the figure is the points it added to the 100-point composite (weight × sub-score).
- ARV discount +15.0/15.0
- Cash flow +14.9/30.0
- DSCR +4.6/10.0
- 1% rule +3.7/10.0
- Livability +3.6/5.0
- Schools +2.6/10.0
- Rent growth +2.5/5.0
- Condition / age +2.5/5.0
- Appreciation +0.0/10.0
$193,515
🖨 Deal sheet 📄 Offer letter ✓ Due diligence
Listing remarks MLS
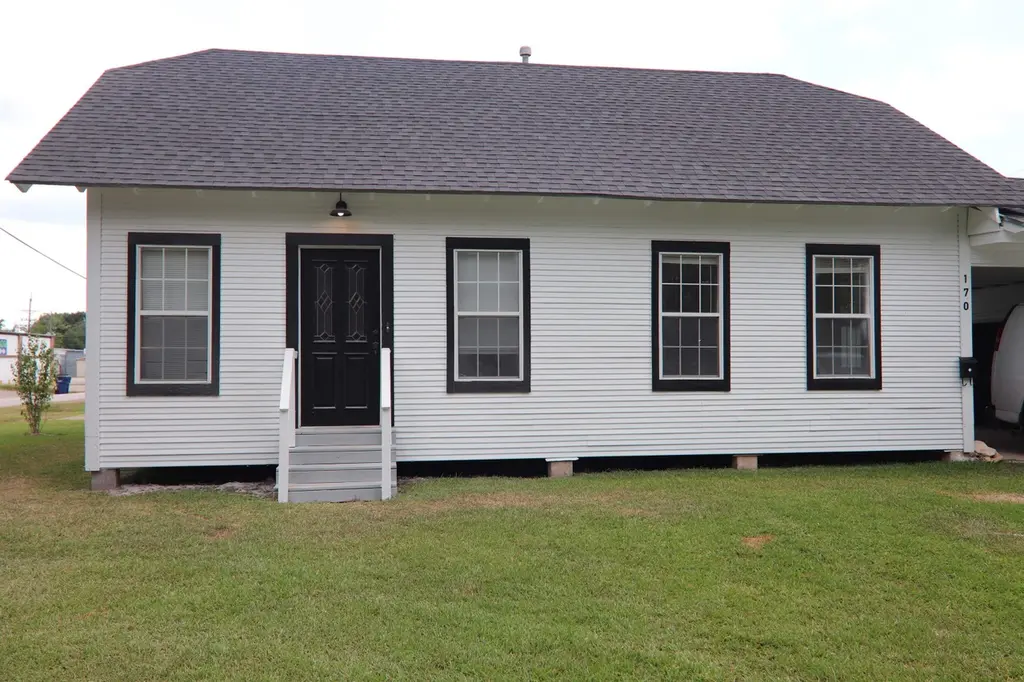
Partially restored farmhouse located on a corner lot in the Heart of downtown Silsbee. With four bedrooms and three bathrooms home has Hardwood Floors throughout the Living and Bedroom areas. Could be used as residence or commercial. Home was built as a duplex.
Key facts
- Covered porch
- Double pane windows
- Farmhouse character
Tags
Property features AI
Exterior
- Parking: Attached garage (1 space); Carport (1 space)
- Utilities: Public water; Public sewer
- Home design: Residential income property; Duplex
- Construction: Frame construction; Composition roof; Slab foundation; Home warranty included
- Exterior features: Covered patio/porch; Deck; Chain link fencing; Corner lot; Publicly maintained road; Workshop
Interior
- Kitchen: Dishwasher; Refrigerator; Gas cooktop; Range; Ice maker
- Flooring: Wood flooring
- Bathrooms: Three full bathrooms
- Heating & cooling: Central heating; Natural gas heating; Zoned heating; Central air conditioning; Ceiling fans
- Interior features: Dishwasher; Refrigerator; Gas cooktop; Ice maker; Range; Wood flooring
Neighborhood map
What this means for you Summary
Snapshot
- This is a 4-bed/1.0-bath single-family listed at $194k.
Deal economics
- At list price, monthly cash flow is $56 ($672/yr) — positive.
- The deal already cash-flows at list — no discount required.
- To meet the 1% rule (rent ≥ 1% of price), the offer needs to be $168k (13.0% below list).
- Recommended offer: $168k (13.0% below list) — sets the bar for 1% rule.
- Cap rate 6.6% vs local median 5.2% in Silsbee — meaningfully above typical; check what's discounted (condition, days-on-market, listing class) to confirm the premium yield is real.
Location & tenants
- Location reads 72/100 on livability (#263 in TX) — a middle-class / working-renter tenant base. Strengths: cost of living A+, housing A+, health & safety A+; Watch: schools C-, amenities F, commute F.
- Silsbee ISD (town): math 25% / reading 36% proficiency, ranked #614 of 826 in TX (top 74%) — families likely to look elsewhere, expect single-tenant / working-renter base with shorter leases.
- Market conditions: 127 active listings in the ZIP; 358 units permitted in Hardin County in 2024 (0 in 5+ unit buildings).
- This rent runs 32% of the median local income ($62k/yr) — at the standard rent-burdened threshold; future hikes will face affordability resistance.
Forward outlook
- Local home prices are declining (-3.0%/yr); year-one equity from $1k of loan paydown is wiped out by about $6k of value loss. Plan a longer hold.
Negotiation context
- It's been on market 34 days — a 3% lower offer ($188k) is reasonable based on typical stale-listing flexibility.
- 5 sale attempts since 9y ago with the ask held roughly flat each time — persistent listings suggest the price (not the market) is what's stuck; bring a comps-based counter.
- Current owner paid $35k; list at $194k implies a 454% gain — meaningful room to come down on a strong offer.
Risks & watch-outs
- Watch-outs: built in 1938 — expect roof / HVAC / electrical / plumbing capex.
- Climate carrying-cost: severe wind risk, 99% chance of damaging wind over 30y; extreme-heat days projected 7→24/yr by 2055 (HVAC capex compounding) — expect insurance premiums to compound above CPI over the hold.
Questions for the listing agent
- It's been on market 34 days. Have you received any prior offers? Is the seller open to a 13% concession, seller financing, or rate buy-down credit?
- Built in 1938 — when were the roof, HVAC, electrical panel, plumbing, and water heater last replaced?
- Is there a deadline driving the sale (1031 exchange, divorce, estate, relocation)? That informs how much negotiation room exists.
- The area grade is low — what's the realistic commute time and amenity access for the typical tenant pool here? Any planned neighborhood developments (good or bad) we should know about?
- What's the average days-on-market for RENTAL listings here right now (not sales)? A rising rental-DOM trend means longer vacancies and softer asking-rent achievability than the comps imply.
- What's the recent tenant-quality profile in this submarket — average credit score on applications, eviction rate, late-payment / NSF rate, and stable-employment percentage? A property-management company in the area should have these aggregated.
- How much new for-sale + rental construction is in the pipeline within 1–3 miles? Heavy new supply typically softens prices + rents 12–24 months out; constrained supply supports both.
Investment metrics
- 1% rule
- 0.87% ✗
- Cap rate
- 6.64%
- Cash-on-cash
- 1.24%
- DSCR
- 1.06
- GRM
- 9.6
CMA / ARV
- ARV (median comp)
- $283,702
- List price
- $193,515
- Delta
- -31.79%
- Verdict
- UNDERPRICED
- Comps
- 16 within 1.0 mi
Projected returns pro-forma
-3.0% appreciation · 3.0% rent growth · sell at horizon
- IRR
- -14.3%
- Equity multiple
- 0.49×
- Total profit
- $-27,805
- Equity at exit
- $28,854
- IRR
- -5.6%
- Equity multiple
- 0.64×
- Total profit
- $-19,676
- Equity at exit
- $16,732
Cash invested: $54,184 (down + closing). Projections, not guarantees.
Landlord ↔ Tenant lean methodology
- Overall (STATE)
- 87 Strongly Landlord-Friendly
- State Texas
- 87 Strongly Landlord-Friendly · R+5
- County
- — inherits STATE
- City
- — inherits STATE
ZIP-level market 77656
- Active inventory
- 127
- Price-to-rent
- 9.6×
Monthly cashflow live
- Estimated rent
- $1,683 medium interval (Pro) →
- Mortgage (P&I)
- −$1,015
- Tax from tax record
- −$178 /mo · $2,136/yr
- Insurance
- −$81
- HOA
- −$0
- Vacancy / Maint / Mgmt
- −$353
- Net cashflow
- $56
Break-even live
UW: 25.0% down · 7.5% · 30yr · 1.5% tax · 5.0% vac · 8.0% maint · 8.0% mgmt
Financing live
Cash to close
- Down payment
- $48,379
- Closing costs
- $5,805
- Reserves months
- —
- Total cash needed
- —
Loan-product check · same deal, 3 products live
Conventional
25% down · 7.5% · 30yr
- Down + closing
- —
- Monthly P&I
- —
- Monthly cashflow
- —
- DSCR
- —
- Eligible?
- —
Personal DTI + credit; lowest rate.
DSCR
20% down · 8.5% · 30yr
- Down + closing
- —
- Monthly P&I
- —
- Monthly cashflow
- —
- DSCR
- —
- Eligible?
- —
No personal income docs; deal must DSCR.
Hard money
10% down · 12.0% · 12mo
- Down + closing
- —
- Monthly P&I
- —
- Monthly cashflow
- —
- DSCR
- —
- Eligible?
- —
Short-term bridge; refi at stabilization.
Listing history 38 events
-
2026-06-18days on market $193,515 Active 34 DOM
-
2026-06-17days on market $193,515 Active 33 DOM
-
2026-06-16days on market $193,515 Active 32 DOM
-
2026-06-15days on market $193,515 Active 31 DOM
-
2026-06-14days on market $193,515 Active 29 DOM
-
2026-06-10days on market $193,515 Active 26 DOM
-
2026-06-09days on market $193,515 Active 25 DOM
-
2026-06-08days on market $193,515 Active 24 DOM
-
2026-06-07days on market $193,515 Active 23 DOM
-
2026-06-03days on market $193,515 Active 19 DOM
-
2026-06-02days on market $193,515 Active 18 DOM
-
2026-06-01days on market $193,515 Active 17 DOM
-
2026-05-31days on market $193,515 Active 16 DOM
-
2026-05-30days on market $193,515 Active 15 DOM
-
2026-05-15$193,515 Active 811-char remark
-
2026-01-15historical $1,395
-
2025-12-11$1,395
-
2025-09-10price $195,995
-
2025-06-23price $199,995
-
2025-05-05price $207,900
-
2024-12-26price $227,200
-
2024-08-29price $237,200
-
2024-08-05price $247,200
-
2024-07-09price $259,200
-
2024-06-25price $269,200
-
2024-06-11price $279,200
-
2024-01-04price $289,200
-
2023-11-02$298,200 Active
-
2022-04-18soldstatus
-
2022-03-30soldstatus
Show marketing remark (261 chars)
Partially restored farmhouse located on a corner lot in the Heart of downtown Silsbee. With four bedrooms and three bathrooms home has Hardwood Floors throughout the Living and Bedroom areas. Could be used as residence or commercial. Home was built as a duplex.
-
2022-02-27$109,900
Show marketing remark (261 chars)
Partially restored farmhouse located on a corner lot in the Heart of downtown Silsbee. With four bedrooms and three bathrooms home has Hardwood Floors throughout the Living and Bedroom areas. Could be used as residence or commercial. Home was built as a duplex.
-
2017-04-27soldstatus
-
2017-04-26soldstatus
-
2017-04-07$50,000
-
2015-07-08soldstatus
-
2012-01-27soldstatus
-
2011-09-30soldstatus
-
2004-02-26soldstatus $34,900
ⓘ Source: listings_history table (triggers on properties + properties_extension) + one-shot
backfill from property_details.listing_events for pre-trigger history.
Tax reassessment forecast TX · Resets to sale price
- Current annual tax
- $2,136 · $178/mo
- Projected year-2 tax
- $3,541 · $295/mo
- Expected delta
- +$1,405/yr (+$117/mo · 65.8%)
ⓘ Screening estimate from a state-policy table — verify with the county assessor before closing.
Climate risk First Street
- Flood 1/10 Low FEMA zone X (unshaded) · 0% chance over 30 yrs
- Wildfire 3/10 Moderate
- Heat 9/10 Extreme 7 d/yr ≥112°F today · 24 d/yr by 30 yrs out
- Wind 8/10 Severe 99% chance of damaging wind over 30 yrs
- Air quality 2/10 Low 1 unhealthy d/yr today · 1 by 30 yrs out
Nearby sold comps map
Loading sold comps map…
Walkable amenities ~0.75 mi
Loading nearby amenities…
Taxation est. · year 1
- Rental income
- $20,194
- − Mortgage interest
- −$10,840
- − Property taxes
- −$2,136
- − Insurance
- −$968
- − Repairs & maintenance
- −$1,616
- − Management
- −$1,616
- − Depreciation
- −$5,630
- Taxable loss
- −$2,610
- Est. tax savings @ 24.0%
- +$626
- After-tax cash flow
- $1,298/yr
For passive investors: Depreciation is non-cash, so a rental often shows a tax loss while cash-flowing — sheltering income. Rental losses are passive: they offset passive income freely, and up to $25,000/yr can offset ordinary (W-2) income if you actively participate and your MAGI is under $100k (phasing out to $0 by $150k); unused losses carry forward. On sale, claimed depreciation is recaptured at up to 25%, and gains may owe capital-gains tax (a 1031 exchange can defer both). Figures are a year-1 estimate at your 24.0% rate — not tax advice; consult a CPA.
Schools (NCES district)
- District
- Silsbee ISD
- NCES district ID
- 4840230
- Math proficiency
- 25% ▼ -23.00%
- Reading proficiency
- 36% ▼ -11.00%
- Median HH income
- $44,907
- Composite
- 26.09/100
- National rank
- #7292
- State rank
- #614 of 826 in TX
Livability — Silsbee
- Score
- 72/100
- State rank
- #263
- US rank
- #6215
Category grades
Schools grade is shown separately in the Schools card above.
Census & demographics
- Census place
- Silsbee, TX
- County
- Hardin County · 39,783 people
- City population
- 17,525
- Metro
- Beaumont-Port Arthur, TX
- Population (ZIP)
- 17,525
- Household income
- $62,303
- Rent vs Own
- Severe rent burden
- 306.0
Population outlook (Hardin County) Hauer SSP2
- Today (2025)
- 57,780 people
- By 2030
- 58,296 · +0.9%
- By 2040
- 58,421 · +1.1%
- By 2050
- 57,391 · -0.7%
- By 2075
- 53,132 · -8.0%
- By 2100
- 44,905 · -22.3%
Race, ethnicity, and origin ACS 2023
- Neighborhood character
- Predominantly White (74%)
- Race & ethnicity
- White 74% Black 14% Two or more races 8% Hispanic / Latino 7%
- Hispanic origin (detail)
- Mexican 4%
- Common ancestry
- Lithuanian 4% Serbian 3% Italian 2%
- Foreign-born
- 3% · Canada
- Languages at home
- 96% English-only · Spanish 3% Other Indo-European 1%
Political lean MEDSL · Hardin
- 2024 margin
- Solid R (+75.8) · D 11.9% · R 87.7%
- 2008→2024 swing
- -14.6pp toward R · 2008: -61.2pp · 2024: -75.8pp
- All cycles
- 2024: R+75.8 2020: R+73.8 2016: R+73.9 2012: R+67.6 2008: R+61.2
Not yet ingested
- Civics
- —
Market trends
- HPI YoY
- ▼ -93.73%
- Current HPI
- 141.1371
- Rent YoY
- —
- Metro
- Beaumont-Port Arthur, TX
- State GDP YoY
- ▲ 3.95%
- F500 in state
- 110
Industry mix (Fortune 500 HQ in TX)
| Industry | F500 HQs | Revenue |
|---|---|---|
| Energy | 16 | $1,198B |
|
||
| Technology | 5 | $198B |
|
||
| Engineering / Construction | 4 | $72B |
|
||
| Energy Services | 3 | $60B |
|
||
| Utilities | 3 | $41B |
|
||
| Healthcare | 2 | $330B |
|
||
Price history
+454.5% since first listed24 events — show timeline
- 2026-05-15 Listed $193,515 BBOR
- 2026-01-15 Rental Removed $1,395 BUILDIUM
- 2025-12-11 Listed for Rent $1,395 BUILDIUM
- 2025-09-10 Price Changed $195,995 BBOR
- 2025-06-23 Price Changed $199,995 BBOR
- 2025-05-05 Price Changed $207,900 BBOR
- 2024-12-26 Price Changed $227,200 BBOR
- 2024-08-29 Price Changed $237,200 BBOR
- 2024-08-05 Price Changed $247,200 BBOR
- 2024-07-09 Price Changed $259,200 BBOR
- 2024-06-25 Price Changed $269,200 BBOR
- 2024-06-11 Price Changed $279,200 BBOR
- 2024-01-04 Price Changed $289,200 BBOR
- 2023-11-02 Listed $298,200 BBOR
- 2022-04-18 Sold (Public Records) — Public Records
- 2022-03-30 Sold (MLS) — BBOR
- 2022-02-27 Listed $109,900 BBOR
- 2017-04-27 Sold (Public Records) — Public Records
- 2017-04-26 Sold (MLS) — BBOR
- 2017-04-07 Listed $50,000 BBOR
- 2015-07-08 Sold (Public Records) — Public Records
- 2012-01-27 Sold (Public Records) — Public Records
- 2011-09-30 Sold (Public Records) — Public Records
- 2004-02-26 Sold (Public Records) $34,900 Public Records
Property tax history
+4.2%/yrLatest (2025): $2,136 · -1.4% YoY. Source: county tax records.
Cash-flow waterfall
monthlySold comps — $/sqft
last 12 mo · ≤1 miLoading sold comps…