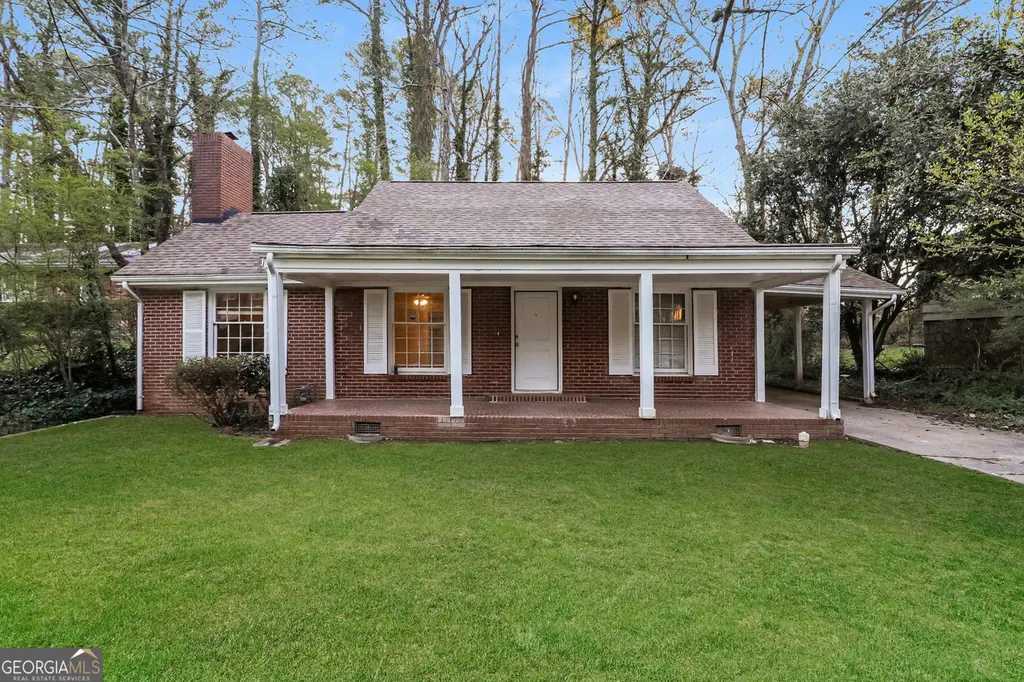
1752 Laurelwood Dr SW · Atlanta, GA
Flood risk 1/10 · Minimal
- FEMA flood zone
- X (unshaded)
- Chance of flooding over 30 yrs
- 0.0%
- Est. flood insurance / yr
- $473 – $860
Fire risk 3/10 · Minor
- Est. fire insurance / yr
- $963 – $1,789
Heat risk 5/10 · Moderate
- Hot days now (above 104°F)
- 7 days/yr
- Hot days in 30 yrs
- 18 days/yr
Wind risk 6/10 · Moderate
- Chance of severe wind over 30 yrs
- 27.0%
Air-quality risk 3/10 · Minor
- Unhealthy air days now
- 3 days/yr
- Unhealthy air days in 30 yrs
- 3 days/yr
Risk factors via First Street. Map © Google.
Why this score? — see what drove the D- grade
The composite is a weighted blend of 9 inputs, each scored 0–100. Each bar is that input's sub-score; the figure is the points it added to the 100-point composite (weight × sub-score).
- ARV discount +15.0/15.0
- Cash flow +7.8/30.0
- Livability +4.2/5.0
- Schools +2.7/10.0
- Rent growth +2.5/5.0
- Condition / age +2.5/5.0
- 1% rule +2.2/10.0
- DSCR +1.9/10.0
- Appreciation +0.0/10.0
$267,900
🖨 Deal sheet 📄 Offer letter ✓ Due diligence
Listing remarks
Charm and curb appeal abound for this Atlanta home! Step inside from the covered front porch and into the well-appointed living room, which features a fireplace. Through the dining room you'll find the kitchen, which boasts a chic three-piece appliance package, hard surface countertops, and ample storage. The primary suite rounds out the first floor with two secondary bedrooms on the second floor. Come and see for yourself the possibilities that this home has to offer!
Key facts
- Covered front porch
- Primary suite
- Fireplace
Tags
Property features AI
Finance
- Other: Listing accepts Cash, Conventional, FHA, and VA financing
- HOA & community: No HOA
Exterior
- Parking: Carport (1 parking space)
- Utilities: Public water; Public sewer; Other utilities
- Home design: Single family residence (house); Residential property; Resale; Built in 1955
- Construction: Brick construction; Composition roof; 2028 building area (public records)
- Exterior features: Level and sloped lot
Interior
- Kitchen: Dishwasher; Refrigerator
- Bedrooms: 3 bedrooms, 1 on the main level
- Flooring: Other flooring
- Bathrooms: 2 full bathrooms, 1 on the main level
- Heating & cooling: Forced air heating; Electric cooling; Central air conditioning
- Interior features: Other interior features; One and one half levels; Crawl space basement; Fireplace (1)
- Laundry & utility: Laundry features: Other
Neighborhood map
What this means for you Summary
Snapshot
- This is a 2-bed/1.0-bath single-family listed at $268k.
Deal economics
- At list price, monthly cash flow is $-300 ($-4k/yr) — negative.
- To cash-flow at today's rent, offer at most $215k (19.8% below list).
- To meet the 1% rule (rent ≥ 1% of price), the offer needs to be $192k (28.2% below list).
- Recommended offer: $192k (28.2% below list) — sets the bar for 1% rule.
- Cap rate 4.9% vs local median 3.1% in Atlanta — top-decile yield for the area; either an underpriced asset or a hidden risk that comps aren't pricing in. Stress-test before assuming the spread holds.
Location & tenants
- Location reads 83/100 on livability (#6 in GA, #919 nationally) — a professional / high-income tenant draw. Strengths: amenities A+, commute A+, housing A+; Watch: cost of living C-.
- Atlanta Public Schools (urban): math 28% / reading 35% proficiency, ranked #80 of 174 in GA (top 46%) — families likely to look elsewhere, expect single-tenant / working-renter base with shorter leases; 71% free/reduced lunch — lower-income household profile, screen leases tightly.
- Zoned schools: Cascade Elementary School (math 2% / reading 8%, grade F, #1,160 of 1,228 statewide, top 98%, 348 students, 100% FRL); Jean Childs Young Middle School (math 2% / reading 12%, grade F, #449 of 470 statewide, top 97%, 747 students, 100% FRL); Benjamin E. Mays High School (math 22% / reading 15%, grade F, #254 of 424 statewide, top 61%, 1,337 students, 100% FRL) — zoned schools average 100% FRL vs 71% district-wide (29 pts higher); higher-poverty schools than district average — tighter screening recommended.
- Zoned-school proficiency averages 10% at this address vs 32% district-wide (-21 pts) — the specific schools serving this property underperform the Atlanta Public Schools average; the district grade overstates school quality for this exact location.
- Market conditions: Rents soft (-0.2%/yr); 245 active listings in the ZIP; 27 comparable units currently listed for rent nearby; rentals at typical pace (median 24d on market — plan ~3-4 weeks tenant-placement turnaround); 11,565 units permitted in Fulton County in 2024 (8,159 in 5+ unit buildings).
- At $1,924/mo this rent would consume 46% of the median local household income ($51k/yr) (locally 2825% of renters already pay >50% of income on rent) — very limited rent-growth headroom before tenants either downsize or default.
Forward outlook
- Local home prices are declining (-3.0%/yr); year-one equity from $2k of loan paydown is wiped out by about $8k of value loss. Plan a longer hold.
- Fulton County population projected at +38% by 2050 — long-run rental-demand tailwind backs the buy-and-hold thesis.
Negotiation context
- It's been on market 35 days — a 3% lower offer ($260k) is reasonable based on typical stale-listing flexibility.
- 10 sale attempts since 13y ago; this cycle's ask has dropped $17k (6%) from the opening price — seller is motivated, your offer sets the floor, not the list.
Risks & watch-outs
- Watch-outs: built in 1955 — expect roof / HVAC / electrical / plumbing capex.
- Climate carrying-cost: major wind risk, 27% chance of damaging wind over 30y; extreme-heat days projected 7→18/yr by 2055 (HVAC capex compounding) — expect insurance premiums to compound above CPI over the hold.
Questions for the listing agent
- What do current leases actually rent for vs. the listed asking? Can we see a recent rent roll and the last 12 months of T-12 income?
- It's been on market 35 days. Have you received any prior offers? Is the seller open to a 28% concession, seller financing, or rate buy-down credit?
- Built in 1955 — when were the roof, HVAC, electrical panel, plumbing, and water heater last replaced?
- Is there a deadline driving the sale (1031 exchange, divorce, estate, relocation)? That informs how much negotiation room exists.
- The area grade is low — what's the realistic commute time and amenity access for the typical tenant pool here? Any planned neighborhood developments (good or bad) we should know about?
- What's the average days-on-market for RENTAL listings here right now (not sales)? A rising rental-DOM trend means longer vacancies and softer asking-rent achievability than the comps imply.
- What's the recent tenant-quality profile in this submarket — average credit score on applications, eviction rate, late-payment / NSF rate, and stable-employment percentage? A property-management company in the area should have these aggregated.
- How much new for-sale + rental construction is in the pipeline within 1–3 miles? Heavy new supply typically softens prices + rents 12–24 months out; constrained supply supports both.
Investment metrics
- 1% rule
- 0.72% ✗
- Cap rate
- 4.95%
- Cash-on-cash
- -4.80%
- DSCR
- 0.79
- GRM
- 11.6
CMA / ARV
- ARV (median comp)
- $334,713
- List price
- $267,900
- Delta
- -19.96%
- Verdict
- UNDERPRICED
- Comps
- 20 within 1.0 mi
Show comp detail 3 sales within ~0.75 mi
| Address | Dist | Beds/Ba | Sqft | Sold | Price | $/sf | Match |
|---|---|---|---|---|---|---|---|
| 1797 Willis Mill Rd SW | 0.13mi | 3/3.0 (+1) | 1,819 (-10%) | 3mo | $329,000 | $181 | 61 |
| 1431 Woodland Ter SW | 0.73mi | 2/2.0 | 1,911 (-6%) | 12mo | $177,777 | $93 | 42 |
| 1945 Dodson Dr SW | 0.67mi | 3/1.0 (+1) | 1,794 (-12%) | 6mo | $165,000 | $92 | 40 |
Match score weights: distance 35% · size 25% · config 20% · recency 20%. Top-matched comps best support the ARV.
Projected returns pro-forma
-3.0% appreciation · 0.0% rent growth · sell at horizon
- IRR
- -27.8%
- Equity multiple
- 0.09×
- Total profit
- $-68,168
- Equity at exit
- $39,945
- IRR
- -42.1%
- Equity multiple
- -0.41×
- Total profit
- $-105,741
- Equity at exit
- $23,163
Cash invested: $75,012 (down + closing). Projections, not guarantees.
Landlord ↔ Tenant lean methodology
- Overall (STATE)
- 90 Strongly Landlord-Friendly
- State Georgia
- 90 Strongly Landlord-Friendly · R+3
- County
- — inherits STATE
- City
- — inherits STATE
ZIP-level market 30311
- Home prices YoY
- -33.3%
- Rents YoY
- -0.2%
- Active inventory
- 245
- Price-to-rent
- 11.6×
Monthly cashflow live
- Estimated rent
- $1,924 high interval (Pro) →
- Mortgage (P&I)
- −$1,405
- Tax from tax record
- −$304 /mo · $3,646/yr
- Insurance
- −$112
- HOA
- −$0
- Vacancy / Maint / Mgmt
- −$404
- Net cashflow
- $-300
Break-even live
UW: 25.0% down · 7.5% · 30yr · 1.5% tax · 5.0% vac · 8.0% maint · 8.0% mgmt
Financing live
Cash to close
- Down payment
- $66,975
- Closing costs
- $8,037
- Reserves months
- —
- Total cash needed
- —
Loan-product check · same deal, 3 products live
Conventional
25% down · 7.5% · 30yr
- Down + closing
- —
- Monthly P&I
- —
- Monthly cashflow
- —
- DSCR
- —
- Eligible?
- —
Personal DTI + credit; lowest rate.
DSCR
20% down · 8.5% · 30yr
- Down + closing
- —
- Monthly P&I
- —
- Monthly cashflow
- —
- DSCR
- —
- Eligible?
- —
No personal income docs; deal must DSCR.
Hard money
10% down · 12.0% · 12mo
- Down + closing
- —
- Monthly P&I
- —
- Monthly cashflow
- —
- DSCR
- —
- Eligible?
- —
Short-term bridge; refi at stabilization.
Rent comps 27 comps
| Address | Beds | Baths | Sqft | Rent | $/sqft | DOM | Units | Dist |
|---|---|---|---|---|---|---|---|---|
| 1668 Laurelwood Dr SW Atlanta, GA | 3.0 | 2.0 | 2019 | $2,000 | $0.99 | 20d | 1 | 0.19mi |
| 1735 Willis Mill Rd SW Atlanta, GA | 3.0 | 2.0 | 1461 | $2,173 | $1.49 | 16d | 1 | 0.25mi |
| 2400 Campbellton Rd SW Atlanta, GA | 1.0–3.0 | 1.0–2.5 | 1350 | $1,350 | $1.00 | 7d | 2 | 0.33mi |
| 1821 Sandringham Dr SW Atlanta, GA | 3.0 | 2.0 | 1540 | $2,100 | $1.36 | 18d | 1 | 0.46mi |
| 1867 Myrtle Dr SW #24 Atlanta, GA | 3.0 | 2.5 | 1400 | $1,400 | $1.00 | 18d | 1 | 0.67mi |
| 2079 Honeysuckle Ln SW Atlanta, GA | 3.0 | 2.0 | 1500 | $1,900 | $1.27 | 24d | 1 | 0.68mi |
| 1867 Myrtle Dr SW Atlanta, GA | 3.0 | 2.5 | 1400 | $1,400 | $1.00 | 24d | 1 | 0.70mi |
| 2287 Boulevard Granada SW Atlanta, GA | 3.0 | 2.0 | 1496 | $2,050 | $1.37 | 21d | 1 | 0.91mi |
| 2367 Cascade Rd Unit G27 Atlanta, GA | 2.0 | 1.0 | 1815 | $1,300 | $0.72 | 24d | 1 | 1.04mi |
| 2133 Pinehurst Dr Atlanta, GA | 3.0 | 1.5 | 2401 | $1,800 | $0.75 | 43d | 1 | 1.05mi |
| 2287 Mulberry St Unit B Atlanta, GA | 3.0 | 1.0 | 1700 | $2,500 | $1.47 | 24d | 1 | 1.15mi |
| 3002 Bayrose Cir East Point, GA | 1.0 | 1.0 | 1488 | $940 | $0.63 | 43d | 1 | 1.19mi |
| 3004 Bayrose Cir East Point, GA | 3.0 | 3.0 | 1564 | $2,350 | $1.50 | 43d | 1 | 1.19mi |
| 3004 Bayrose Cir Unit 102B Atlanta, GA | 3.0 | 3.0 | 1564 | $2,250 | $1.44 | 4d | 1 | 1.19mi |
| 3006 Bayrose Cir Unit 104B Atlanta, GA | 3.0 | 3.0 | 1564 | $2,300 | $1.47 | 43d | 1 | 1.20mi |
| 1402 Bayrose Cir East Point, GA | 2.0 | 2.5 | 1404 | $1,595 | $1.14 | 24d | 1 | 1.20mi |
| 2675 Headland Dr Atlanta, GA | 3.0 | 2.0 | 1408 | $1,600 | $1.14 | 17d | 1 | 1.20mi |
| 2994 Bayrose Cir East Point, GA | 1.0 | 1.0 | 1564 | $975 | $0.62 | 17d | 1 | 1.21mi |
| 2764 Veltre Pl SW Atlanta, GA | 3.0 | 3.0 | 2610 | $2,400 | $0.92 | 24d | 1 | 1.22mi |
| 2993 Bayrose Cir East Point, GA | 1.0 | 1.0 | 1564 | $760 | $0.49 | 43d | 1 | 1.24mi |
| 2993 Bayrose Cir East Point, GA | 1.0 | 1.0 | 1564 | $760 | $0.49 | 24d | 1 | 1.24mi |
| 6035 Bayrose Cir East Point, GA | 3.0 | 3.5 | 2100 | $2,500 | $1.19 | 43d | 1 | 1.25mi |
| 6035 Bayrose Cir East Point, GA | 3.0 | 3.5 | 2100 | $2,500 | $1.19 | 24d | 1 | 1.25mi |
| 9050 Bayrose Cir East Point, GA | 1.0 | 1.0 | 1980 | $975 | $0.49 | 43d | 1 | 1.29mi |
| 9051 Bayrose Cir East Point, GA | 3.0 | 3.5 | 1620 | $2,300 | $1.42 | 43d | 1 | 1.29mi |
| 1917 Connally Dr Atlanta, GA | 3.0 | 2.0 | 1534 | $1,850 | $1.21 | 12d | 1 | 1.33mi |
| 1220 Hawthorne Trl East Point, GA | 3.0 | 2.5 | 1886 | $2,250 | $1.19 | 43d | 1 | 1.38mi |
Listing history 49 events
-
2026-06-18days on market $267,900 Active 35 DOM
-
2026-06-17days on market $267,900 Active 34 DOM
-
2026-06-16days on market $267,900 Active 33 DOM
-
2026-06-15statusdays on market $267,900 Active 32 DOM
-
2026-06-13days on market $267,900 Price Change 30 DOM
-
2026-06-13pricestatusdays on market $267,900 Price Change 29 DOM
-
2026-06-09days on market $276,500 Active 26 DOM
-
2026-06-08days on market $276,500 Active 25 DOM
-
2026-06-07days on market $276,500 Active 24 DOM
-
2026-06-04days on market $276,500 Active 21 DOM
-
2026-06-03days on market $276,500 Active 20 DOM
-
2026-06-02days on market $276,500 Active 19 DOM
-
2026-06-01days on market $276,500 Active 18 DOM
-
2026-05-31statusdays on market $276,500 Active 17 DOM
-
2026-05-14$285,000 New 473-char remark
-
2024-07-16status Active
-
2024-07-16historical
-
2024-07-12historical
-
2024-07-11status Back On Market
-
2024-06-11status Pending
-
2024-06-10historical Active Under Contract
-
2024-04-29$285,000 Active
-
2024-04-29$285,000 New
-
2023-10-31historical
-
2023-07-18price $330,000
-
2023-06-23$350,000 New
-
2022-11-30status Under Contract
-
2022-11-29soldstatus $235,000 Sold
-
2022-11-29soldstatus $235,000 Closed
-
2022-09-24status Pending
-
2022-09-15historical Active Under Contract
-
2022-09-15historical Active Under Contract
-
2022-08-17price $285,000
-
2022-08-17price $285,000
-
2022-08-04$295,000 New
-
2022-08-02$295,000 Active
-
2014-10-08price $45,000
-
2013-09-10price $45,000
-
2013-09-10historical
-
2013-08-30soldstatus $45,000 Sold
-
2013-08-30price $49,900
-
2013-08-30soldstatus $45,000 Sold
-
2013-08-13status Under Contract
-
2013-08-13status Pending
-
2013-08-08price $49,900
-
2013-07-29$49,900 New
-
2013-07-29$49,900 Active
-
1986-07-01soldstatus $61,000
-
1980-05-23soldstatus $40,670
ⓘ Source: listings_history table (triggers on properties + properties_extension) + one-shot
backfill from property_details.listing_events for pre-trigger history.
Tax reassessment forecast GA · Resets to sale price
- Current annual tax
- $3,646 · $304/mo
- Projected year-2 tax
- $3,646 · $304/mo
- Expected delta
- $0/yr ($0/mo · 0.0%)
ⓘ Screening estimate from a state-policy table — verify with the county assessor before closing.
Climate risk First Street
- Flood 1/10 Low FEMA zone X (unshaded) · 0% chance over 30 yrs
- Wildfire 3/10 Moderate
- Heat 5/10 Major 7 d/yr ≥104°F today · 18 d/yr by 30 yrs out
- Wind 6/10 Major 27% chance of damaging wind over 30 yrs
- Air quality 3/10 Moderate 3 unhealthy d/yr today · 3 by 30 yrs out
Nearby sold comps map
Loading sold comps map…
Walkable amenities ~0.75 mi
Loading nearby amenities…
Taxation est. · year 1
- Rental income
- $23,089
- − Mortgage interest
- −$15,007
- − Property taxes
- −$3,646
- − Insurance
- −$1,340
- − Repairs & maintenance
- −$1,847
- − Management
- −$1,847
- − Depreciation
- −$7,793
- Taxable loss
- −$8,391
- Est. tax savings @ 24.0%
- +$2,014
- After-tax cash flow
- $-1,590/yr
For passive investors: Depreciation is non-cash, so a rental often shows a tax loss while cash-flowing — sheltering income. Rental losses are passive: they offset passive income freely, and up to $25,000/yr can offset ordinary (W-2) income if you actively participate and your MAGI is under $100k (phasing out to $0 by $150k); unused losses carry forward. On sale, claimed depreciation is recaptured at up to 25%, and gains may owe capital-gains tax (a 1031 exchange can defer both). Figures are a year-1 estimate at your 24.0% rate — not tax advice; consult a CPA.
Schools (NCES district)
- District
- Atlanta Public Schools
- NCES district ID
- 1300120
- Math proficiency
- 28% ▼ -6.00%
- Reading proficiency
- 35% ▼ -2.00%
- Median HH income
- $48,306
- Composite
- 27.27/100
- National rank
- #7006
- State rank
- #80 of 174 in GA
Livability — Atlanta
- Score
- 83/100
- State rank
- #6
- US rank
- #919
Category grades
Schools grade is shown separately in the Schools card above.
Census & demographics
- Census place
- Atlanta, GA
- County
- Fulton County · 1,094,430 people
- City population
- 629,525
- Metro
- Atlanta-Sandy Springs-Alpharetta, GA
- Population (ZIP)
- 34,953
- Household income
- $50,649
- Rent vs Own
- Severe rent burden
- 2825.0
Population outlook (Fulton County) Hauer SSP2
- Today (2025)
- 1,203,707 people
- By 2030
- 1,299,706 · +8.0%
- By 2040
- 1,488,256 · +23.6%
- By 2050
- 1,664,580 · +38.3%
- By 2075
- 2,036,072 · +69.2%
- By 2100
- 2,222,402 · +84.6%
Race, ethnicity, and origin ACS 2023
- Neighborhood character
- Predominantly Black (89%)
- Race & ethnicity
- Black 89% Hispanic / Latino 4% Two or more races 4% White 3%
- Common ancestry
- Hispanic 1%
- Foreign-born
- 5% · Canada
- Languages at home
- 93% English-only · Spanish 3% French/Haitian/Cajun 1% Korean 1%
Political lean MEDSL · Fulton
- 2024 margin
- Solid D (+44.9) · D 71.9% · R 27.0% · Other 1.1%
- 2008→2024 swing
- +9.8pp toward D · 2008: 35.0pp · 2024: 44.9pp
- All cycles
- 2024: D+44.9 2020: D+46.4 2016: D+42.1 2012: D+29.6 2008: D+35.0
Not yet ingested
- Civics
- —
Market trends
- HPI YoY
- ▼ -129.99%
- Current HPI
- 259.954
- Rent YoY
- ▼ -0.19%
- Metro
- Atlanta-Sandy Springs-Alpharetta, GA
- State GDP YoY
- ▲ 2.66%
- F500 in state
- 28
Industry mix (Fortune 500 HQ in GA)
| Industry | F500 HQs | Revenue |
|---|---|---|
| Paper / Packaging | 2 | $29B |
|
||
| Retail | 1 | $160B |
|
||
| Transportation / Logistics | 1 | $91B |
|
||
| Airlines | 1 | $62B |
|
||
| Consumer Goods | 1 | $47B |
|
||
| Utilities | 1 | $25B |
|
||
Price history
+558.7% since first listed37 events — show timeline
- 2026-06-11 Price Changed $267,900 GAMLS
- 2026-05-28 Price Changed $276,500 GAMLS
- 2026-05-14 Listed $285,000 GAMLS
- 2024-07-16 Relisted — FMLS
- 2024-07-16 Listing Removed — FMLS
- 2024-07-12 Listing Removed — GAMLS
- 2024-07-11 Relisted — GAMLS
- 2024-06-11 Pending — FMLS
- 2024-06-10 Contingent — GAMLS
- 2024-04-29 Listed $285,000 GAMLS
- 2024-04-29 Listed $285,000 FMLS
- 2023-10-31 Listing Removed — GAMLS
- 2023-07-18 Price Changed $330,000 GAMLS
- 2023-06-23 Listed $350,000 GAMLS
- 2022-11-30 Pending — GAMLS
- 2022-11-29 Sold (MLS) $235,000 FMLS
- 2022-11-29 Sold (MLS) $235,000 GAMLS
- 2022-09-24 Pending — FMLS
- 2022-09-15 Contingent — FMLS
- 2022-09-15 Contingent — GAMLS
- 2022-08-17 Price Changed $285,000 GAMLS
- 2022-08-17 Price Changed $285,000 FMLS
- 2022-08-04 Listed $295,000 GAMLS
- 2022-08-02 Listed $295,000 FMLS
- 2014-10-08 Price Changed $45,000 GAMLS
- 2013-09-10 Price Changed $45,000 FMLS
- 2013-09-10 Listing Removed — FMLS
- 2013-08-30 Sold (MLS) $45,000 GAMLS
- 2013-08-30 Sold (MLS) $45,000 FMLS
- 2013-08-30 Price Changed $49,900 FMLS
- 2013-08-13 Pending — GAMLS
- 2013-08-13 Pending — FMLS
- 2013-08-08 Price Changed $49,900 GAMLS
- 2013-07-29 Listed $49,900 GAMLS
- 2013-07-29 Listed $49,900 FMLS
- 1986-07-01 Sold (Public Records) $61,000 Public Records
- 1980-05-23 Sold (Public Records) $40,670 Public Records
Property tax history
+4.2%/yrLatest (2025): $3,646 · -0.1% YoY. Source: county tax records.
Cash-flow waterfall
monthlySold comps — $/sqft
last 12 mo · ≤1 miLoading sold comps…