 🏗️ New Construction
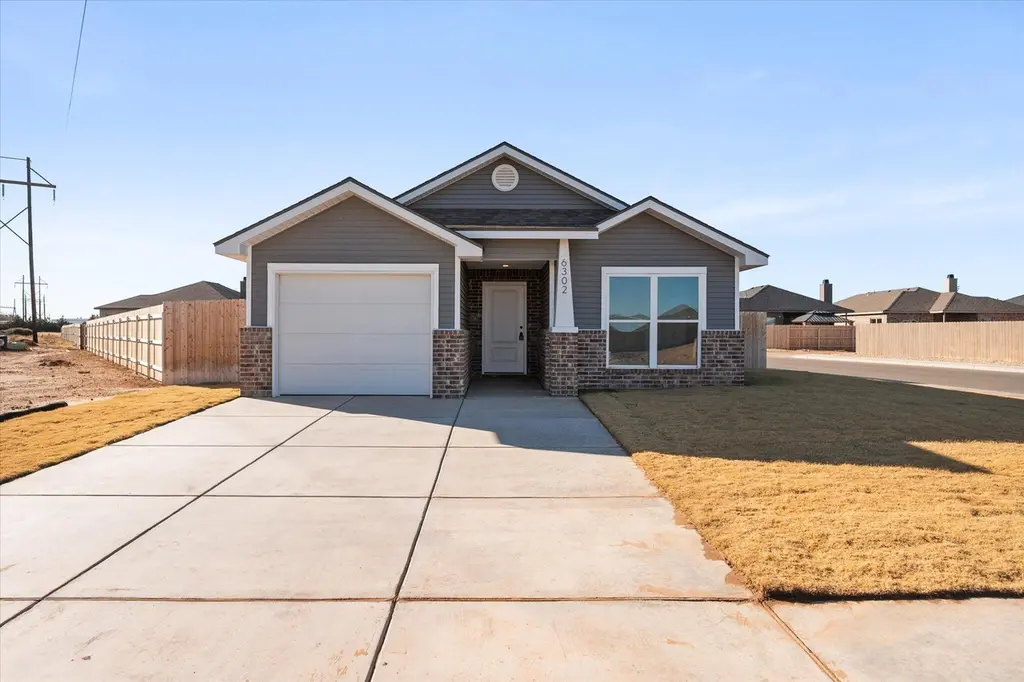
6302 Volney Ave · Lubbock, TX
Flood risk No data
- FEMA flood zone
- —
- Chance of flooding over 30 yrs
- —
- Est. flood insurance / yr
- —
Fire risk No data
- Est. fire insurance / yr
- —
Heat risk No data
- Hot days now (above threshold)
- —
- Hot days in 30 yrs
- —
Wind risk No data
- Chance of severe wind over 30 yrs
- —
Air-quality risk No data
- Unhealthy air days now
- —
- Unhealthy air days in 30 yrs
- —
Risk factors via First Street. Map © Google.
Why this score? — see what drove the D+ grade
The composite is a weighted blend of 9 inputs, each scored 0–100. Each bar is that input's sub-score; the figure is the points it added to the 100-point composite (weight × sub-score).
- Cash flow +18.8/30.0
- ARV discount +7.5/15.0
- DSCR +5.9/10.0
- Schools +4.4/10.0
- Livability +4.0/5.0
- 1% rule +3.9/10.0
- Rent growth +2.5/5.0
- Condition / age +2.5/5.0
- Appreciation +0.0/10.0
$191,000
🖨 Deal sheet 📄 Offer letter ✓ Due diligence
Listing remarks
Buy NOW and get up to $7,000 Use-It-Your-Way Cash! This home offers timeless style and modern functionality with its brick and vinyl exterior and welcoming covered front entry. Inside, luxury vinyl plank flooring enhances the common areas, leading to an open-concept kitchen, living, and dining space perfect for entertaining. The kitchen shines with granite countertops, a spacious island with bar seating, and stainless steel appliances, all complemented by premium fixtures. Relax in the secluded master suite, complete with a walk-in closet for added convenience.
Key facts
- Spacious island
- Open-concept kitchen
- Covered front entry
Tags
Neighborhood map
What this means for you Summary
Snapshot
- This is a 3-bed/2.0-bath other listed at $191k.
Deal economics
- At list price, monthly cash flow is $191 ($2k/yr) — positive.
- The deal already cash-flows at list — no discount required.
- To meet the 1% rule (rent ≥ 1% of price), the offer needs to be $170k (10.9% below list).
- Recommended offer: $170k (10.9% below list) — sets the bar for 1% rule.
Location & tenants
- Location reads 80/100 on livability (#37 in TX, #1,749 nationally) — a professional / high-income tenant draw. Strengths: commute A+, cost of living A+, housing A+; Watch: employment C-, crime F.
- Frenship ISD (urban): math 47% / reading 54% proficiency, ranked #162 of 826 in TX (top 20%) — acceptable for families but not a draw, mixed tenant base, ~2y average lease.
- Zoned schools: Frenship H S (math 44% / reading 65%, grade C-, #379 of 1,632 statewide, top 26%, 3,247 students, 46% FRL).
- Market conditions: Rents soft (-0.1%/yr); 610 active listings in the ZIP; 6 comparable units currently listed for rent nearby; rentals lingering (median 44d on market — plan ~5-8 weeks vacancy on turnover, expect pricing pressure); 67% of comp listings sitting > 30 days — soft ceiling on asking rent; 2,219 units permitted in Lubbock County in 2024 (252 in 5+ unit buildings).
- This rent runs 33% of the median local income ($62k/yr) — at the standard rent-burdened threshold; future hikes will face affordability resistance.
Forward outlook
- Local home prices are declining (-3.0%/yr); year-one equity from $1k of loan paydown is wiped out by about $6k of value loss. Plan a longer hold.
- Lubbock County population projected at +39% by 2050 — long-run rental-demand tailwind backs the buy-and-hold thesis.
Negotiation context
- It's been on market 114 days — a 9% lower offer ($174k) is reasonable based on typical stale-listing flexibility.
- 6 sale attempts; this cycle's ask has dropped $15k (7%) from the opening price — seller is motivated, your offer sets the floor, not the list.
Questions for the listing agent
- It's been on market 114 days. Have you received any prior offers? Is the seller open to a 11% concession, seller financing, or rate buy-down credit?
- Why hasn't it sold? Are there any deal-killer items the seller is aware of (foundation, flood, title, zoning, code violations)?
- Is there a deadline driving the sale (1031 exchange, divorce, estate, relocation)? That informs how much negotiation room exists.
- Schools are D-rated, which usually means shorter tenancies and higher turnover. Who's the typical renter profile here, and what's been the actual vacancy rate?
- Crime grade is F in this area — have there been break-ins, vandalism, or insurance claims at this property in the last 3 years? What carrier currently insures it and at what premium?
- The area grade is low — what's the realistic commute time and amenity access for the typical tenant pool here? Any planned neighborhood developments (good or bad) we should know about?
- What's the average days-on-market for RENTAL listings here right now (not sales)? A rising rental-DOM trend means longer vacancies and softer asking-rent achievability than the comps imply.
- What's the recent tenant-quality profile in this submarket — average credit score on applications, eviction rate, late-payment / NSF rate, and stable-employment percentage? A property-management company in the area should have these aggregated.
- How much new for-sale + rental construction is in the pipeline within 1–3 miles? Heavy new supply typically softens prices + rents 12–24 months out; constrained supply supports both.
Investment metrics
- 1% rule
- 0.89% ✗
- Cap rate
- 7.49%
- Cash-on-cash
- 4.29%
- DSCR
- 1.19
- GRM
- 9.4
CMA / ARV
No comps found within radius.
Projected returns pro-forma
-3.0% appreciation · 0.0% rent growth · sell at horizon
- IRR
- -12.7%
- Equity multiple
- 0.55×
- Total profit
- $-23,840
- Equity at exit
- $28,479
- IRR
- -8.4%
- Equity multiple
- 0.54×
- Total profit
- $-24,668
- Equity at exit
- $16,514
Cash invested: $53,480 (down + closing). Projections, not guarantees.
Landlord ↔ Tenant lean methodology
- Overall (STATE)
- 87 Strongly Landlord-Friendly
- State Texas
- 87 Strongly Landlord-Friendly · R+5
- County
- — inherits STATE
- City
- — inherits STATE
ZIP-level market 79407
- Home prices YoY
- -16.3%
- Rents YoY
- -0.1%
- Active inventory
- 610
- Price-to-rent
- 9.4×
Monthly cashflow live
- Estimated rent
- $1,702 high interval (Pro) →
- Mortgage (P&I)
- −$1,002
- Tax from tax record
- −$72 /mo · $865/yr
- Insurance
- −$80
- HOA
- −$0
- Vacancy / Maint / Mgmt
- −$357
- Net cashflow
- $191
Break-even live
UW: 25.0% down · 7.5% · 30yr · 1.5% tax · 5.0% vac · 8.0% maint · 8.0% mgmt
Financing live
Cash to close
- Down payment
- $47,750
- Closing costs
- $5,730
- Reserves months
- —
- Total cash needed
- —
Loan-product check · same deal, 3 products live
Conventional
25% down · 7.5% · 30yr
- Down + closing
- —
- Monthly P&I
- —
- Monthly cashflow
- —
- DSCR
- —
- Eligible?
- —
Personal DTI + credit; lowest rate.
DSCR
20% down · 8.5% · 30yr
- Down + closing
- —
- Monthly P&I
- —
- Monthly cashflow
- —
- DSCR
- —
- Eligible?
- —
No personal income docs; deal must DSCR.
Hard money
10% down · 12.0% · 12mo
- Down + closing
- —
- Monthly P&I
- —
- Monthly cashflow
- —
- DSCR
- —
- Eligible?
- —
Short-term bridge; refi at stabilization.
Rent comps 6 comps
| Address | Beds | Baths | Sqft | Rent | $/sqft | DOM | Units | Dist |
|---|---|---|---|---|---|---|---|---|
| 6313 Volney Ave Lubbock, TX | 2.0 | 2.0 | 1006 | $1,495 | $1.49 | 21d | 1 | 0.04mi |
| 5865 Virginia Ave Lubbock, TX | 3.0 | 2.0 | 1500 | $1,749 | $1.17 | 43d | 1 | 0.14mi |
| 5805 Virginia Ave Lubbock, TX | 3.0 | 2.0 | 1377 | $1,800 | $1.31 | 43d | 1 | 0.31mi |
| 1218 Preston TRL Unit A Wolfforth, TX | 3.0 | 2.0 | 1420 | $1,500 | $1.06 | 21d | 1 | 0.90mi |
| 1216 Donald Preston Dr Unit B Wolfforth, TX | 3.0 | 2.0 | 1450 | $1,400 | $0.97 | 43d | 1 | 1.46mi |
| 1224 Donald Preston Dr Unit B Wolfforth, TX | 3.0 | 2.0 | 1400 | $1,550 | $1.11 | 43d | 1 | 1.46mi |
Listing history 15 events
-
2026-03-13status Pending
-
2026-02-17status Active
-
2026-01-13status Pending
-
2026-01-07price $191,000
-
2026-01-06status Active
-
2025-12-02status Pending
-
2025-11-19status Active
-
2025-10-31status Pending
-
2025-10-20price $194,830
-
2025-09-30status Active
-
2025-09-05status Pending
-
2025-08-27price $200,000
-
2025-08-11status Active
-
2025-07-14status Pending
-
2025-06-30$205,580 Active
ⓘ Source: listings_history table (triggers on properties + properties_extension) + one-shot
backfill from property_details.listing_events for pre-trigger history.
Tax reassessment forecast TX · Resets to sale price
- Current annual tax
- $865 · $72/mo
- Projected year-2 tax
- $3,495 · $291/mo
- Expected delta
- +$2,631/yr (+$219/mo · 304.2%)
ⓘ Screening estimate from a state-policy table — verify with the county assessor before closing.
Nearby sold comps map
Loading sold comps map…
Walkable amenities ~0.75 mi
Loading nearby amenities…
Taxation est. · year 1
- Rental income
- $20,422
- − Mortgage interest
- −$10,699
- − Property taxes
- −$865
- − Insurance
- −$955
- − Repairs & maintenance
- −$1,634
- − Management
- −$1,634
- − Depreciation
- −$5,556
- Taxable loss
- −$921
- Est. tax savings @ 24.0%
- +$221
- After-tax cash flow
- $2,515/yr
For passive investors: Depreciation is non-cash, so a rental often shows a tax loss while cash-flowing — sheltering income. Rental losses are passive: they offset passive income freely, and up to $25,000/yr can offset ordinary (W-2) income if you actively participate and your MAGI is under $100k (phasing out to $0 by $150k); unused losses carry forward. On sale, claimed depreciation is recaptured at up to 25%, and gains may owe capital-gains tax (a 1031 exchange can defer both). Figures are a year-1 estimate at your 24.0% rate — not tax advice; consult a CPA.
Schools (NCES district)
- District
- Frenship ISD
- NCES district ID
- 4819830
- Math proficiency
- 47% ▼ -8.00%
- Reading proficiency
- 54% ▬ 0.00%
- Median HH income
- $54,376
- Composite
- 43.59/100
- National rank
- #2976
- State rank
- #162 of 826 in TX
Livability — Lubbock
- Score
- 80/100
- State rank
- #37
- US rank
- #1749
Category grades
Schools grade is shown separately in the Schools card above.
Census & demographics
- Census place
- Lubbock, TX
- County
- Lubbock County · 293,542 people
- City population
- 283,030
- Metro
- Lubbock, TX
- Population (ZIP)
- 24,000
- Household income
- $61,509
- Rent vs Own
- Severe rent burden
- 1914.0
Population outlook (Lubbock County) Hauer SSP2
- Today (2025)
- 345,960 people
- By 2030
- 371,449 · +7.4%
- By 2040
- 424,539 · +22.7%
- By 2050
- 481,150 · +39.1%
- By 2075
- 633,467 · +83.1%
- By 2100
- 746,853 · +115.9%
Race, ethnicity, and origin ACS 2023
- Neighborhood character
- Diverse neighborhood (Simpson 0.56)
- Race & ethnicity
- White 58% Hispanic / Latino 31% Two or more races 17% Black 4% Asian 3%
- Hispanic origin (detail)
- Mexican 27%
- Common ancestry
- Italian 2% Lithuanian 1% Slovak 1%
- Foreign-born
- 5% · Canada, South Korea, China
- Languages at home
- 83% English-only · Spanish 13% Other Asian/Pacific 1% Chinese 1%
Political lean MEDSL · Lubbock
- 2024 margin
- Solid R (+39.5) · D 29.7% · R 69.2% · Other 1.0%
- 2008→2024 swing
- -2.8pp toward R · 2008: -36.7pp · 2024: -39.5pp
- All cycles
- 2024: R+39.5 2020: R+32.2 2016: R+38.4 2012: R+40.9 2008: R+36.7
Not yet ingested
- Civics
- —
Market trends
- HPI YoY
- ▼ -44.87%
- Current HPI
- 229.9895
- Rent YoY
- ▼ -0.07%
- Metro
- Lubbock, TX
- State GDP YoY
- ▲ 3.95%
- F500 in state
- 110
Industry mix (Fortune 500 HQ in TX)
| Industry | F500 HQs | Revenue |
|---|---|---|
| Energy | 16 | $1,198B |
|
||
| Technology | 5 | $198B |
|
||
| Engineering / Construction | 4 | $72B |
|
||
| Energy Services | 3 | $60B |
|
||
| Utilities | 3 | $41B |
|
||
| Healthcare | 2 | $330B |
|
||
Price history
-7.1% since first listed15 events — show timeline
- 2026-03-13 Pending — LARMLS
- 2026-02-17 Relisted — LARMLS
- 2026-01-13 Pending — LARMLS
- 2026-01-07 Price Changed $191,000 LARMLS
- 2026-01-06 Relisted — LARMLS
- 2025-12-02 Pending — LARMLS
- 2025-11-19 Relisted — LARMLS
- 2025-10-31 Pending — LARMLS
- 2025-10-20 Price Changed $194,830 LARMLS
- 2025-09-30 Relisted — LARMLS
- 2025-09-05 Pending — LARMLS
- 2025-08-27 Price Changed $200,000 LARMLS
- 2025-08-11 Relisted — LARMLS
- 2025-07-14 Pending — LARMLS
- 2025-06-30 Listed $205,580 LARMLS
Cash-flow waterfall
monthlySold comps — $/sqft
last 12 mo · ≤1 miLoading sold comps…