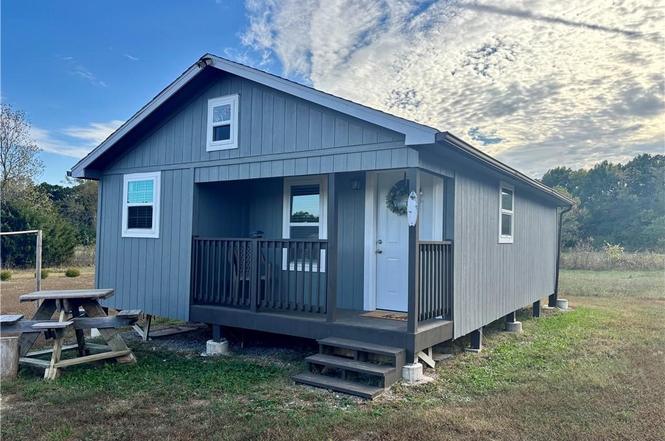
10 Lucky 1 Cir · Mound City, KS
Flood risk 1/10 · Minimal
- FEMA flood zone
- X (unshaded)
- Chance of flooding over 30 yrs
- 0.0%
- Est. flood insurance / yr
- $507 – $1,088
Fire risk 5/10 · Moderate
- Est. fire insurance / yr
- $1,154 – $2,142
Heat risk 5/10 · Moderate
- Hot days now (above 108°F)
- 7 days/yr
- Hot days in 30 yrs
- 18 days/yr
Wind risk 2/10 · Minimal
- Chance of severe wind over 30 yrs
- 1.0%
Air-quality risk 2/10 · Minimal
- Unhealthy air days now
- 1 days/yr
- Unhealthy air days in 30 yrs
- 1 days/yr
Risk factors via First Street. Map © Google.
Why this score? — see what drove the D+ grade
The composite is a weighted blend of 9 inputs, each scored 0–100. Each bar is that input's sub-score; the figure is the points it added to the 100-point composite (weight × sub-score).
- Cash flow +12.2/30.0
- Appreciation +9.6/10.0
- ARV discount +7.5/15.0
- 1% rule +3.8/10.0
- DSCR +3.6/10.0
- Livability +3.2/5.0
- Schools +2.6/10.0
- Rent growth +2.5/5.0
- Condition / age +2.5/5.0
$90,000
🖨 Deal sheet (PDF) 📄 Offer letter ✓ Due diligence
Listing remarks
Discover your peaceful getaway at this beautiful new lake house! Perfectly located near the water, this property offers the ideal retreat for those seeking relaxation, fun, and privacy. Enjoy fishing, golf, and the serenity of nature — all just steps away from your door. This fully new home is thoughtfully designed for comfort and convenience. It features a water cistern system, electric generator hookup, and plenty of space to unwind with family and friends. Whether you’re looking for a vacation escape, a weekend retreat, or your own slice of quiet paradise away from the city — this lake home has it all!
Key facts
- 3,920 sq ft lot
- Built 2022
- Listed 244 days
Property features AI
Finance
- Other: Taxes listed (not included per instructions)
- Financial info: No investor or income/expense details provided
- HOA & community: Homeowners association present; HOA fee of $223 annually; No maintenance provided by association
Exterior
- Parking: Off-street parking
- Security: No security features listed
- Utilities: No public water service listed; No public sewer service listed
- Home design: Single family residence; Residential property; Ranch style; One-story
- Construction: Wood siding exterior; Composition roof; Built within last 2 years
- Exterior features: Lot about 3,920 square feet; Not in a flood plain
Interior
- Kitchen: No appliances listed
- Bedrooms: 1 bedroom (first floor)
- Flooring: No flooring information provided
- Bathrooms: 1 full bathroom (first floor)
- Heating & cooling: No central heating; Window unit(s) for cooling
- Interior features: Ranch floor plan; Slab foundation
- Laundry & utility: No laundry features listed
Neighborhood map
What this means for you Summary
Snapshot
- This is a 1-bed/1.0-bath single-family listed at $90k.
Deal economics
- At list price, monthly cash flow is $-18 ($-215/yr) — negative.
- To cash-flow at today's rent, offer at most $87k (2.9% below list).
- To meet the 1% rule (rent ≥ 1% of price), the offer needs to be $79k (12.4% below list).
- Recommended offer: $79k (12.4% below list) — sets the bar for 1% rule.
Location & tenants
- Location reads 63/100 on livability (#339 in KS) — a middle-class / working-renter tenant base. Strengths: cost of living A+, housing A+, health & safety A; Watch: crime F, amenities F, commute F.
- Jayhawk (rural): math 32% / reading 30% proficiency, ranked #95 of 169 in KS (top 56%) — families likely to look elsewhere, expect single-tenant / working-renter base with shorter leases.
- Zoned schools: Jayhawk Elementary (math 37% / reading 37%, grade F, #358 of 684 statewide, top 56%, 316 students, 62% FRL); Jayhawk-Linn High (math 22% / reading 17%, grade F, #216 of 327 statewide, top 70%, 259 students, 55% FRL).
- Market conditions: 53 active listings in the ZIP; 97 units permitted in Linn County in 2024 (0 in 5+ unit buildings).
Forward outlook
- In year one you build about $9k of equity ($622 loan paydown + $8k appreciation (9.2% local appreciation)).
- At projected returns (9.2% appreciation + 3.0% rent growth), your $25k cash investment doubles in ~3 years — after that, you're playing with house money.
- By year 4, paydown + projected appreciation supports a ~$31k cash-out refi (75% LTV) — recoverable capital for the next deal without selling this one.
Negotiation context
- It's been on market 245 days — a 12% lower offer ($79k) is reasonable based on typical stale-listing flexibility.
Risks & watch-outs
- Climate carrying-cost: moderate wildfire risk; extreme-heat days projected 7→18/yr by 2055 (HVAC capex compounding) — expect insurance premiums to compound above CPI over the hold.
Questions for the listing agent
- What do current leases actually rent for vs. the listed asking? Can we see a recent rent roll and the last 12 months of T-12 income?
- It's been on market 245 days. Have you received any prior offers? Is the seller open to a 12% concession, seller financing, or rate buy-down credit?
- What does the HOA fee cover, when was the last increase, and are there any pending special assessments or reserve-fund shortfalls?
- Why hasn't it sold? Are there any deal-killer items the seller is aware of (foundation, flood, title, zoning, code violations)?
- Is there a deadline driving the sale (1031 exchange, divorce, estate, relocation)? That informs how much negotiation room exists.
- Schools are D-rated, which usually means shorter tenancies and higher turnover. Who's the typical renter profile here, and what's been the actual vacancy rate?
- Crime grade is F in this area — have there been break-ins, vandalism, or insurance claims at this property in the last 3 years? What carrier currently insures it and at what premium?
- The area grade is low — what's the realistic commute time and amenity access for the typical tenant pool here? Any planned neighborhood developments (good or bad) we should know about?
- What's the average days-on-market for RENTAL listings here right now (not sales)? A rising rental-DOM trend means longer vacancies and softer asking-rent achievability than the comps imply.
- What's the recent tenant-quality profile in this submarket — average credit score on applications, eviction rate, late-payment / NSF rate, and stable-employment percentage? A property-management company in the area should have these aggregated.
- How much new for-sale + rental construction is in the pipeline within 1–3 miles? Heavy new supply typically softens prices + rents 12–24 months out; constrained supply supports both.
Investment metrics
- 1% rule
- 0.88% ✗
- Cap rate
- 6.05%
- Cash-on-cash
- -0.85%
- DSCR
- 0.96
- GRM
- 9.5
CMA / ARV
No comps found within radius.
Projected returns pro-forma
9.18% appreciation · 3.0% rent growth · sell at horizon
- IRR
- 21.9%
- Equity multiple
- 2.70×
- Total profit
- $42,911
- Equity at exit
- $75,771
- IRR
- 19.9%
- Equity multiple
- 6.01×
- Total profit
- $126,226
- Equity at exit
- $158,066
Cash invested: $25,200 (down + closing). Projections, not guarantees.
Landlord ↔ Tenant lean methodology
- Overall (STATE)
- 83 Strongly Landlord-Friendly
- State Kansas
- 83 Strongly Landlord-Friendly · R+10
- County
- — inherits STATE
- City
- — inherits STATE
ZIP-level market 66056
- Home prices YoY
- 2.4%
- Active inventory
- 53
- Price-to-rent
- 9.5×
Monthly cashflow live
- Estimated rent
- $789 medium interval (Pro) →
- Mortgage (P&I)
- −$472
- Tax est. 1.5%
- −$112 /mo · $1,350/yr
- Insurance
- −$38
- HOA
- −$19
- Vacancy / Maint / Mgmt
- −$166
- Net cashflow
- $-18
Break-even live
Sensitivity live
| Price | -10% $44 | -5% $13 | +0% $-18 | +5% $-49 | +10% $-80 |
|---|---|---|---|---|---|
| Rent | -10% $-80 | -5% $-49 | +0% $-18 | +5% $13 | +10% $44 |
| Rate | -1.0pp $27 | -0.5pp $5 | base $-18 | +0.5pp $-41 | +1.0pp $-65 |
UW: 25.0% down · 7.5% · 30yr · 1.5% tax · 5.0% vac · 8.0% maint · 8.0% mgmt
Financing live
Cash to close
- Down payment
- $22,500
- Closing costs
- $2,700
- Reserves months
- —
- Total cash needed
- —
Loan-product check · same deal, 3 products live
Conventional
25% down · 7.5% · 30yr
- Down + closing
- —
- Monthly P&I
- —
- Monthly cashflow
- —
- DSCR
- —
- Eligible?
- —
Personal DTI + credit; lowest rate.
DSCR
20% down · 8.5% · 30yr
- Down + closing
- —
- Monthly P&I
- —
- Monthly cashflow
- —
- DSCR
- —
- Eligible?
- —
No personal income docs; deal must DSCR.
Hard money
10% down · 12.0% · 12mo
- Down + closing
- —
- Monthly P&I
- —
- Monthly cashflow
- —
- DSCR
- —
- Eligible?
- —
Short-term bridge; refi at stabilization.
HOA detail
- Monthly dues
- $19 · $228/yr
- Likely covers
- waterelectric
Listing history 20 events
-
2026-06-21days on market $90,000 Active 245 DOM
-
2026-06-21days on market $90,000 Active 244 DOM
-
2026-06-18days on market $90,000 Active 242 DOM
-
2026-06-17days on market $90,000 Active 241 DOM
-
2026-06-16days on market $90,000 Active 240 DOM
-
2026-06-15days on market $90,000 Active 239 DOM
-
2026-06-13days on market $90,000 Active 237 DOM
-
2026-06-12days on market $90,000 Active 236 DOM
-
2026-06-09days on market $90,000 Active 233 DOM
-
2026-06-08days on market $90,000 Active 232 DOM
-
2026-06-07days on market $90,000 Active 231 DOM
-
2026-06-05days on market $90,000 Active 229 DOM
-
2026-06-04days on market $90,000 Active 227 DOM
-
2026-06-02days on market $90,000 Active 226 DOM
-
2026-06-01days on market $90,000 Active 225 DOM
-
2026-05-31days on market $90,000 Active 224 DOM
-
2026-05-31days on market $90,000 Active 223 DOM
-
2026-03-28price $90,000
-
2025-10-20$95,000 Active
-
2025-10-19historical $95,000
ⓘ Source: listings_history table (triggers on properties + properties_extension) + one-shot
backfill from property_details.listing_events for pre-trigger history.
Climate risk First Street
- Flood 1/10 Low FEMA zone X (unshaded) · 0% chance over 30 yrs
- Wildfire 5/10 Major
- Heat 5/10 Major 7 d/yr ≥108°F today · 18 d/yr by 30 yrs out
- Wind 2/10 Low 100% chance of damaging wind over 30 yrs
- Air quality 2/10 Low 1 unhealthy d/yr today · 1 by 30 yrs out
Nearby sold comps map
Loading sold comps map…
Walkable amenities ~0.75 mi
Loading nearby amenities…
Taxation est. · year 1
- Rental income
- $9,465
- − Mortgage interest
- −$5,041
- − Property taxes
- −$1,350
- − Insurance
- −$450
- − Repairs & maintenance
- −$757
- − Management
- −$757
- − HOA
- −$228
- − Depreciation
- −$2,618
- Taxable loss
- −$1,737
- Est. tax savings @ 24.0%
- +$417
- After-tax cash flow
- $202/yr
For passive investors: Depreciation is non-cash, so a rental often shows a tax loss while cash-flowing — sheltering income. Rental losses are passive: they offset passive income freely, and up to $25,000/yr can offset ordinary (W-2) income if you actively participate and your MAGI is under $100k (phasing out to $0 by $150k); unused losses carry forward. On sale, claimed depreciation is recaptured at up to 25%, and gains may owe capital-gains tax (a 1031 exchange can defer both). Figures are a year-1 estimate at your 24.0% rate — not tax advice; consult a CPA.
Schools (NCES district)
- District
- Jayhawk
- NCES district ID
- 2007750
- Math proficiency
- 32% ▬ 0.00%
- Reading proficiency
- 30% ▼ -3.00%
- Median HH income
- $42,226
- Composite
- 26.3/100
- National rank
- #7244
- State rank
- #95 of 169 in KS
Livability — Mound City
- Score
- 63/100
- State rank
- #339
- US rank
- #15276
Category grades
Schools grade is shown separately in the Schools card above.
Census & demographics
- Population (ZIP)
- 1,428
Population outlook (Linn County) Hauer SSP2
- Today (2025)
- 9,581 people
- By 2030
- 9,574 · -0.1%
- By 2040
- 9,550 · -0.3%
- By 2050
- 9,483 · -1.0%
- By 2075
- 9,510 · -0.7%
- By 2100
- 8,873 · -7.4%
Race, ethnicity, and origin ACS 2023
- Neighborhood character
- Predominantly White (92%)
- Race & ethnicity
- White 92% Two or more races 3% Hispanic / Latino 2%
- Common ancestry
- Italian 5% Lithuanian 3% Slovak 1%
- Languages at home
- 99% English-only · Spanish 1%
Political lean MEDSL · Linn
- 2024 margin
- Solid R (+64.6) · D 17.0% · R 81.6% · Other 1.4%
- 2008→2024 swing
- -28.6pp toward R · 2008: -36.0pp · 2024: -64.6pp
- All cycles
- 2024: R+64.6 2020: R+62.8 2016: R+62.1 2012: R+45.9 2008: R+36.0
Not yet ingested
- Civics
- —
Market trends
- HPI YoY
- ▲ 9.18%
- Current HPI
- 397.2471
- Rent YoY
- —
- Metro
- —
- State GDP YoY
- —
- F500 in state
- 0
Price history
-5.3% since first listed3 events — show timeline
- 2026-03-28 Price Changed $90,000 Heartland MLS as Distributed by MLS Grid
- 2025-10-20 Listed $95,000 Heartland MLS as Distributed by MLS Grid
- 2025-10-19 Coming Soon $95,000 Heartland MLS as Distributed by MLS Grid
Cash-flow waterfall
monthlySold comps — $/sqft
last 12 mo · ≤1 miLoading sold comps…