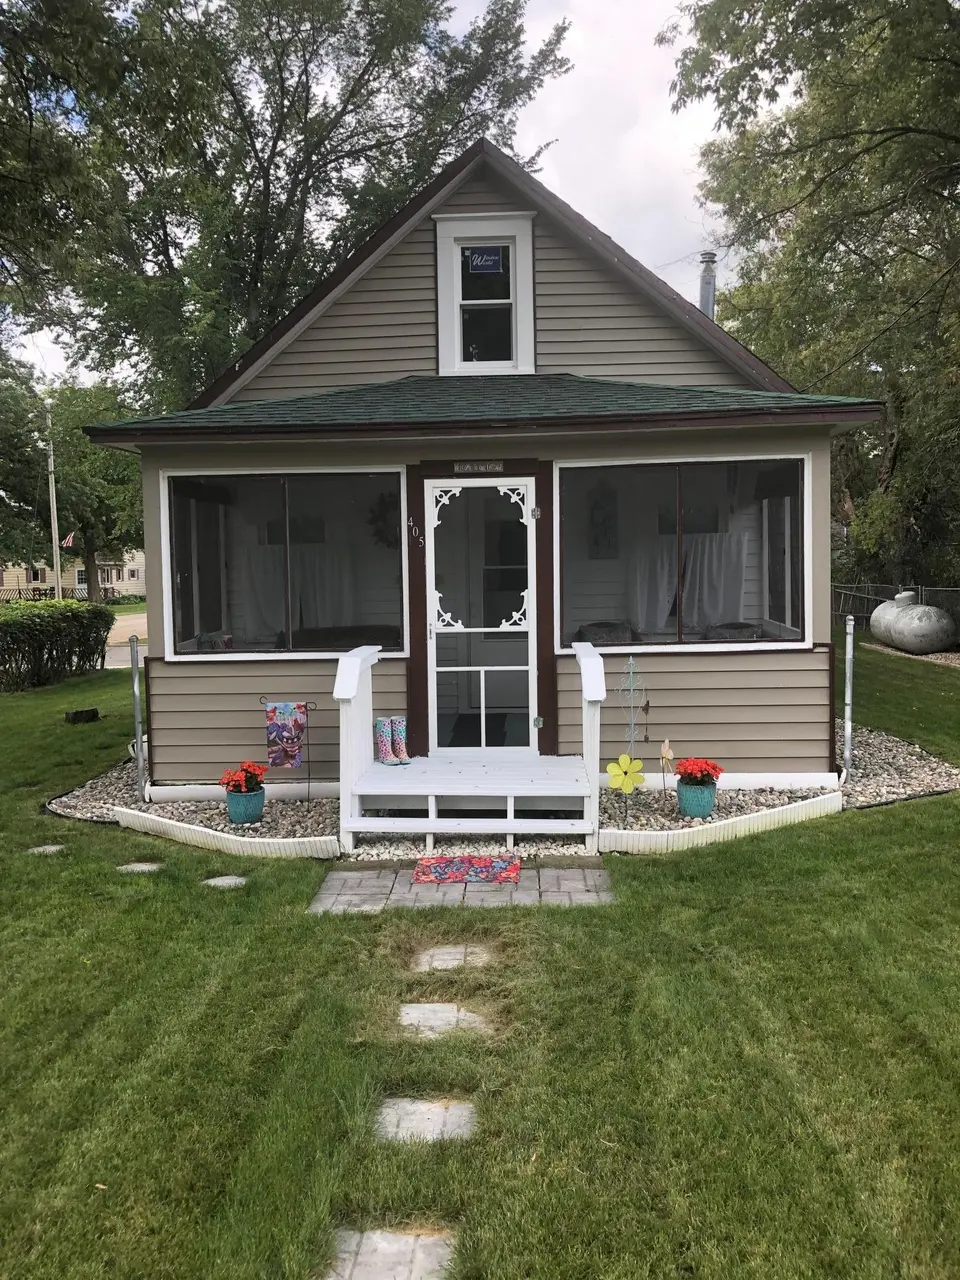
405 Hoff Ave · Vining, MN
Flood risk 1/10 · Minimal
- FEMA flood zone
- —
- Chance of flooding over 30 yrs
- 0.0%
- Est. flood insurance / yr
- —
Fire risk 3/10 · Minor
- Est. fire insurance / yr
- $888 – $1,650
Heat risk 1/10 · Minimal
- Hot days now (above 95°F)
- 7 days/yr
- Hot days in 30 yrs
- 13 days/yr
Wind risk 2/10 · Minimal
- Chance of severe wind over 30 yrs
- —
Air-quality risk 3/10 · Minor
- Unhealthy air days now
- 3 days/yr
- Unhealthy air days in 30 yrs
- 3 days/yr
Risk factors via First Street. Map © Google.
Why this score? — see what drove the C grade
The composite is a weighted blend of 9 inputs, each scored 0–100. Each bar is that input's sub-score; the figure is the points it added to the 100-point composite (weight × sub-score).
- Cash flow +18.6/30.0
- Appreciation +10.0/10.0
- ARV discount +7.5/15.0
- DSCR +5.9/10.0
- Schools +5.4/10.0
- 1% rule +4.0/10.0
- Livability +3.2/5.0
- Rent growth +2.5/5.0
- Condition / age +2.5/5.0
$89,000
🖨 Deal sheet (PDF) 📄 Offer letter ✓ Due diligence
Listing remarks MLS
Ideal lake cabin alternative. Fenced yard, new siding, Good shingles blacktopped streets, quiet neighborhood
Key facts
- Screened-in porch
- Fenced yard
- Outdoor entertaining
Tags
Property features AI
Exterior
- Parking: Asphalt driveway; 1-car garage (approx. 20 x 24)
- Utilities: Drilled water source; Holding tank sewer; Propane fuel
- Home design: Residential property; One level; Porch
- Construction: Poured concrete foundation; Asphalt roof (over 8 years old)
- Exterior features: Vinyl exterior; Deck, enclosed porch, and porch; Chain link fencing; Light tree coverage
Interior
- Kitchen: Range; Refrigerator
- Bedrooms: 2 bedrooms
- Bathrooms: 1 full bathroom (main floor)
- Heating & cooling: Forced air heating; Window air conditioning units
- Interior features: Water softener (owned); Fuel tank (rented)
- Laundry & utility: No laundry room (none indicated); Electric water heater
Neighborhood map
What this means for you Summary
Snapshot
- This is a 2-bed/1.0-bath single-family listed at $89k.
Deal economics
- At list price, monthly cash flow is $86 ($1k/yr) — positive.
- The deal already cash-flows at list — no discount required.
- To meet the 1% rule (rent ≥ 1% of price), the offer needs to be $80k (9.9% below list).
- Recommended offer: $80k (9.9% below list) — sets the bar for 1% rule.
Location & tenants
- Location reads 63/100 on livability (#630 in MN) — a middle-class / working-renter tenant base. Strengths: cost of living A+, housing A+; Watch: health & safety C-, employment D+, crime D.
- Henning Public School District (rural): math 60% / reading 65% proficiency, ranked #128 of 467 in MN (top 27%) — acceptable for families but not a draw, mixed tenant base, ~2y average lease.
- Market conditions: 5 active listings in the ZIP; 140 units permitted in Otter Tail County in 2024 (48 in 5+ unit buildings).
Forward outlook
- In year one you build about $10k of equity ($615 loan paydown + $9k appreciation (10.0% local appreciation)).
- At projected returns (10.0% appreciation + 3.0% rent growth), your $25k cash investment doubles in ~3 years — after that, you're playing with house money.
- By year 4, paydown + projected appreciation supports a ~$34k cash-out refi (75% LTV) — recoverable capital for the next deal without selling this one.
Negotiation context
- Only 8 days on market — expect competitive offers; lowballing is unlikely to land.
- 2 sale attempts since 11y ago with the ask held roughly flat each time — persistent listings suggest the price (not the market) is what's stuck; bring a comps-based counter.
- Current owner paid $33k; list at $89k implies a 172% gain — meaningful room to come down on a strong offer.
Risks & watch-outs
- Watch-outs: built in 1930 — expect roof / HVAC / electrical / plumbing capex.
Questions for the listing agent
- Built in 1930 — when were the roof, HVAC, electrical panel, plumbing, and water heater last replaced?
- Is there a deadline driving the sale (1031 exchange, divorce, estate, relocation)? That informs how much negotiation room exists.
- Schools are D-rated, which usually means shorter tenancies and higher turnover. Who's the typical renter profile here, and what's been the actual vacancy rate?
- Crime grade is D in this area — have there been break-ins, vandalism, or insurance claims at this property in the last 3 years? What carrier currently insures it and at what premium?
- What's the average days-on-market for RENTAL listings here right now (not sales)? A rising rental-DOM trend means longer vacancies and softer asking-rent achievability than the comps imply.
- What's the recent tenant-quality profile in this submarket — average credit score on applications, eviction rate, late-payment / NSF rate, and stable-employment percentage? A property-management company in the area should have these aggregated.
- How much new for-sale + rental construction is in the pipeline within 1–3 miles? Heavy new supply typically softens prices + rents 12–24 months out; constrained supply supports both.
Investment metrics
- 1% rule
- 0.90% ✗
- Cap rate
- 7.46%
- Cash-on-cash
- 4.16%
- DSCR
- 1.19
- GRM
- 9.2
CMA / ARV
No comps found within radius.
Projected returns pro-forma
10.0% appreciation · 3.0% rent growth · sell at horizon
- IRR
- 27.3%
- Equity multiple
- 3.16×
- Total profit
- $53,947
- Equity at exit
- $80,178
- IRR
- 23.8%
- Equity multiple
- 7.20×
- Total profit
- $154,478
- Equity at exit
- $172,907
Cash invested: $24,920 (down + closing). Projections, not guarantees.
Landlord ↔ Tenant lean methodology
- Overall (STATE)
- 46 Balanced
- State Minnesota
- 46 Balanced · D+2
- County
- — inherits STATE
- City
- — inherits STATE
ZIP-level market 56588
- Home prices YoY
- 7.8%
- Active inventory
- 5
- Price-to-rent
- 9.2×
Monthly cashflow live
- Estimated rent
- $802 medium interval (Pro) →
- Mortgage (P&I)
- −$467
- Tax from tax record
- −$44 /mo · $522/yr
- Insurance
- −$37
- HOA
- −$0
- Vacancy / Maint / Mgmt
- −$168
- Net cashflow
- $86
Break-even live
Sensitivity live
| Price | -10% $137 | -5% $112 | +0% $86 | +5% $61 | +10% $36 |
|---|---|---|---|---|---|
| Rent | -10% $23 | -5% $55 | +0% $86 | +5% $118 | +10% $150 |
| Rate | -1.0pp $131 | -0.5pp $109 | base $86 | +0.5pp $63 | +1.0pp $40 |
UW: 25.0% down · 7.5% · 30yr · 1.5% tax · 5.0% vac · 8.0% maint · 8.0% mgmt
Financing live
Cash to close
- Down payment
- $22,250
- Closing costs
- $2,670
- Reserves months
- —
- Total cash needed
- —
Loan-product check · same deal, 3 products live
Conventional
25% down · 7.5% · 30yr
- Down + closing
- —
- Monthly P&I
- —
- Monthly cashflow
- —
- DSCR
- —
- Eligible?
- —
Personal DTI + credit; lowest rate.
DSCR
20% down · 8.5% · 30yr
- Down + closing
- —
- Monthly P&I
- —
- Monthly cashflow
- —
- DSCR
- —
- Eligible?
- —
No personal income docs; deal must DSCR.
Hard money
10% down · 12.0% · 12mo
- Down + closing
- —
- Monthly P&I
- —
- Monthly cashflow
- —
- DSCR
- —
- Eligible?
- —
Short-term bridge; refi at stabilization.
Listing history 4 events
-
2026-05-15$89,000 Active 521-char remark
-
2015-09-16soldstatus $32,700 108-char remark
Show marketing remark (108 chars)
Ideal lake cabin alternative. Fenced yard, new siding, Good shingles blacktopped streets, quiet neighborhood
-
2015-07-10$34,900 108-char remark
Show marketing remark (108 chars)
Ideal lake cabin alternative. Fenced yard, new siding, Good shingles blacktopped streets, quiet neighborhood
-
2009-07-29soldstatus $16,000
ⓘ Source: listings_history table (triggers on properties + properties_extension) + one-shot
backfill from property_details.listing_events for pre-trigger history.
Tax reassessment forecast MN · Partial reset (capped growth)
- Current annual tax
- $522 · $44/mo
- Projected year-2 tax
- $759 · $63/mo
- Expected delta
- +$237/yr (+$20/mo · 45.5%)
ⓘ Screening estimate from a state-policy table — verify with the county assessor before closing.
Climate risk First Street
- Flood 1/10 Low 0% chance over 30 yrs
- Wildfire 3/10 Moderate
- Heat 1/10 Low 7 d/yr ≥95°F today · 13 d/yr by 30 yrs out
- Wind 2/10 Low
- Air quality 3/10 Moderate 3 unhealthy d/yr today · 3 by 30 yrs out
Nearby sold comps map
Loading sold comps map…
Walkable amenities ~0.75 mi
Loading nearby amenities…
Taxation est. · year 1
- Rental income
- $9,627
- − Mortgage interest
- −$4,985
- − Property taxes
- −$522
- − Insurance
- −$445
- − Repairs & maintenance
- −$770
- − Management
- −$770
- − Depreciation
- −$2,589
- Taxable loss
- −$455
- Est. tax savings @ 24.0%
- +$109
- After-tax cash flow
- $1,146/yr
For passive investors: Depreciation is non-cash, so a rental often shows a tax loss while cash-flowing — sheltering income. Rental losses are passive: they offset passive income freely, and up to $25,000/yr can offset ordinary (W-2) income if you actively participate and your MAGI is under $100k (phasing out to $0 by $150k); unused losses carry forward. On sale, claimed depreciation is recaptured at up to 25%, and gains may owe capital-gains tax (a 1031 exchange can defer both). Figures are a year-1 estimate at your 24.0% rate — not tax advice; consult a CPA.
Schools (NCES district)
- District
- Henning Public School District
- NCES district ID
- 2713860
- Math proficiency
- 60% ▲ 5.00%
- Reading proficiency
- 65% ▼ -5.00%
- Median HH income
- $43,860
- Composite
- 54.06/100
- National rank
- #2990
- State rank
- #128 of 467 in MN
Livability — Vining
- Score
- 63/100
- State rank
- #630
- US rank
- #15043
Category grades
Schools grade is shown separately in the Schools card above.
Census & demographics
- Census place
- Vining, MN
- Population (ZIP)
- 458
Population outlook (Otter Tail County) Hauer SSP2
- Today (2025)
- 58,183 people
- By 2030
- 58,267 · +0.1%
- By 2040
- 57,999 · -0.3%
- By 2050
- 57,183 · -1.7%
- By 2075
- 57,638 · -0.9%
- By 2100
- 54,697 · -6.0%
Race, ethnicity, and origin ACS 2023
- Neighborhood character
- Predominantly White (95%)
- Race & ethnicity
- White 95% Two or more races 5%
- Common ancestry
- Portuguese 37% Romanian 9% Scottish 2%
- Foreign-born
- 0%
- Languages at home
- 98% English-only · Other Indo-European 1%
Political lean MEDSL · Otter Tail
- 2024 margin
- Solid R (+34.2) · D 32.1% · R 66.3% · Other 1.6%
- 2008→2024 swing
- -21.3pp toward R · 2008: -12.9pp · 2024: -34.2pp
- All cycles
- 2024: R+34.2 2020: R+32.5 2016: R+35.9 2012: R+21.2 2008: R+12.9
Not yet ingested
- Civics
- —
Market trends
- HPI YoY
- ▲ 11.47%
- Current HPI
- 158.06
- Rent YoY
- —
- Metro
- —
- State GDP YoY
- ▲ 2.41%
- F500 in state
- 34
Industry mix (Fortune 500 HQ in MN)
| Industry | F500 HQs | Revenue |
|---|---|---|
| Healthcare | 2 | $407B |
|
||
| Retail | 2 | $150B |
|
||
| Consumer Goods | 2 | $32B |
|
||
| Industrial Machinery | 2 | $6B |
|
||
| Agriculture | 1 | $40B |
|
||
| Healthcare / Medical Devices | 1 | $32B |
|
||
Price history
+456.2% since first listed5 events — show timeline
- 2026-05-24 Pending — NORTHSTARMLS as Distributed by MLS Grid
- 2026-05-15 Listed $89,000 NORTHSTARMLS as Distributed by MLS Grid
- 2015-09-16 Sold (MLS) $32,700 NORTHSTARMLS as Distributed by MLS Grid
- 2015-07-10 Listed $34,900 NORTHSTARMLS as Distributed by MLS Grid
- 2009-07-29 Sold (Public Records) $16,000 Public Records
Property tax history
+6.9%/yrLatest (2025): $522 · -8.7% YoY. Source: county tax records.
Cash-flow waterfall
monthlySold comps — $/sqft
last 12 mo · ≤1 miLoading sold comps…