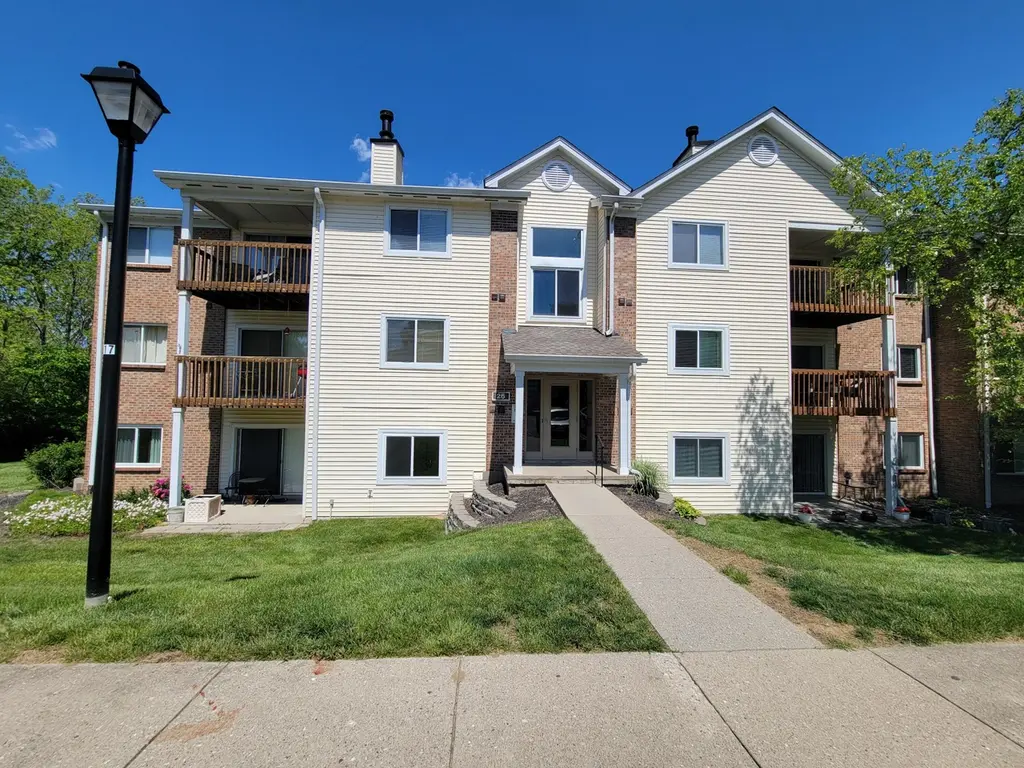
25 Rio Grande Cir #7 · Florence, KY
Flood risk 1/10 · Minimal
- FEMA flood zone
- X (unshaded)
- Chance of flooding over 30 yrs
- 0.0%
- Est. flood insurance / yr
- $507 – $1,088
Fire risk 1/10 · Minimal
- Est. fire insurance / yr
- $839 – $1,559
Heat risk 4/10 · Minor
- Hot days now (above 102°F)
- 7 days/yr
- Hot days in 30 yrs
- 19 days/yr
Wind risk 2/10 · Minimal
- Chance of severe wind over 30 yrs
- 1.0%
Air-quality risk 2/10 · Minimal
- Unhealthy air days now
- 1 days/yr
- Unhealthy air days in 30 yrs
- 3 days/yr
Risk factors via First Street. Map © Google.
Why this score? — see what drove the D grade
The composite is a weighted blend of 9 inputs, each scored 0–100. Each bar is that input's sub-score; the figure is the points it added to the 100-point composite (weight × sub-score).
- Cash flow +11.0/30.0
- ARV discount +7.5/15.0
- 1% rule +4.7/10.0
- Schools +4.1/10.0
- Livability +3.9/5.0
- Rent growth +3.4/5.0
- DSCR +3.2/10.0
- Condition / age +2.5/5.0
- Appreciation +0.0/10.0
$174,900
🖨 Deal sheet (PDF) 📄 Offer letter ✓ Due diligence
Listing remarks
Welcome to this beautifully updated, move-in ready condo tucked away in a quiet, private community in Florence--just minutes from Union, KY, and located in the highly desirable Ryle High School district. Conveniently positioned behind the new Publix, you'll enjoy easy access to shopping, dining, medical facilities, churches, and everything Northern Kentucky has to offer, with quick access across the river as well. Inside, this condo features a stylish industrial design with a modern edge. You'll find all new stainless steel appliances, fresh paint throughout, and striking custom panel accent walls in the entry, living room, dining room, and bathrooms. Each bedroom showcases its own unique c
Key facts
- Tiled backsplash
- Private community
- Parking
Tags
Property features AI
Finance
- Other: Directions: From I71, go west on Hwy 42 for 4.5 miles, right onto old US 42, right on Rio Grande Cir.
- HOA & community: Monthly association fee of $299; Community has an association
Exterior
- Parking: Assigned parking (no garage)
- Utilities: Public water; Public sewer
- Home design: Single-family residence; One level
- Construction: Built in 1991; Aluminum siding and brick exterior; Shingle roof; Slab foundation
- Exterior features: Balcony
Interior
- Kitchen: Electric oven and range; Dishwasher; Refrigerator
- Bedrooms: Primary bedroom (16 x 11); Second bedroom (11 x 11)
- Bathrooms: 2 full bathrooms; Primary bathroom (8 x 5); Second bathroom (8 x 5)
- Heating & cooling: Electric heating; Central air conditioning
- Interior features: Stainless steel appliances; Disposal; Microwave
- Laundry & utility: Washer; Dryer
Neighborhood map
What this means for you Summary
Snapshot
- This is a 2-bed/2.0-bath condo listed at $175k.
Deal economics
- At list price, monthly cash flow is $-74 ($-888/yr) — negative.
- To cash-flow at today's rent, offer at most $162k (7.5% below list).
- To meet the 1% rule (rent ≥ 1% of price), the offer needs to be $169k (3.2% below list).
- Recommended offer: $162k (7.5% below list) — sets the bar for cash-flow.
- Cap rate 5.8% vs local median 3.4% in Florence — top-decile yield for the area; either an underpriced asset or a hidden risk that comps aren't pricing in. Stress-test before assuming the spread holds.
Location & tenants
- Location reads 78/100 on livability (#82 in KY, #2,763 nationally) — a middle-class / working-renter tenant base. Strengths: commute A+, cost of living A+, housing A+; Watch: crime C-.
- Boone County (suburban): math 43% / reading 49% proficiency, ranked #12 of 165 in KY (top 7%) — families likely to look elsewhere, expect single-tenant / working-renter base with shorter leases.
- Zoned schools: Erpenbeck Elementary School (math 65% / reading 68%, grade B+, #17 of 676 statewide, top 2%, 702 students, 28% FRL); Ockerman Middle School (math 35% / reading 50%, grade D-, #47 of 217 statewide, top 22%, 653 students, 47% FRL); Larry A. Ryle High School (math 50% / reading 48%, grade D, #15 of 254 statewide, top 6%, 2,013 students, 32% FRL).
- Market conditions: Rents rising (+3.4%/yr); 271 active listings in the ZIP; 4 comparable units currently listed for rent nearby; rentals leasing fast (median 0d on market — plan ~1-2 weeks tenant-placement turnaround); solid renter incomes; 1,430 units permitted in Boone County in 2024 (928 in 5+ unit buildings).
Forward outlook
- Local home prices are declining (-3.0%/yr); year-one equity from $1k of loan paydown is wiped out by about $5k of value loss. Plan a longer hold.
- Boone County population projected at +24% by 2050 — long-run rental-demand tailwind backs the buy-and-hold thesis.
Negotiation context
- It's been on market 41 days — a 3% lower offer ($170k) is reasonable based on typical stale-listing flexibility.
- 9 sale attempts since 28y ago; this cycle's ask has dropped $15k (8%) from the opening price — seller is motivated, your offer sets the floor, not the list.
- Current owner paid $69k; list at $175k implies a 152% gain — meaningful room to come down on a strong offer.
Questions for the listing agent
- What do current leases actually rent for vs. the listed asking? Can we see a recent rent roll and the last 12 months of T-12 income?
- It's been on market 41 days. Have you received any prior offers? Is the seller open to a 7% concession, seller financing, or rate buy-down credit?
- What does the HOA fee cover, when was the last increase, and are there any pending special assessments or reserve-fund shortfalls?
- Any open or pending special assessments — roof, HVAC, plumbing, elevator, façade? What's the per-unit balance and payoff schedule, and is the seller paying it off at close or rolling it to the buyer?
- Is there a deadline driving the sale (1031 exchange, divorce, estate, relocation)? That informs how much negotiation room exists.
- Schools are D-rated, which usually means shorter tenancies and higher turnover. Who's the typical renter profile here, and what's been the actual vacancy rate?
- The area grade is low — what's the realistic commute time and amenity access for the typical tenant pool here? Any planned neighborhood developments (good or bad) we should know about?
- What's the average days-on-market for RENTAL listings here right now (not sales)? A rising rental-DOM trend means longer vacancies and softer asking-rent achievability than the comps imply.
- What's the recent tenant-quality profile in this submarket — average credit score on applications, eviction rate, late-payment / NSF rate, and stable-employment percentage? A property-management company in the area should have these aggregated.
- How much new apartment / multifamily construction is in the pipeline within 1–3 miles? Heavy new supply (>2% of stock underway) typically softens rents 12–24 months out; light construction supports rent growth.
Investment metrics
- 1% rule
- 0.97% ✗
- Cap rate
- 5.79%
- Cash-on-cash
- -1.81%
- DSCR
- 0.92
- GRM
- 8.6
CMA / ARV
No comps found within radius.
Projected returns pro-forma
-3.0% appreciation · 3.42% rent growth · sell at horizon
- IRR
- -18.6%
- Equity multiple
- 0.34×
- Total profit
- $-32,187
- Equity at exit
- $26,078
- IRR
- -9.9%
- Equity multiple
- 0.38×
- Total profit
- $-30,515
- Equity at exit
- $15,122
Cash invested: $48,972 (down + closing). Projections, not guarantees.
Landlord ↔ Tenant lean methodology
- Overall (STATE)
- 83 Strongly Landlord-Friendly
- State Kentucky
- 83 Strongly Landlord-Friendly · R+16
- County
- — inherits STATE
- City
- — inherits STATE
ZIP-level market 41042
- Rents YoY
- 3.4%
- Active inventory
- 271
- Price-to-rent
- 8.6×
Monthly cashflow live
- Estimated rent
- $1,693 medium interval (Pro) →
- Mortgage (P&I)
- −$917
- Tax from tax record
- −$102 /mo · $1,228/yr
- Insurance
- −$73
- HOA
- −$319
- Lot rent
- −$0
- Vacancy / Maint / Mgmt
- −$356
- Net cashflow
- $-74
Break-even live
Sensitivity live
| Price | -10% $25 | -5% $-25 | +0% $-74 | +5% $-124 | +10% $-173 |
|---|---|---|---|---|---|
| Rent | -10% $-208 | -5% $-141 | +0% $-74 | +5% $-7 | +10% $60 |
| Rate | -1.0pp $14 | -0.5pp $-30 | base $-74 | +0.5pp $-119 | +1.0pp $-165 |
UW: 25.0% down · 7.5% · 30yr · 1.5% tax · 5.0% vac · 8.0% maint · 8.0% mgmt
Financing live
Cash to close
- Down payment
- $43,725
- Closing costs
- $5,247
- Reserves months
- —
- Total cash needed
- —
Loan-product check · same deal, 3 products live
Conventional
25% down · 7.5% · 30yr
- Down + closing
- —
- Monthly P&I
- —
- Monthly cashflow
- —
- DSCR
- —
- Eligible?
- —
Personal DTI + credit; lowest rate.
DSCR
20% down · 8.5% · 30yr
- Down + closing
- —
- Monthly P&I
- —
- Monthly cashflow
- —
- DSCR
- —
- Eligible?
- —
No personal income docs; deal must DSCR.
Hard money
10% down · 12.0% · 12mo
- Down + closing
- —
- Monthly P&I
- —
- Monthly cashflow
- —
- DSCR
- —
- Eligible?
- —
Short-term bridge; refi at stabilization.
Rent comps 4 comps
| Address | Beds | Baths | Sqft | Rent | $/sqft | DOM | Units | Dist |
|---|---|---|---|---|---|---|---|---|
| 1620 Corinthian Dr Florence, KY | 2.0–3.0 | 2.0 | 1165 | $1,432 | $1.23 | 0d | 18 | 0.95mi |
| 1000 Tamarack Cir Florence, KY | 2.0 | 1.0 | 825 | $1,367 | $1.66 | 0d | 6 | 1.07mi |
| 239 Landon Ct Florence, KY | 1.0–2.0 | 1.0–2.0 | 1228 | $2,244 | $1.83 | 0d | 11 | 1.08mi |
| 1919 Promenade CIR Union, KY | 1.0–3.0 | 1.0–2.5 | 1071 | $2,020 | $1.89 | 5d | 38 | 1.34mi |
HOA detail condo
- Monthly dues
- $319 · $3,828/yr
- Assessments
- None detected in remarks — confirm with the listing agent.
Listing history 50 events
-
2026-06-22days on market $174,900 Active 41 DOM
-
2026-06-21days on market $174,900 Active 40 DOM
-
2026-06-18days on market $174,900 Active 37 DOM
-
2026-06-17days on market $174,900 Active 36 DOM
-
2026-06-16days on market $174,900 Active 35 DOM
-
2026-06-15days on market $174,900 Active 34 DOM
-
2026-06-13days on market $174,900 Active 32 DOM
-
2026-06-09days on market $174,900 Active 28 DOM
-
2026-06-08days on market $174,900 Active 27 DOM
-
2026-06-07days on market $174,900 Active 26 DOM
-
2026-06-05days on market $174,900 Active 23 DOM
-
2026-06-03days on market $174,900 Active 22 DOM
-
2026-06-02days on market $174,900 Active 21 DOM
-
2026-06-01days on market $174,900 Active 20 DOM
-
2026-06-01price $174,900 Active 19 DOM
-
2026-05-31days on market $189,900 Active 19 DOM
-
2026-05-12$189,900 Active
-
2025-10-29historical
-
2025-10-19price $159,900
-
2025-09-22price $164,800
-
2025-08-12price $164,900
-
2025-08-09price $169,900
-
2025-07-24$170,000 Active
-
2023-01-20historical
-
2023-01-16$155,000 Active
-
2011-11-04historical
-
2011-05-04$79,900
-
2005-09-26soldstatus $69,300
-
2005-05-14historical
-
2004-11-14$76,500
-
2001-04-06soldstatus $68,600
-
2001-03-31soldstatus $68,600
-
2000-10-07$69,400
-
2000-10-03historical
-
2000-10-03historical
-
2000-06-29$72,900
-
2000-06-29$72,900
-
1998-07-29soldstatus $63,000
-
1998-07-28soldstatus $63,000
-
1998-06-03$63,900
-
1998-05-18soldstatus $60,000
-
1995-09-05soldstatus $60,400
-
1994-09-14soldstatus $54,000
-
1994-04-01soldstatus $60,500
-
1992-09-16soldstatus $54,900
-
1992-07-06soldstatus $56,225
-
1991-12-18soldstatus $56,900
-
1991-05-23soldstatus $49,449
-
1991-04-22soldstatus $59,945
-
1991-02-13soldstatus $51,135
ⓘ Source: listings_history table (triggers on properties + properties_extension) + one-shot
backfill from property_details.listing_events for pre-trigger history.
Tax reassessment forecast KY · Resets to sale price
- Current annual tax
- $1,228 · $102/mo
- Projected year-2 tax
- $1,504 · $125/mo
- Expected delta
- +$276/yr (+$23/mo · 22.5%)
ⓘ Screening estimate from a state-policy table — verify with the county assessor before closing.
Climate risk First Street
- Flood 1/10 Low FEMA zone X (unshaded) · 0% chance over 30 yrs
- Wildfire 1/10 Low
- Heat 4/10 Moderate 7 d/yr ≥102°F today · 19 d/yr by 30 yrs out
- Wind 2/10 Low 100% chance of damaging wind over 30 yrs
- Air quality 2/10 Low 1 unhealthy d/yr today · 3 by 30 yrs out
Nearby sold comps map
Loading sold comps map…
Walkable amenities ~0.75 mi
Loading nearby amenities…
Taxation est. · year 1
- Rental income
- $20,315
- − Mortgage interest
- −$9,797
- − Property taxes
- −$1,228
- − Insurance
- −$874
- − Repairs & maintenance
- −$1,625
- − Management
- −$1,625
- − HOA
- −$3,828
- − Depreciation
- −$5,088
- Taxable loss
- −$3,751
- Est. tax savings @ 24.0%
- +$900
- After-tax cash flow
- $12/yr
For passive investors: Depreciation is non-cash, so a rental often shows a tax loss while cash-flowing — sheltering income. Rental losses are passive: they offset passive income freely, and up to $25,000/yr can offset ordinary (W-2) income if you actively participate and your MAGI is under $100k (phasing out to $0 by $150k); unused losses carry forward. On sale, claimed depreciation is recaptured at up to 25%, and gains may owe capital-gains tax (a 1031 exchange can defer both). Figures are a year-1 estimate at your 24.0% rate — not tax advice; consult a CPA.
Schools (NCES district)
- District
- Boone County
- NCES district ID
- 2100510
- Math proficiency
- 43% ▼ -10.00%
- Reading proficiency
- 49% ▼ -12.00%
- Median HH income
- $68,096
- Composite
- 41.18/100
- National rank
- #3550
- State rank
- #12 of 165 in KY
Livability — Florence
- Score
- 78/100
- State rank
- #82
- US rank
- #2763
Category grades
Schools grade is shown separately in the Schools card above.
Census & demographics
- Census place
- Florence, KY
- County
- Boone County · 99,563 people
- City population
- 57,634
- Metro
- Cincinnati, OH-KY-IN
- Population (ZIP)
- 57,634
- Household income
- $79,712
- Rent vs Own
- Severe rent burden
- 1397.0
Population outlook (Boone County) Hauer SSP2
- Today (2025)
- 144,066 people
- By 2030
- 152,005 · +5.5%
- By 2040
- 166,776 · +15.8%
- By 2050
- 178,974 · +24.2%
- By 2075
- 204,515 · +42.0%
- By 2100
- 215,306 · +49.4%
Race, ethnicity, and origin ACS 2023
- Neighborhood character
- Predominantly White (78%)
- Race & ethnicity
- White 78% Hispanic / Latino 8% Black 7% Two or more races 7% Asian 3%
- Hispanic origin (detail)
- Mexican 5%
- Common ancestry
- Romanian 3% Slovak 2% Iranian 2%
- Foreign-born
- 9% · Canada, Vietnam
- Languages at home
- 89% English-only · Spanish 5% French/Haitian/Cajun 2% Other Indo-European 2%
Political lean MEDSL · Boone
- 2024 margin
- Solid R (+37.2) · D 30.6% · R 67.8% · Other 1.7%
- 2008→2024 swing
- -2.7pp toward R · 2008: -34.5pp · 2024: -37.2pp
- All cycles
- 2024: R+37.2 2020: R+35.7 2016: R+41.8 2012: R+38.7 2008: R+34.5
Not yet ingested
- Civics
- —
Market trends
- HPI YoY
- ▼ -195.07%
- Current HPI
- 206.3259
- Rent YoY
- ▲ 3.42%
- Metro
- Cincinnati, OH-KY-IN
- State GDP YoY
- ▲ 1.81%
- F500 in state
- 4
Industry mix (Fortune 500 HQ in KY)
| Industry | F500 HQs | Revenue |
|---|---|---|
| Healthcare | 1 | $118B |
|
||
| Food / Beverage | 1 | $7B |
|
||
Price history
+234.9% since first listed40 events — show timeline
- 2026-05-12 Listed $189,900 NKMLS
- 2025-10-29 Listing Removed — NKMLS
- 2025-10-19 Price Changed $159,900 NKMLS
- 2025-09-22 Price Changed $164,800 NKMLS
- 2025-08-12 Price Changed $164,900 NKMLS
- 2025-08-09 Price Changed $169,900 NKMLS
- 2025-07-24 Listed $170,000 NKMLS
- 2023-01-20 Listing Removed — NKMLS
- 2023-01-16 Listed $155,000 NKMLS
- 2011-11-04 Listing Removed — NKMLS
- 2011-05-04 Listed $79,900 NKMLS
- 2005-09-26 Sold (Public Records) $69,300 Public Records
- 2005-05-14 Listing Removed — NKMLS
- 2004-11-14 Listed $76,500 NKMLS
- 2001-04-06 Sold (Public Records) $68,600 Public Records
- 2001-03-31 Sold (MLS) $68,600 NKMLS
- 2000-10-07 Listed $69,400 NKMLS
- 2000-10-03 Listing Removed — NKMLS
- 2000-10-03 Listing Removed — NKMLS
- 2000-06-29 Listed $72,900 NKMLS
- 2000-06-29 Listed $72,900 NKMLS
- 1998-07-29 Sold (Public Records) $63,000 Public Records
- 1998-07-28 Sold (MLS) $63,000 NKMLS
- 1998-06-03 Listed $63,900 NKMLS
- 1998-05-18 Sold (Public Records) $60,000 Public Records
- 1995-09-05 Sold (Public Records) $60,400 Public Records
- 1994-09-14 Sold (Public Records) $54,000 Public Records
- 1994-04-01 Sold (Public Records) $60,500 Public Records
- 1992-09-16 Sold (Public Records) $54,900 Public Records
- 1992-07-06 Sold (Public Records) $56,225 Public Records
- 1991-12-18 Sold (Public Records) $56,900 Public Records
- 1991-05-23 Sold (Public Records) $49,449 Public Records
- 1991-04-22 Sold (Public Records) $59,945 Public Records
- 1991-02-13 Sold (Public Records) $51,135 Public Records
- 1991-01-24 Sold (Public Records) $64,390 Public Records
- 1990-12-07 Sold (Public Records) $63,225 Public Records
- 1990-11-26 Sold (Public Records) $55,420 Public Records
- 1990-11-21 Sold (Public Records) $53,960 Public Records
- 1990-11-13 Sold (Public Records) $59,070 Public Records
- 1990-11-01 Sold (Public Records) $56,700 Public Records
Property tax history
+5.9%/yrLatest (2025): $1,228 · +2.0% YoY. Source: county tax records.
Cash-flow waterfall
monthlySold comps — $/sqft
last 12 mo · ≤1 miLoading sold comps…