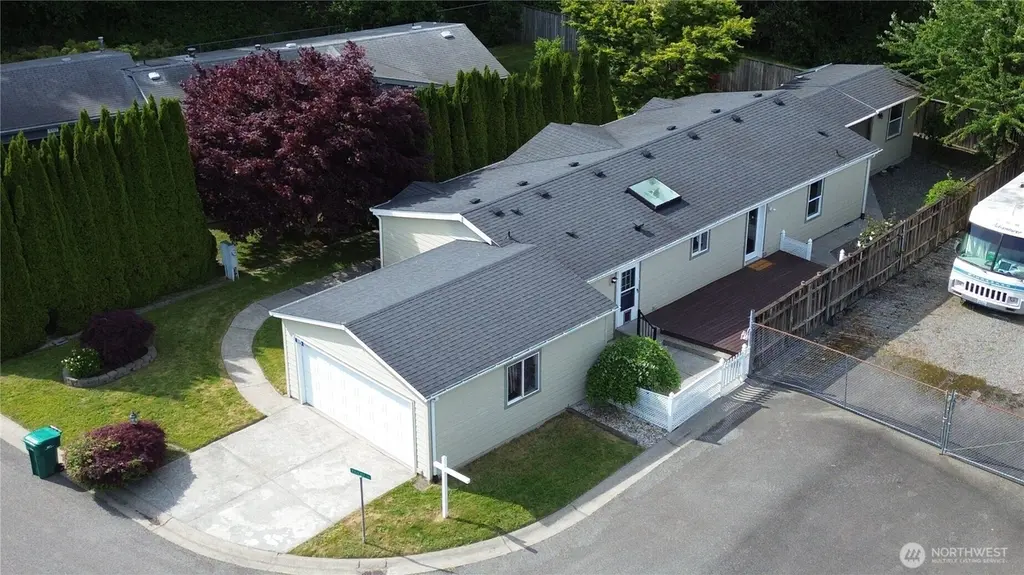
1115 Todd Pl · Burlington, WA
Flood risk 7/10 · Major
- FEMA flood zone
- X (shaded)
- Chance of flooding over 30 yrs
- 0.77%
- Est. flood insurance / yr
- $507 – $1,088
Fire risk 3/10 · Minor
- Est. fire insurance / yr
- $604 – $1,122
Heat risk 2/10 · Minimal
- Hot days now (above 82°F)
- 7 days/yr
- Hot days in 30 yrs
- 18 days/yr
Wind risk 1/10 · Minimal
- Chance of severe wind over 30 yrs
- —
Air-quality risk 5/10 · Moderate
- Unhealthy air days now
- 7 days/yr
- Unhealthy air days in 30 yrs
- 7 days/yr
Risk factors via First Street. Map © Google.
Why this score? — see what drove the D grade
The composite is a weighted blend of 9 inputs, each scored 0–100. Each bar is that input's sub-score; the figure is the points it added to the 100-point composite (weight × sub-score).
- Cash flow +18.4/30.0
- DSCR +5.8/10.0
- Rent growth +4.1/5.0
- Livability +4.1/5.0
- 1% rule +3.8/10.0
- Schools +3.5/10.0
- Condition / age +2.5/5.0
- ARV discount +0.1/15.0
- Appreciation +0.0/10.0
$269,500
🖨 Deal sheet 📄 Offer letter ✓ Due diligence
Listing remarks
Burlington Hill Estates, 55+ Gated Community, completely remodeled manufactured home, new stainless appliances, new cabinets, quartz countertops, new vanities, new flooring throughout, new kitchen sink & more. Open living/dining/kitchen with skylights in kitchen, access to side deck and backyard. Primary suite w/ walk-in shower & double vanity. Fully fenced side & backyard w/ deck, garden shed & powered shop. Attached 2 car garage with access through the laundry room. Great location, convenient to town, medical & I-5.
Key facts
- Gated community
- Quartz countertops
- Completely remodeled
Tags
Property features AI
Finance
- Other: Mobile home remains on site
- Financial info: Land lease: $1,150/month; Listing terms: Cash
- HOA & community: Located in Burlington Hill Estates (park approved for sale); Park has 32 homes; Senior community
Exterior
- Parking: Individual garage; Has garage; RV parking available in park
- Security: Security gate
- Utilities: Electric energy source; Public water (PUD); Sewer: City of Burlington; Power: Puget Sound Energy; Electric water heater
- Home design: Manufactured home (double wide); One story; Liberty model (2000 Liberty 52x27); Very good condition
- Construction: Cement plank siding; Composition roof; Concrete perimeter foundation; Manufactured after 6/15/1976
- Exterior features: Corner lot; Dead-end street; Paved lot; Patio/porch/deck; Cement planked exterior; Has view
Interior
- Kitchen: Kitchen with eating space; Dishwasher; Microwave; Refrigerator
- Bedrooms: 3 bedrooms
- Flooring: Laminate flooring
- Bathrooms: 1 full bath; 1 three-quarter bath; 1 bathtub; 2 showers; Primary bedroom with bath access
- Heating & cooling: Forced air heating
- Interior features: Water heater; Skylights; Vaulted ceilings; Ceiling fans; Double-pane windows
- Laundry & utility: Utility / laundry room; Water heater located in laundry room
Neighborhood map
What this means for you Summary
Snapshot
- This is a 3-bed/2.0-bath manufactured listed at $270k.
Deal economics
- At list price, monthly cash flow is $185 ($2k/yr) — positive.
- The deal already cash-flows at list — no discount required.
- To meet the 1% rule (rent ≥ 1% of price), the offer needs to be $238k (11.7% below list).
- Recommended offer: $238k (11.7% below list) — sets the bar for 1% rule.
- Cap rate 7.4% vs local median 2.2% in Burlington — top-decile yield for the area; either an underpriced asset or a hidden risk that comps aren't pricing in. Stress-test before assuming the spread holds.
Location & tenants
- Location reads 82/100 on livability (#65 in WA, #1,168 nationally) — a professional / high-income tenant draw. Strengths: amenities A+, commute A+, housing A+; Watch: crime C-.
- Burlington-Edison School District (suburban): math 32% / reading 42% proficiency, ranked #229 of 291 in WA (top 79%) — families likely to look elsewhere, expect single-tenant / working-renter base with shorter leases.
- Zoned schools: Burlington Edison High School (1,139 students, 58% FRL).
- Market conditions: Rents rising fast (+6.6%/yr); 91 active listings in the ZIP; 13 comparable units currently listed for rent nearby; rentals lingering (median 44d on market — plan ~5-8 weeks vacancy on turnover, expect pricing pressure); 54% of comp listings sitting > 30 days — soft ceiling on asking rent; solid renter incomes; 561 units permitted in Skagit County in 2024 (270 in 5+ unit buildings).
- This rent runs 33% of the median local income ($88k/yr) — at the standard rent-burdened threshold; future hikes will face affordability resistance.
Forward outlook
- Local home prices are declining (-3.0%/yr); year-one equity from $2k of loan paydown is wiped out by about $8k of value loss. Plan a longer hold.
- Skagit County population projected at +11% by 2050 — modest demand growth; plan on rents tracking national, not racing it.
Negotiation context
- Only 12 days on market — expect competitive offers; lowballing is unlikely to land.
- 2 sale attempts since 10y ago with the ask held roughly flat each time — persistent listings suggest the price (not the market) is what's stuck; bring a comps-based counter.
- Current owner paid $100k; list at $270k implies a 170% gain — meaningful room to come down on a strong offer.
Risks & watch-outs
- Watch-outs: flood insurance adds $66/mo.
- Climate carrying-cost: major flood risk — expect insurance premiums to compound above CPI over the hold.
Questions for the listing agent
- What's the actual annual flood-insurance premium (NFIP or private), and is the property in a SFHA with mandatory coverage?
- Is there a deadline driving the sale (1031 exchange, divorce, estate, relocation)? That informs how much negotiation room exists.
- Schools are D-rated, which usually means shorter tenancies and higher turnover. Who's the typical renter profile here, and what's been the actual vacancy rate?
- The area grade is low — what's the realistic commute time and amenity access for the typical tenant pool here? Any planned neighborhood developments (good or bad) we should know about?
- What's the average days-on-market for RENTAL listings here right now (not sales)? A rising rental-DOM trend means longer vacancies and softer asking-rent achievability than the comps imply.
- What's the recent tenant-quality profile in this submarket — average credit score on applications, eviction rate, late-payment / NSF rate, and stable-employment percentage? A property-management company in the area should have these aggregated.
- How much new for-sale + rental construction is in the pipeline within 1–3 miles? Heavy new supply typically softens prices + rents 12–24 months out; constrained supply supports both.
Investment metrics
- 1% rule
- 0.88% ✗
- Cap rate
- 7.41%
- Cash-on-cash
- 4.00%
- DSCR
- 1.18
- GRM
- 9.4
CMA / ARV
- ARV (on-the-fly)
- $231,660
- Comps found
- 4
Show comp detail 4 sales within ~0.75 mi
| Address | Dist | Beds/Ba | Sqft | Sold | Price | $/sf | Match |
|---|---|---|---|---|---|---|---|
| 579 Lupine Ln #16 | 0.05mi | 3/2.0 | 1,512 (+8%) | 0mo | $249,000 | $165 | 84 |
| 561 Andrew Dr #30 | 0.08mi | 3/2.0 | 1,320 (-6%) | 8mo | $160,000 | $121 | 79 |
| 619 Lupine Ln | 0.04mi | 3/2.0 | 1,588 (+13%) | 11mo | $200,000 | $126 | 67 |
| 1030 Courtney Ln | 0.13mi | 2/2.0 (-1) | 1,457 (+4%) | 23mo | $260,000 | $178 | 63 |
Match score weights: distance 35% · size 25% · config 20% · recency 20%. Top-matched comps best support the ARV.
Projected returns pro-forma
-3.0% appreciation · 6.57% rent growth · sell at horizon
- IRR
- -8.1%
- Equity multiple
- 0.69×
- Total profit
- $-23,094
- Equity at exit
- $40,183
- IRR
- 5.3%
- Equity multiple
- 1.45×
- Total profit
- $33,914
- Equity at exit
- $23,301
Cash invested: $75,460 (down + closing). Projections, not guarantees.
Landlord ↔ Tenant lean methodology
- Overall (STATE)
- 28 Tenant-Leaning
- State Washington
- 28 Tenant-Leaning · D+8
- County
- — inherits STATE
- City
- — inherits STATE
ZIP-level market 98233
- Home prices YoY
- -12.0%
- Rents YoY
- 6.6%
- Active inventory
- 91
- Price-to-rent
- 9.4×
Monthly cashflow live
- Estimated rent
- $2,380 high interval (Pro) →
- Mortgage (P&I)
- −$1,413
- Tax from tax record
- −$103 /mo · $1,242/yr
- Insurance
- −$112
- Flood insurance flood zone
- −$66 /mo · $798/yr
- HOA
- −$0
- Vacancy / Maint / Mgmt
- −$500
- Net cashflow
- $185
Break-even live
UW: 25.0% down · 7.5% · 30yr · 1.5% tax · 5.0% vac · 8.0% maint · 8.0% mgmt
Financing live
Cash to close
- Down payment
- $67,375
- Closing costs
- $8,085
- Reserves months
- —
- Total cash needed
- —
Loan-product check · same deal, 3 products live
Conventional
25% down · 7.5% · 30yr
- Down + closing
- —
- Monthly P&I
- —
- Monthly cashflow
- —
- DSCR
- —
- Eligible?
- —
Personal DTI + credit; lowest rate.
DSCR
20% down · 8.5% · 30yr
- Down + closing
- —
- Monthly P&I
- —
- Monthly cashflow
- —
- DSCR
- —
- Eligible?
- —
No personal income docs; deal must DSCR.
Hard money
10% down · 12.0% · 12mo
- Down + closing
- —
- Monthly P&I
- —
- Monthly cashflow
- —
- DSCR
- —
- Eligible?
- —
Short-term bridge; refi at stabilization.
Rent comps 13 comps
| Address | Beds | Baths | Sqft | Rent | $/sqft | DOM | Units | Dist |
|---|---|---|---|---|---|---|---|---|
| 540 N Pine St #2 Burlington, WA | 2.0 | 1.5 | 944 | $1,600 | $1.69 | 43d | 1 | 0.28mi |
| 180 Moss Ln Burlington, WA | 4.0 | 2.0 | 1400 | $3,300 | $2.36 | 43d | 1 | 0.53mi |
| 207 Lodean Dr Burlington, WA | 2.0 | 1.0 | 900 | $1,900 | $2.11 | 21d | 1 | 0.91mi |
| 204 Lodean Dr Burlington, WA | 2.0 | 1.0 | 900 | $1,938 | $2.15 | 21d | 2 | 0.91mi |
| 217 Lodean Dr Burlington, WA | 2.0 | 1.0 | 900 | $1,949 | $2.17 | 43d | 1 | 0.93mi |
| 104 Heritage Pl Burlington, WA | 1.0–3.0 | 1.0–2.0 | 917 | $2,525 | $2.75 | 21d | 13 | 0.96mi |
| 421 W Fairhaven Ave Burlington, WA | 2.0 | 1.5 | 1100 | $2,195 | $2.00 | 43d | 1 | 1.00mi |
| 421 E Fairhaven Ave Unit W Fairhaven Ave, 421 Burlington, WA | 2.0 | 1.5 | 1100 | $2,195 | $2.00 | 43d | 1 | 1.00mi |
| 425 E Fairhaven Ave Unit W Fairhaven Ave, 425 Burlington, WA | 2.0 | 1.5 | 1100 | $2,195 | $2.00 | 43d | 1 | 1.00mi |
| 1066 Vail Ln Burlington, WA | 3.0 | 2.0 | 1704 | $2,800 | $1.64 | 21d | 1 | 1.02mi |
| 592 Neff Cir Unit 592 Burlington, WA | 3.0 | 2.5 | 1490 | $2,600 | $1.74 | 43d | 1 | 1.13mi |
| 615 Peterson Rd Burlington, WA | 3.0 | 1.0–2.0 | 762 | $2,500 | $3.28 | 21d | 23 | 1.19mi |
| 677 Peterson Pl Burlington, WA | 2.0 | 1.0 | 943 | $2,100 | $2.23 | 21d | 1 | 1.27mi |
Listing history 17 events
-
2026-06-10status $269,500 Pending 12 DOM
-
2026-06-09days on market $269,500 Active 12 DOM
-
2026-06-08days on market $269,500 Active 11 DOM
-
2026-06-07days on market $269,500 Active 10 DOM
-
2026-06-05days on market $269,500 Active 7 DOM
-
2026-06-03days on market $269,500 Active 6 DOM
-
2026-06-02days on market $269,500 Active 5 DOM
-
2026-06-01days on market $269,500 Active 4 DOM
-
2026-05-31days on market $269,500 Active 3 DOM
-
2026-05-30days on market $269,500 Active 2 DOM
-
2026-05-23$269,500 Active
-
2016-09-09historical
-
2016-09-09soldstatus $99,999 Sold
-
2016-08-19status Pending
-
2016-08-08status Pending Inspection
-
2016-08-01price $99,999
-
2016-07-25$124,900 Active
ⓘ Source: listings_history table (triggers on properties + properties_extension) + one-shot
backfill from property_details.listing_events for pre-trigger history.
Tax reassessment forecast WA · Resets to sale price
- Current annual tax
- $1,242 · $103/mo
- Projected year-2 tax
- $2,641 · $220/mo
- Expected delta
- +$1,399/yr (+$117/mo · 112.7%)
ⓘ Screening estimate from a state-policy table — verify with the county assessor before closing.
Climate risk First Street
- Flood 7/10 Severe FEMA zone X (shaded) · 77% chance over 30 yrs
- Wildfire 3/10 Moderate
- Heat 2/10 Low 7 d/yr ≥82°F today · 18 d/yr by 30 yrs out
- Wind 1/10 Low
- Air quality 5/10 Major 7 unhealthy d/yr today · 7 by 30 yrs out
Nearby sold comps map
Loading sold comps map…
Walkable amenities ~0.75 mi
Loading nearby amenities…
Taxation est. · year 1
- Rental income
- $28,566
- − Mortgage interest
- −$15,096
- − Property taxes
- −$1,242
- − Insurance
- −$2,145
- − Repairs & maintenance
- −$2,285
- − Management
- −$2,285
- − Depreciation
- −$7,840
- Taxable loss
- −$2,328
- Est. tax savings @ 24.0%
- +$559
- After-tax cash flow
- $2,779/yr
For passive investors: Depreciation is non-cash, so a rental often shows a tax loss while cash-flowing — sheltering income. Rental losses are passive: they offset passive income freely, and up to $25,000/yr can offset ordinary (W-2) income if you actively participate and your MAGI is under $100k (phasing out to $0 by $150k); unused losses carry forward. On sale, claimed depreciation is recaptured at up to 25%, and gains may owe capital-gains tax (a 1031 exchange can defer both). Figures are a year-1 estimate at your 24.0% rate — not tax advice; consult a CPA.
Schools (NCES district)
- District
- Burlington-Edison School District
- NCES district ID
- 5300780
- Math proficiency
- 32% ▼ -1.00%
- Reading proficiency
- 42% ▲ 1.00%
- Median HH income
- $59,128
- Composite
- 35.41/100
- National rank
- #9782
- State rank
- #229 of 291 in WA
Livability — Burlington
- Score
- 82/100
- State rank
- #65
- US rank
- #1168
Category grades
Schools grade is shown separately in the Schools card above.
Census & demographics
- Census place
- Burlington, WA
- County
- Skagit County · 118,108 people
- City population
- 17,850
- Metro
- Mount Vernon-Anacortes, WA
- Population (ZIP)
- 17,850
- Household income
- $87,614
- Rent vs Own
- Severe rent burden
- 716.0
Population outlook (Skagit County) Hauer SSP2
- Today (2025)
- 131,498 people
- By 2030
- 135,556 · +3.1%
- By 2040
- 141,717 · +7.8%
- By 2050
- 145,714 · +10.8%
- By 2075
- 152,201 · +15.7%
- By 2100
- 147,980 · +12.5%
Race, ethnicity, and origin ACS 2023
- Neighborhood character
- Predominantly White (68%)
- Race & ethnicity
- White 68% Hispanic / Latino 24% Two or more races 8% Asian 2% Native American 1% Pacific Islander 1% Black 1%
- Hispanic origin (detail)
- Mexican 19%
- Common ancestry
- Portuguese 6% Lithuanian 2% Italian 2%
- Foreign-born
- 12% · Canada, Guatemala, South Korea
- Languages at home
- 81% English-only · Spanish 17% Tagalog/Filipino 1%
Political lean MEDSL · Skagit
- 2024 margin
- Lean D (+8.9) · D 52.9% · R 44.0% · Other 3.0%
- 2008→2024 swing
- -0.7pp no change · 2008: 9.6pp · 2024: 8.9pp
- All cycles
- 2024: D+8.9 2020: D+7.5 2016: D+3.2 2012: D+5.8 2008: D+9.6
Not yet ingested
- Civics
- —
Market trends
- HPI YoY
- ▼ -53.46%
- Current HPI
- 392.5216
- Rent YoY
- ▲ 6.57%
- Metro
- Mount Vernon-Anacortes, WA
- State GDP YoY
- ▲ 4.65%
- F500 in state
- 22
Industry mix (Fortune 500 HQ in WA)
| Industry | F500 HQs | Revenue |
|---|---|---|
| Retail | 2 | $269B |
|
||
| Technology / Retail | 1 | $638B |
|
||
| Technology | 1 | $245B |
|
||
| Telecommunications | 1 | $38B |
|
||
| Food / Beverage | 1 | $36B |
|
||
| Automotive / Trucks | 1 | $34B |
|
||
Price history
+115.8% since first listed7 events — show timeline
- 2026-05-23 Listed $269,500 NWMLS as Distributed by MLS Grid
- 2016-09-09 Delisted — NWMLS as Distributed by MLS Grid
- 2016-09-09 Sold (MLS) $99,999 NWMLS as Distributed by MLS Grid
- 2016-08-19 Pending — NWMLS as Distributed by MLS Grid
- 2016-08-08 Pending — NWMLS as Distributed by MLS Grid
- 2016-08-01 Price Changed $99,999 NWMLS as Distributed by MLS Grid
- 2016-07-25 Listed $124,900 NWMLS as Distributed by MLS Grid
Property tax history
+2.0%/yrLatest (2026): $1,242 · +9.2% YoY. Source: county tax records.
Cash-flow waterfall
monthlySold comps — $/sqft
last 12 mo · ≤1 miLoading sold comps…