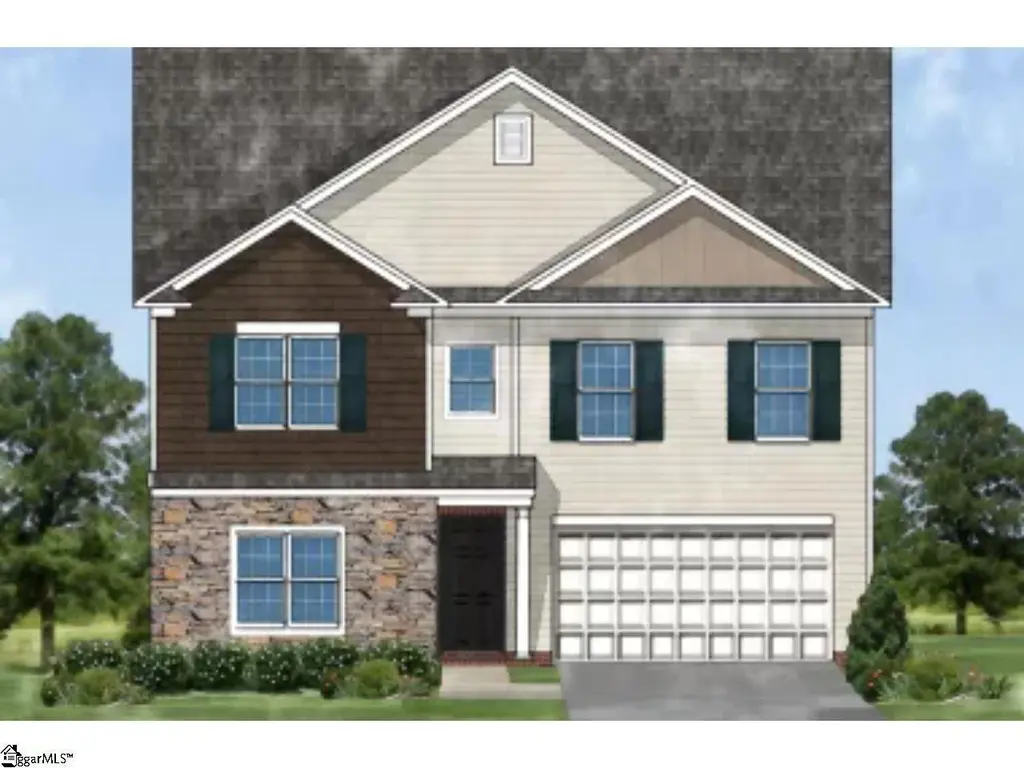
117 Bruinen Dr · Fountain Inn, SC
Flood risk No data
- FEMA flood zone
- —
- Chance of flooding over 30 yrs
- —
- Est. flood insurance / yr
- —
Fire risk No data
- Est. fire insurance / yr
- —
Heat risk No data
- Hot days now (above threshold)
- —
- Hot days in 30 yrs
- —
Wind risk No data
- Chance of severe wind over 30 yrs
- —
Air-quality risk No data
- Unhealthy air days now
- —
- Unhealthy air days in 30 yrs
- —
Risk factors via First Street. Map © Google.
Why this score? — see what drove the D- grade
The composite is a weighted blend of 9 inputs, each scored 0–100. Each bar is that input's sub-score; the figure is the points it added to the 100-point composite (weight × sub-score).
- Cash flow +10.9/30.0
- ARV discount +6.8/15.0
- Schools +4.2/10.0
- Livability +4.1/5.0
- Rent growth +3.6/5.0
- DSCR +3.2/10.0
- 1% rule +2.5/10.0
- Condition / age +2.5/5.0
- Appreciation +0.0/10.0
$345,000
🖨 Deal sheet 📄 Offer letter ✓ Due diligence
Listing remarks
Built in 2022, this like-new four-bedroom home blends modern comfort with convenient Upstate living in the heart of the rapidly growing Fountain Inn, area. Nestled just minutes from downtown Fountain Inn’s charming Main Street, you’ll enjoy boutique shopping, local cafés and restaurants, and regular community gatherings. Situated for effortless daily living, the home is also near the vibrant shopping and dining corridor of neighboring Simpsonville, SC—so whether you’re grabbing dinner, browsing stores or catching a coffee, everything is within reach. Families will appreciate the proximity to the brand-new Fountain Inn High School (and the wider Greenville Coun
Key facts
- Fenced in back yard
- 6,534 sq ft lot
- 2 garage spots
Tags
Property features AI
Finance
- HOA & community: Homeowners association (amenities include common area electricity, pool, and street lights); Community amenities: common areas, lights, playground, pool
Exterior
- Parking: Attached 2-car garage with automatic door opener; Paved driveway
- Utilities: Public water; Public sewer; Gas tankless water heater; Electric service for cooling; Private garbage pickup
- Home design: Two-story residential home; Model: Devonshire; Built in 2022; Storage in attic and garage; Slab foundation; Builder: Great Southern Homes
- Construction: Vinyl siding exterior; Composition shingle roof; Slab foundation; Approximately 1-5 years old
- Exterior features: Patio; Partial in-ground sprinkler system; Fenced yard; Level lot with sidewalk; Vinyl siding; Composition shingle roof
Interior
- Kitchen: Cooktop (smooth); Built-in microwave; Dishwasher; Kitchen approximately 18 x 18
- Bedrooms: Primary bedroom with double sink, full bath, separate shower, garden tub, and walk-in closet; Secondary bedrooms sized approximately 11 x 14, 11 x 14, and 10 x 11; Master bedroom approximately 16 x 17
- Flooring: Carpet; Luxury vinyl tile/plank
- Bathrooms: 2 full bathrooms; 1 half bathroom
- Heating & cooling: Natural gas heating; Central forced air cooling (electric)
- Interior features: Attic stairs (disappearing); Cable available; Smooth ceilings; Granite countertops; Gas log fireplace (1)
- Laundry & utility: Laundry on 2nd floor with walk-in laundry area
Neighborhood map
What this means for you Summary
Snapshot
- This is a 4-bed/2.5-bath single-family listed at $345k.
Deal economics
- At list price, monthly cash flow is $-152 ($-2k/yr) — negative.
- To cash-flow at today's rent, offer at most $318k (7.8% below list).
- To meet the 1% rule (rent ≥ 1% of price), the offer needs to be $260k (24.6% below list).
- Recommended offer: $260k (24.6% below list) — sets the bar for 1% rule.
- Cap rate 5.8% vs local median 4.2% in Fountain Inn — top-decile yield for the area; either an underpriced asset or a hidden risk that comps aren't pricing in. Stress-test before assuming the spread holds.
Location & tenants
- Location reads 82/100 on livability (#4 in SC, #1,162 nationally) — a professional / high-income tenant draw. Strengths: crime A+, cost of living A+, housing A+; Watch: commute F.
- Greenville 01 (suburban): math 44% / reading 54% proficiency, ranked #10 of 80 in SC (top 12%) — families likely to look elsewhere, expect single-tenant / working-renter base with shorter leases.
- Zoned schools: Fountain Inn Elementary (math 48% / reading 47%, grade D, #199 of 597 statewide, top 35%, 835 students, 100% FRL) — zoned schools average 100% FRL vs 42% district-wide (58 pts higher); higher-poverty schools than district average — tighter screening recommended.
- Market conditions: Rents rising fast (+4.5%/yr); 482 active listings in the ZIP; 2 comparable units currently listed for rent nearby; 621 units permitted in Laurens County in 2024 (0 in 5+ unit buildings).
- This rent runs 44% of the median local income ($70k/yr) — at the standard rent-burdened threshold; future hikes will face affordability resistance.
Forward outlook
- Local home prices are declining (-3.0%/yr); year-one equity from $2k of loan paydown is wiped out by about $10k of value loss. Plan a longer hold.
- Laurens County population projected to shrink 7% by 2050 — rents likely to lag national; underwrite the cash flow, not the appreciation.
Negotiation context
- It's been on market 69 days — a 6% lower offer ($324k) is reasonable based on typical stale-listing flexibility.
- 6 sale attempts since 4y ago with the ask held roughly flat each time — persistent listings suggest the price (not the market) is what's stuck; bring a comps-based counter.
Questions for the listing agent
- What do current leases actually rent for vs. the listed asking? Can we see a recent rent roll and the last 12 months of T-12 income?
- It's been on market 69 days. Have you received any prior offers? Is the seller open to a 25% concession, seller financing, or rate buy-down credit?
- What does the HOA fee cover, when was the last increase, and are there any pending special assessments or reserve-fund shortfalls?
- Why hasn't it sold? Are there any deal-killer items the seller is aware of (foundation, flood, title, zoning, code violations)?
- Is there a deadline driving the sale (1031 exchange, divorce, estate, relocation)? That informs how much negotiation room exists.
- The area grade is low — what's the realistic commute time and amenity access for the typical tenant pool here? Any planned neighborhood developments (good or bad) we should know about?
- What's the average days-on-market for RENTAL listings here right now (not sales)? A rising rental-DOM trend means longer vacancies and softer asking-rent achievability than the comps imply.
- What's the recent tenant-quality profile in this submarket — average credit score on applications, eviction rate, late-payment / NSF rate, and stable-employment percentage? A property-management company in the area should have these aggregated.
- How much new for-sale + rental construction is in the pipeline within 1–3 miles? Heavy new supply typically softens prices + rents 12–24 months out; constrained supply supports both.
Investment metrics
- 1% rule
- 0.75% ✗
- Cap rate
- 5.76%
- Cash-on-cash
- -1.89%
- DSCR
- 0.92
- GRM
- 11.1
CMA / ARV
- ARV (on-the-fly)
- $339,795
- Comps found
- 12
Show comp detail 12 sales within ~0.75 mi
| Address | Dist | Beds/Ba | Sqft | Sold | Price | $/sf | Match |
|---|---|---|---|---|---|---|---|
| 145 Bruinen Dr | 0.08mi | 4/2.5 | 2,443 (-3%) | 2mo | $325,000 | $133 | 90 |
| 111 Bruinen Dr | 0.02mi | 5/3.0 (+1) | 2,280 (-9%) | 16mo | $345,000 | $151 | 63 |
| 14 Snowy Ct | 0.46mi | 5/3.0 (+1) | 2,292 (-9%) | 13mo | $350,000 | $153 | 46 |
| 530 Bonifay Dr | 0.69mi | 5/3.0 (+1) | 2,511 (-0%) | 21mo | $339,900 | $135 | 43 |
| 517 Bonifay Dr | 0.70mi | 5/3.0 (+1) | 2,511 (-0%) | 24mo | $338,900 | $135 | 40 |
| 145 Boxbury Way | 0.61mi | 5/3.0 (+1) | 2,368 (-6%) | 20mo | $324,900 | $137 | 38 |
| 100 Mitford Way | 0.59mi | 5/3.0 (+1) | 2,346 (-7%) | 24mo | $352,000 | $150 | 34 |
| 234 Boxbury Way | 0.65mi | 5/3.0 (+1) | 2,368 (-6%) | 24mo | $318,500 | $135 | 33 |
| 234 Boxbury Way | 0.70mi | 5/3.0 (+1) | 2,368 (-6%) | 24mo | $318,500 | $135 | 30 |
| 251 Boxbury Way | 0.61mi | 4/2.5 | 2,174 (-14%) | 23mo | $316,900 | $146 | 30 |
| 521 Bonifay Dr | 0.71mi | 4/2.5 | 2,824 (+12%) | 23mo | $350,900 | $124 | 27 |
| 518 Bonifay Dr | 0.73mi | 4/2.5 | 2,824 (+12%) | 24mo | $349,900 | $124 | 26 |
Match score weights: distance 35% · size 25% · config 20% · recency 20%. Top-matched comps best support the ARV.
Projected returns pro-forma
-3.0% appreciation · 4.55% rent growth · sell at horizon
- IRR
- -17.9%
- Equity multiple
- 0.36×
- Total profit
- $-61,533
- Equity at exit
- $51,441
- IRR
- -7.5%
- Equity multiple
- 0.49×
- Total profit
- $-48,889
- Equity at exit
- $29,829
Cash invested: $96,600 (down + closing). Projections, not guarantees.
Landlord ↔ Tenant lean methodology
- Overall (STATE)
- 90 Strongly Landlord-Friendly
- State South Carolina
- 90 Strongly Landlord-Friendly · R+6
- County
- — inherits STATE
- City
- — inherits STATE
ZIP-level market 29644
- Home prices YoY
- -28.6%
- Rents YoY
- 4.5%
- Active inventory
- 482
- Price-to-rent
- 11.1×
Monthly cashflow live
- Estimated rent
- $2,600 medium interval (Pro) →
- Mortgage (P&I)
- −$1,809
- Tax from tax record
- −$215 /mo · $2,578/yr
- Insurance
- −$144
- HOA
- −$38
- Vacancy / Maint / Mgmt
- −$546
- Net cashflow
- $-152
Break-even live
UW: 25.0% down · 7.5% · 30yr · 1.5% tax · 5.0% vac · 8.0% maint · 8.0% mgmt
Financing live
Cash to close
- Down payment
- $86,250
- Closing costs
- $10,350
- Reserves months
- —
- Total cash needed
- —
Loan-product check · same deal, 3 products live
Conventional
25% down · 7.5% · 30yr
- Down + closing
- —
- Monthly P&I
- —
- Monthly cashflow
- —
- DSCR
- —
- Eligible?
- —
Personal DTI + credit; lowest rate.
DSCR
20% down · 8.5% · 30yr
- Down + closing
- —
- Monthly P&I
- —
- Monthly cashflow
- —
- DSCR
- —
- Eligible?
- —
No personal income docs; deal must DSCR.
Hard money
10% down · 12.0% · 12mo
- Down + closing
- —
- Monthly P&I
- —
- Monthly cashflow
- —
- DSCR
- —
- Eligible?
- —
Short-term bridge; refi at stabilization.
Rent comps 2 comps
| Address | Beds | Baths | Sqft | Rent | $/sqft | DOM | Units | Dist |
|---|---|---|---|---|---|---|---|---|
| 370 Alyssa Lndg Dr Fountain Inn, SC | 5.0 | 3.0 | 2300 | $2,449 | $1.06 | 19d | 1 | 1.02mi |
| 40 Fernhill Ln Fountain Inn, SC | 3.0 | 3.0 | 1983 | $1,900 | $0.96 | 3d | 1 | 1.40mi |
HOA detail
- Monthly dues
- $38 · $456/yr
Listing history 39 events
-
2026-06-18days on market $345,000 Active 69 DOM
-
2026-06-17days on market $345,000 Active 68 DOM
-
2026-06-16days on market $345,000 Active 67 DOM
-
2026-06-15days on market $345,000 Active 66 DOM
-
2026-06-13days on market $345,000 Active 64 DOM
-
2026-06-13days on market $345,000 Active 63 DOM
-
2026-06-10days on market $345,000 Active 61 DOM
-
2026-06-09days on market $345,000 Active 60 DOM
-
2026-06-08days on market $345,000 Active 59 DOM
-
2026-06-07days on market $345,000 Active 58 DOM
-
2026-06-01days on market $345,000 Active 54 DOM
-
2026-05-31days on market $345,000 Active 53 DOM
-
2026-05-20price $345,000
-
2026-05-07price $358,000
-
2026-04-08$360,000 Active
-
2026-04-08historical
-
2026-03-18price $360,000
-
2026-03-04price $365,000
-
2025-12-02price $370,000
-
2025-11-14$375,000 Active
-
2025-11-13historical
-
2025-10-07price $375,000
-
2025-09-24price $380,000
-
2025-09-22status Active
-
2025-09-19historical
-
2025-09-09price $384,000
-
2025-08-21$385,000 Active
-
2022-07-15soldstatus $384,137 Sold In-House
-
2022-07-15soldstatus $384,137 Sold
-
2022-05-05status Pending
-
2022-05-05status Pending
-
2022-04-29price $384,226
-
2022-04-29price $384,226
-
2022-03-26price $376,226
-
2022-03-26price $376,226
-
2022-03-23price $366,226
-
2022-03-23price $366,226
-
2022-03-14$356,226 Active
-
2022-03-14$356,226 Active
ⓘ Source: listings_history table (triggers on properties + properties_extension) + one-shot
backfill from property_details.listing_events for pre-trigger history.
Tax reassessment forecast SC · Resets to sale price
- Current annual tax
- $2,578 · $215/mo
- Projected year-2 tax
- $2,578 · $215/mo
- Expected delta
- $0/yr ($0/mo · 0.0%)
ⓘ Screening estimate from a state-policy table — verify with the county assessor before closing.
Nearby sold comps map
Loading sold comps map…
Walkable amenities ~0.75 mi
Loading nearby amenities…
Taxation est. · year 1
- Rental income
- $31,198
- − Mortgage interest
- −$19,325
- − Property taxes
- −$2,578
- − Insurance
- −$1,725
- − Repairs & maintenance
- −$2,496
- − Management
- −$2,496
- − HOA
- −$456
- − Depreciation
- −$10,036
- Taxable loss
- −$7,914
- Est. tax savings @ 24.0%
- +$1,899
- After-tax cash flow
- $76/yr
For passive investors: Depreciation is non-cash, so a rental often shows a tax loss while cash-flowing — sheltering income. Rental losses are passive: they offset passive income freely, and up to $25,000/yr can offset ordinary (W-2) income if you actively participate and your MAGI is under $100k (phasing out to $0 by $150k); unused losses carry forward. On sale, claimed depreciation is recaptured at up to 25%, and gains may owe capital-gains tax (a 1031 exchange can defer both). Figures are a year-1 estimate at your 24.0% rate — not tax advice; consult a CPA.
Schools (NCES district)
- District
- Greenville 01
- NCES district ID
- 4502310
- Math proficiency
- 44% ▼ -10.00%
- Reading proficiency
- 54% ▼ -2.00%
- Median HH income
- $49,596
- Composite
- 41.88/100
- National rank
- #3370
- State rank
- #10 of 80 in SC
Livability — Fountain Inn
- Score
- 82/100
- State rank
- #4
- US rank
- #1162
Category grades
Schools grade is shown separately in the Schools card above.
Census & demographics
- Census place
- Fountain Inn, SC
- County
- Greenville County · 573,815 people
- City population
- 22,907
- Metro
- Greenville-Anderson, SC
- Population (ZIP)
- 22,907
- Household income
- $70,301
- Rent vs Own
- Severe rent burden
- 475.0
Population outlook (Laurens County) Hauer SSP2
- Today (2025)
- 66,741 people
- By 2030
- 66,454 · -0.4%
- By 2040
- 64,881 · -2.8%
- By 2050
- 61,941 · -7.2%
- By 2075
- 53,266 · -20.2%
- By 2100
- 41,495 · -37.8%
Race, ethnicity, and origin ACS 2023
- Neighborhood character
- Predominantly White (66%)
- Race & ethnicity
- White 66% Black 18% Two or more races 10% Hispanic / Latino 10%
- Hispanic origin (detail)
- Mexican 3% Puerto Rican 2%
- Common ancestry
- Slovak 3% Romanian 2% Lithuanian 2%
- Foreign-born
- 6% · Canada, Jamaica
- Languages at home
- 89% English-only · Spanish 9% Tagalog/Filipino 1%
Political lean MEDSL · Laurens
- 2024 margin
- Solid R (+40.9) · D 29.0% · R 69.9% · Other 1.1%
- 2008→2024 swing
- -22.8pp toward R · 2008: -18.1pp · 2024: -40.9pp
- All cycles
- 2024: R+40.9 2020: R+32.3 2016: R+29.9 2012: R+17.5 2008: R+18.1
Not yet ingested
- Civics
- —
Market trends
- HPI YoY
- ▼ -100.45%
- Current HPI
- 250.5271
- Rent YoY
- ▲ 4.55%
- Metro
- Greenville-Anderson, SC
- State GDP YoY
- ▲ 4.51%
- F500 in state
- 2
Industry mix (Fortune 500 HQ in SC)
| Industry | F500 HQs | Revenue |
|---|---|---|
| Packaging | 1 | $7B |
|
||
Price history
-3.2% since first listed27 events — show timeline
- 2026-05-20 Price Changed $345,000 Greater Greenville MLS
- 2026-05-07 Price Changed $358,000 Greater Greenville MLS
- 2026-04-08 Listing Removed — Greater Greenville MLS
- 2026-04-08 Listed $360,000 Greater Greenville MLS
- 2026-03-18 Price Changed $360,000 Greater Greenville MLS
- 2026-03-04 Price Changed $365,000 Greater Greenville MLS
- 2025-12-02 Price Changed $370,000 Greater Greenville MLS
- 2025-11-14 Listed $375,000 Greater Greenville MLS
- 2025-11-13 Listing Removed — Greater Greenville MLS
- 2025-10-07 Price Changed $375,000 Greater Greenville MLS
- 2025-09-24 Price Changed $380,000 Greater Greenville MLS
- 2025-09-22 Relisted — Greater Greenville MLS
- 2025-09-19 Listing Removed — Greater Greenville MLS
- 2025-09-09 Price Changed $384,000 Greater Greenville MLS
- 2025-08-21 Listed $385,000 Greater Greenville MLS
- 2022-07-15 Sold (MLS) $384,137 Greater Greenville MLS
- 2022-07-15 Sold (MLS) $384,137 SPMLS
- 2022-05-05 Pending — SPMLS
- 2022-05-05 Pending — Greater Greenville MLS
- 2022-04-29 Price Changed $384,226 SPMLS
- 2022-04-29 Price Changed $384,226 Greater Greenville MLS
- 2022-03-26 Price Changed $376,226 SPMLS
- 2022-03-26 Price Changed $376,226 Greater Greenville MLS
- 2022-03-23 Price Changed $366,226 Greater Greenville MLS
- 2022-03-23 Price Changed $366,226 SPMLS
- 2022-03-14 Listed $356,226 Greater Greenville MLS
- 2022-03-14 Listed $356,226 SPMLS
Property tax history
+52.5%/yrLatest (2025): $2,578 · +4.5% YoY. Source: county tax records.
Cash-flow waterfall
monthlySold comps — $/sqft
last 12 mo · ≤1 miLoading sold comps…