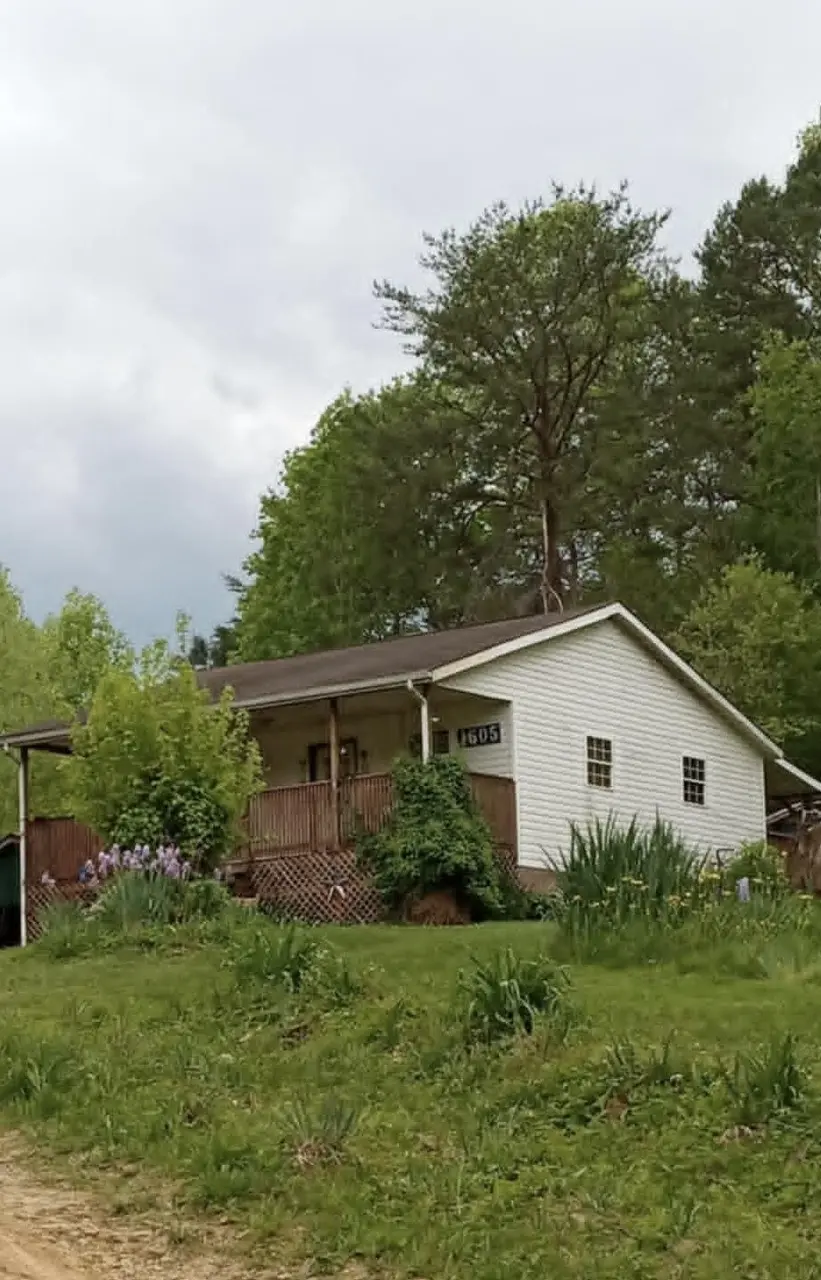
1605 Tiny Branch Rd · Jellico, TN
Flood risk 1/10 · Minimal
- FEMA flood zone
- X (unshaded)
- Chance of flooding over 30 yrs
- 0.0%
- Est. flood insurance / yr
- $473 – $860
Fire risk 8/10 · Major
- Est. fire insurance / yr
- $839 – $1,559
Heat risk 4/10 · Minor
- Hot days now (above 99°F)
- 7 days/yr
- Hot days in 30 yrs
- 19 days/yr
Wind risk 2/10 · Minimal
- Chance of severe wind over 30 yrs
- 3.0%
Air-quality risk 3/10 · Minor
- Unhealthy air days now
- 2 days/yr
- Unhealthy air days in 30 yrs
- 3 days/yr
Risk factors via First Street. Map © Google.
Why this score? — see what drove the D grade
The composite is a weighted blend of 9 inputs, each scored 0–100. Each bar is that input's sub-score; the figure is the points it added to the 100-point composite (weight × sub-score).
- Cash flow +14.2/30.0
- ARV discount +7.5/15.0
- Appreciation +5.0/10.0
- DSCR +4.3/10.0
- 1% rule +3.0/10.0
- Schools +2.8/10.0
- Livability +2.8/5.0
- Rent growth +2.5/5.0
- Condition / age +2.5/5.0
$105,000
🖨 Deal sheet 📄 Offer letter ✓ Due diligence
Listing remarks
Cute cottage style home with privacy in a rural setting, well water (county water is available at the driveway). Septic system, home was built in 2001 and sits on an acre lot per seller. This home would make a great get-a-way spot or full time residence. The home/property is in Whitley county Ky but the property is serviced by the Bell County Ky school system. The local elementary is Frakes which is about 4 miles away. Close to the TN/KY state line, local convenient stores and a Dollar General.
Key facts
- Half an acre lot
- Rural setting
- Well water
Tags
Property features AI
Finance
- Other: Parcel number 221-00-00-030.00
Exterior
- Utilities: Well water; Septic tank; Water service available
- Home design: Single-family dwelling (rural setting)
- Construction: Vinyl siding exterior; Block foundation; Shingle roof; Built area approximately 820
- Exterior features: Few trees; Rural, trees/woods and mountain views
Interior
- Kitchen: Refrigerator; Range
- Bedrooms: 2 rooms (bedroom count reflected in total rooms)
- Flooring: Laminate flooring; Vinyl flooring
- Bathrooms: 1 full bathroom
- Heating & cooling: Electric heating; Heat pump; Central air; Ceiling fans
- Interior features: Eat-in kitchen; No fireplace; 2 total rooms
- Laundry & utility: Washer hookup; Electric dryer hookup
Neighborhood map
What this means for you Summary
Snapshot
- This is a 2-bed/1.0-bath single-family listed at $105k.
Deal economics
- At list price, monthly cash flow is $18 ($214/yr) — positive.
- The deal already cash-flows at list — no discount required.
- To meet the 1% rule (rent ≥ 1% of price), the offer needs to be $84k (20.3% below list).
- Recommended offer: $84k (20.3% below list) — sets the bar for 1% rule.
- Cap rate 6.5% vs local median 4.3% in Jellico — top-decile yield for the area; either an underpriced asset or a hidden risk that comps aren't pricing in. Stress-test before assuming the spread holds.
Location & tenants
- Location reads 55/100 on livability (#352 in TN) — a working-class tenant base; expect higher turnover. Strengths: cost of living A+, housing A-; Watch: amenities F, commute F, employment F.
- Whitley County (rural): math 26% / reading 43% proficiency, ranked #80 of 165 in KY (top 48%) — families likely to look elsewhere, expect single-tenant / working-renter base with shorter leases; 70% free/reduced lunch — lower-income household profile, screen leases tightly.
- Zoned schools: Boston Elementary School (math 22% / reading 37%, grade F, #393 of 676 statewide, top 63%, 191 students, 86% FRL); Whitley County Middle School (math 31% / reading 50%, grade F, #57 of 217 statewide, top 26%, 563 students, 80% FRL); Whitley County High School (math 22% / reading 37%, grade F, #127 of 254 statewide, top 58%, 980 students, 73% FRL).
- Market conditions: 65 units permitted in Whitley County in 2024 (0 in 5+ unit buildings).
Forward outlook
- In year one you build about $4k of equity ($726 loan paydown + $3k appreciation (3.0% local appreciation)).
- Whitley County population projected to shrink 8% by 2050 — rents likely to lag national; underwrite the cash flow, not the appreciation.
- At projected returns (3.0% appreciation + 3.0% rent growth), your $29k cash investment doubles in ~6 years — after that, you're playing with house money.
- By year 9, paydown + projected appreciation supports a ~$33k cash-out refi (75% LTV) — recoverable capital for the next deal without selling this one.
Negotiation context
- It's been on market 29 days — a 2% lower offer ($103k) is reasonable based on typical stale-listing flexibility.
Risks & watch-outs
- Climate carrying-cost: severe wildfire risk — expect insurance premiums to compound above CPI over the hold.
Questions for the listing agent
- Is there a deadline driving the sale (1031 exchange, divorce, estate, relocation)? That informs how much negotiation room exists.
- Schools are F-rated, which usually means shorter tenancies and higher turnover. Who's the typical renter profile here, and what's been the actual vacancy rate?
- The area grade is low — what's the realistic commute time and amenity access for the typical tenant pool here? Any planned neighborhood developments (good or bad) we should know about?
- What's the average days-on-market for RENTAL listings here right now (not sales)? A rising rental-DOM trend means longer vacancies and softer asking-rent achievability than the comps imply.
- What's the recent tenant-quality profile in this submarket — average credit score on applications, eviction rate, late-payment / NSF rate, and stable-employment percentage? A property-management company in the area should have these aggregated.
- How much new for-sale + rental construction is in the pipeline within 1–3 miles? Heavy new supply typically softens prices + rents 12–24 months out; constrained supply supports both.
Investment metrics
- 1% rule
- 0.80% ✗
- Cap rate
- 6.50%
- Cash-on-cash
- 0.73%
- DSCR
- 1.03
- GRM
- 10.5
CMA / ARV
No comps found within radius.
Projected returns pro-forma
3.0% appreciation · 3.0% rent growth · sell at horizon
- IRR
- 8.2%
- Equity multiple
- 1.47×
- Total profit
- $13,745
- Equity at exit
- $47,213
- IRR
- 10.7%
- Equity multiple
- 2.61×
- Total profit
- $47,305
- Equity at exit
- $72,760
Cash invested: $29,400 (down + closing). Projections, not guarantees.
Monthly cashflow live
- Estimated rent
- $836 medium interval (Pro) →
- Mortgage (P&I)
- −$551
- Tax from tax record
- −$49 /mo · $582/yr
- Insurance
- −$44
- HOA
- −$0
- Vacancy / Maint / Mgmt
- −$176
- Net cashflow
- $18
Break-even live
UW: 25.0% down · 7.5% · 30yr · 1.5% tax · 5.0% vac · 8.0% maint · 8.0% mgmt
Financing live
Cash to close
- Down payment
- $26,250
- Closing costs
- $3,150
- Reserves months
- —
- Total cash needed
- —
Loan-product check · same deal, 3 products live
Conventional
25% down · 7.5% · 30yr
- Down + closing
- —
- Monthly P&I
- —
- Monthly cashflow
- —
- DSCR
- —
- Eligible?
- —
Personal DTI + credit; lowest rate.
DSCR
20% down · 8.5% · 30yr
- Down + closing
- —
- Monthly P&I
- —
- Monthly cashflow
- —
- DSCR
- —
- Eligible?
- —
No personal income docs; deal must DSCR.
Hard money
10% down · 12.0% · 12mo
- Down + closing
- —
- Monthly P&I
- —
- Monthly cashflow
- —
- DSCR
- —
- Eligible?
- —
Short-term bridge; refi at stabilization.
Listing history 18 events
-
2026-06-18days on market $105,000 Active 29 DOM
-
2026-06-17days on market $105,000 Active 28 DOM
-
2026-06-16days on market $105,000 Active 27 DOM
-
2026-06-15days on market $105,000 Active 26 DOM
-
2026-06-13days on market $105,000 Active 24 DOM
-
2026-06-12days on market $105,000 Active 23 DOM
-
2026-06-09days on market $105,000 Active 20 DOM
-
2026-06-08days on market $105,000 Active 19 DOM
-
2026-06-07days on market $105,000 Active 18 DOM
-
2026-06-07days on market $105,000 Active 17 DOM
-
2026-06-04days on market $105,000 Active 14 DOM
-
2026-06-02days on market $105,000 Active 13 DOM
-
2026-06-01days on market $105,000 Active 12 DOM
-
2026-05-31days on market $105,000 Active 11 DOM
-
2026-05-31days on market $105,000 Active 10 DOM
-
2026-05-20$105,000 Active
-
2018-09-12soldstatus $165,000
-
2008-07-23soldstatus $28,000
ⓘ Source: listings_history table (triggers on properties + properties_extension) + one-shot
backfill from property_details.listing_events for pre-trigger history.
Tax reassessment forecast TN · Resets to sale price
- Current annual tax
- $582 · $49/mo
- Projected year-2 tax
- $746 · $62/mo
- Expected delta
- +$163/yr (+$14/mo · 28.0%)
ⓘ Screening estimate from a state-policy table — verify with the county assessor before closing.
Climate risk First Street
- Flood 1/10 Low FEMA zone X (unshaded) · 0% chance over 30 yrs
- Wildfire 8/10 Severe
- Heat 4/10 Moderate 7 d/yr ≥99°F today · 19 d/yr by 30 yrs out
- Wind 2/10 Low 3% chance of damaging wind over 30 yrs
- Air quality 3/10 Moderate 2 unhealthy d/yr today · 3 by 30 yrs out
Nearby sold comps map
Loading sold comps map…
Walkable amenities ~0.75 mi
Loading nearby amenities…
Taxation est. · year 1
- Rental income
- $10,036
- − Mortgage interest
- −$5,882
- − Property taxes
- −$582
- − Insurance
- −$525
- − Repairs & maintenance
- −$803
- − Management
- −$803
- − Depreciation
- −$3,055
- Taxable loss
- −$1,613
- Est. tax savings @ 24.0%
- +$387
- After-tax cash flow
- $601/yr
For passive investors: Depreciation is non-cash, so a rental often shows a tax loss while cash-flowing — sheltering income. Rental losses are passive: they offset passive income freely, and up to $25,000/yr can offset ordinary (W-2) income if you actively participate and your MAGI is under $100k (phasing out to $0 by $150k); unused losses carry forward. On sale, claimed depreciation is recaptured at up to 25%, and gains may owe capital-gains tax (a 1031 exchange can defer both). Figures are a year-1 estimate at your 24.0% rate — not tax advice; consult a CPA.
Schools (NCES district)
- District
- Whitley County
- NCES district ID
- 2105880
- Math proficiency
- 26% ▼ -32.00%
- Reading proficiency
- 43% ▼ -25.00%
- Median HH income
- $29,079
- Composite
- 27.87/100
- National rank
- #6874
- State rank
- #80 of 165 in KY
Livability — Jellico
- Score
- 55/100
- State rank
- #352
- US rank
- #23161
Category grades
Schools grade is shown separately in the Schools card above.
Census & demographics
- City population
- 2,528
- Population (ZIP)
- 388
Population outlook (Whitley County) Hauer SSP2
- Today (2025)
- 35,362 people
- By 2030
- 34,807 · -1.6%
- By 2040
- 33,525 · -5.2%
- By 2050
- 32,550 · -8.0%
- By 2075
- 29,555 · -16.4%
- By 2100
- 24,308 · -31.3%
Race, ethnicity, and origin ACS 2023
- Neighborhood character
- Predominantly White (91%)
- Race & ethnicity
- White 91% Two or more races 9%
- Common ancestry
- Slovak 1%
Political lean MEDSL · Whitley
- 2024 margin
- Solid R (+69.3) · D 14.8% · R 84.2% · Other 1.0%
- 2008→2024 swing
- -21.7pp toward R · 2008: -47.7pp · 2024: -69.3pp
- All cycles
- 2024: R+69.3 2020: R+65.2 2016: R+67.2 2012: R+57.8 2008: R+47.7
Not yet ingested
- Civics
- —
Market trends
- HPI YoY
- —
- Current HPI
- —
- Rent YoY
- —
- Metro
- —
- State GDP YoY
- ▲ 2.78%
- F500 in state
- 22
Industry mix (Fortune 500 HQ in TN)
| Industry | F500 HQs | Revenue |
|---|---|---|
| Healthcare | 3 | $91B |
|
||
| Retail | 3 | $72B |
|
||
| Transportation / Logistics | 1 | $88B |
|
||
| Paper / Packaging | 1 | $19B |
|
||
| Insurance | 1 | $13B |
|
||
| Energy | 1 | $12B |
|
||
Price history
+275.0% since first listed3 events — show timeline
- 2026-05-20 Listed $105,000 ImagineMLS
- 2018-09-12 Sold (Public Records) $165,000 Public Records
- 2008-07-23 Sold (Public Records) $28,000 Public Records
Property tax history
+8.9%/yrLatest (2024): $582 · -3.4% YoY. Source: county tax records.
Cash-flow waterfall
monthlySold comps — $/sqft
last 12 mo · ≤1 miLoading sold comps…