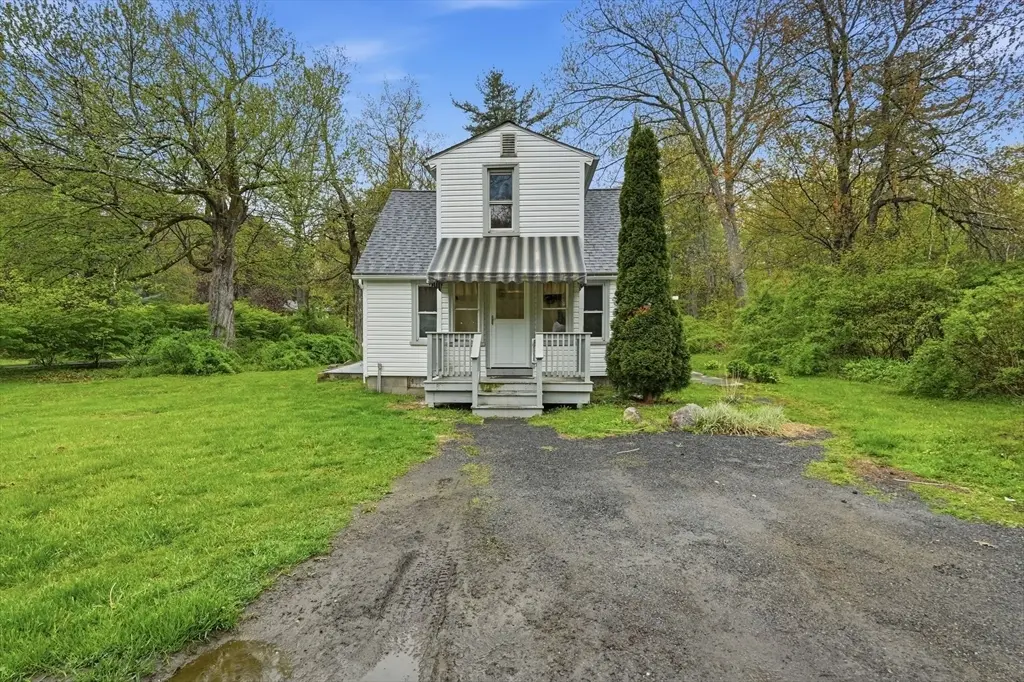
8 Shutesbury Rd · Pelham, MA
Flood risk 1/10 · Minimal
- FEMA flood zone
- X
- Chance of flooding over 30 yrs
- 0.0%
- Est. flood insurance / yr
- $473 – $860
Fire risk 3/10 · Minor
- Est. fire insurance / yr
- $915 – $1,699
Heat risk 2/10 · Minimal
- Hot days now (above 93°F)
- 7 days/yr
- Hot days in 30 yrs
- 16 days/yr
Wind risk 4/10 · Minor
- Chance of severe wind over 30 yrs
- 16.0%
Air-quality risk 2/10 · Minimal
- Unhealthy air days now
- 1 days/yr
- Unhealthy air days in 30 yrs
- 3 days/yr
Risk factors via First Street. Map © Google.
Why this score? — see what drove the D+ grade
The composite is a weighted blend of 9 inputs, each scored 0–100. Each bar is that input's sub-score; the figure is the points it added to the 100-point composite (weight × sub-score).
- Cash flow +15.0/30.0
- ARV discount +7.5/15.0
- Schools +6.2/10.0
- Rent growth +4.8/5.0
- DSCR +4.6/10.0
- 1% rule +3.9/10.0
- Livability +2.5/5.0
- Condition / age +2.5/5.0
- Appreciation +0.0/10.0
$280,000
🖨 Deal sheet 📄 Offer letter ✓ Due diligence
Listing remarks MLS
Pelham—3 Bedroom, 1 Bath newly renovated Cape on quiet road 7 miles from Amherst Center. Light and airy, this charming home boasts a brand new kitchen, new bathroom with whirlpool tub, and new flooring throughout. Also featured are an enclosed sun-room with sliders to back yard, and a freshly painted interior. Newer washer and dryer on first floor. Convenient for commuting, easy route to Rt. 2 and 202, yet in the Amherst/Pelham school system. Wood, pellet or gas stove to be added. New septic.
Key facts
- Spacious kitchen
- Open study
- Bright living room
Tags
Property features AI
Finance
- HOA & community: Not a senior community
Exterior
- Parking: Off-street open parking (5 spaces); Unpaved parking area
- Utilities: Private water; Private sewer (inspection required for sale); Public road frontage on a paved, public-maintained road
- Home design: Single family residence; Approximate year built (public records); White exterior
- Construction: Frame construction; Block foundation; Shingle roof
- Exterior features: Level lot; Porch - enclosed; Patio - enclosed; Storage
Interior
- Kitchen: Range; Refrigerator
- Bedrooms: Master bedroom on the second floor; Second bedroom on the second floor
- Flooring: Vinyl; Carpet
- Bathrooms: One full bathroom (primary bathroom on the first floor)
- Heating & cooling: Electric baseboard heating
- Interior features: Six total rooms; Crawl space basement with bulkhead and concrete foundation; Basement has a sump pump; Unfinished basement; Enclosed porch and enclosed patio; Storage
- Laundry & utility: Laundry on the first floor; Electric water heater
Neighborhood map
What this means for you Summary
Snapshot
- This is a 2-bed/1.5-bath single-family listed at $280k.
Deal economics
- At list price, monthly cash flow is $85 ($1k/yr) — positive.
- The deal already cash-flows at list — no discount required.
- To meet the 1% rule (rent ≥ 1% of price), the offer needs to be $250k (10.6% below list).
- Recommended offer: $250k (10.6% below list) — sets the bar for 1% rule.
Location & tenants
- Location reads: area grade D — affects rentability + tenant quality, not the cash-flow math above.
- Pelham (suburban): math 65% / reading 70% proficiency, ranked #75 of 371 in MA (top 20%) — acceptable for families but not a draw, mixed tenant base, ~2y average lease; only 12% free/reduced lunch — higher-income household profile.
- Market conditions: Rents rising fast (+9.3%/yr); 53 active listings in the ZIP; 349 units permitted in Hampshire County in 2024 (185 in 5+ unit buildings).
- This rent runs 42% of the median local income ($71k/yr) — at the standard rent-burdened threshold; future hikes will face affordability resistance.
Forward outlook
- Local home prices are declining (-3.0%/yr); year-one equity from $2k of loan paydown is wiped out by about $8k of value loss. Plan a longer hold.
- Hampshire County population projected at +5% by 2050 — modest demand growth; plan on rents tracking national, not racing it.
Negotiation context
- It's been on market 30 days — a 2% lower offer ($276k) is reasonable based on typical stale-listing flexibility.
- 4 sale attempts since 25y ago with the ask held roughly flat each time — persistent listings suggest the price (not the market) is what's stuck; bring a comps-based counter.
- Current owner paid $154k; list at $280k implies a 81% gain — meaningful room to come down on a strong offer.
Risks & watch-outs
- Watch-outs: built in 1910 — expect roof / HVAC / electrical / plumbing capex.
Questions for the listing agent
- Built in 1910 — when were the roof, HVAC, electrical panel, plumbing, and water heater last replaced?
- Is there a deadline driving the sale (1031 exchange, divorce, estate, relocation)? That informs how much negotiation room exists.
- The area grade is low — what's the realistic commute time and amenity access for the typical tenant pool here? Any planned neighborhood developments (good or bad) we should know about?
- What's the average days-on-market for RENTAL listings here right now (not sales)? A rising rental-DOM trend means longer vacancies and softer asking-rent achievability than the comps imply.
- What's the recent tenant-quality profile in this submarket — average credit score on applications, eviction rate, late-payment / NSF rate, and stable-employment percentage? A property-management company in the area should have these aggregated.
- How much new for-sale + rental construction is in the pipeline within 1–3 miles? Heavy new supply typically softens prices + rents 12–24 months out; constrained supply supports both.
Investment metrics
- 1% rule
- 0.89% ✗
- Cap rate
- 6.66%
- Cash-on-cash
- 1.30%
- DSCR
- 1.06
- GRM
- 9.3
CMA / ARV
No comps found within radius.
Projected returns pro-forma
-3.0% appreciation · 8.0% rent growth · sell at horizon
- IRR
- -8.9%
- Equity multiple
- 0.66×
- Total profit
- $-26,710
- Equity at exit
- $41,749
- IRR
- 6.2%
- Equity multiple
- 1.56×
- Total profit
- $43,970
- Equity at exit
- $24,209
Cash invested: $78,400 (down + closing). Projections, not guarantees.
Landlord ↔ Tenant lean methodology
- Overall (STATE)
- 20 Strongly Tenant-Friendly
- State Massachusetts
- 20 Strongly Tenant-Friendly · D+15
- County
- — inherits STATE
- City
- — inherits STATE
ZIP-level market 01002
- Rents YoY
- 9.3%
- Active inventory
- 53
- Price-to-rent
- 9.3×
Monthly cashflow live
- Estimated rent
- $2,503 medium interval (Pro) →
- Mortgage (P&I)
- −$1,468
- Tax from tax record
- −$307 /mo · $3,683/yr
- Insurance
- −$117
- HOA
- −$0
- Vacancy / Maint / Mgmt
- −$526
- Net cashflow
- $85
Break-even live
UW: 25.0% down · 7.5% · 30yr · 1.5% tax · 5.0% vac · 8.0% maint · 8.0% mgmt
Financing live
Cash to close
- Down payment
- $70,000
- Closing costs
- $8,400
- Reserves months
- —
- Total cash needed
- —
Loan-product check · same deal, 3 products live
Conventional
25% down · 7.5% · 30yr
- Down + closing
- —
- Monthly P&I
- —
- Monthly cashflow
- —
- DSCR
- —
- Eligible?
- —
Personal DTI + credit; lowest rate.
DSCR
20% down · 8.5% · 30yr
- Down + closing
- —
- Monthly P&I
- —
- Monthly cashflow
- —
- DSCR
- —
- Eligible?
- —
No personal income docs; deal must DSCR.
Hard money
10% down · 12.0% · 12mo
- Down + closing
- —
- Monthly P&I
- —
- Monthly cashflow
- —
- DSCR
- —
- Eligible?
- —
Short-term bridge; refi at stabilization.
Listing history 24 events
-
2026-06-18days on market $280,000 Active 30 DOM
-
2026-06-17days on market $280,000 Active 29 DOM
-
2026-06-16days on market $280,000 Active 28 DOM
-
2026-06-15days on market $280,000 Active 27 DOM
-
2026-06-14days on market $280,000 Active 25 DOM
-
2026-06-13days on market $280,000 Active 24 DOM
-
2026-06-10days on market $280,000 Active 22 DOM
-
2026-06-09days on market $280,000 Active 21 DOM
-
2026-06-08days on market $280,000 Active 20 DOM
-
2026-06-07days on market $280,000 Active 19 DOM
-
2026-06-05days on market $280,000 Active 16 DOM
-
2026-06-03days on market $280,000 Active 15 DOM
-
2026-06-02days on market $280,000 Active 14 DOM
-
2026-06-01days on market $280,000 Active 13 DOM
-
2026-05-31days on market $280,000 Active 12 DOM
-
2026-05-30days on market $280,000 Active 11 DOM
-
2026-05-19$280,000 New
-
2013-02-14soldstatus $154,500 503-char remark
Show marketing remark (503 chars)
Pelham—3 Bedroom, 1 Bath newly renovated Cape on quiet road 7 miles from Amherst Center. Light and airy, this charming home boasts a brand new kitchen, new bathroom with whirlpool tub, and new flooring throughout. Also featured are an enclosed sun-room with sliders to back yard, and a freshly painted interior. Newer washer and dryer on first floor. Convenient for commuting, easy route to Rt. 2 and 202, yet in the Amherst/Pelham school system. Wood, pellet or gas stove to be added. New septic.
-
2012-09-17$159,900 503-char remark
Show marketing remark (503 chars)
Pelham—3 Bedroom, 1 Bath newly renovated Cape on quiet road 7 miles from Amherst Center. Light and airy, this charming home boasts a brand new kitchen, new bathroom with whirlpool tub, and new flooring throughout. Also featured are an enclosed sun-room with sliders to back yard, and a freshly painted interior. Newer washer and dryer on first floor. Convenient for commuting, easy route to Rt. 2 and 202, yet in the Amherst/Pelham school system. Wood, pellet or gas stove to be added. New septic.
-
2012-07-27soldstatus $14,000 309-char remark
Show marketing remark (309 chars)
Three bedroom in Pelham, needs work, but good opportunity. Sold 'As-is'. Failed Title 5, Seller offering 3% seller paid points towards a permanent interest rate buy down with Prospect Mortgage. Buyer must be pre-approved or have proof of funds prior to submission of the offer to purchase (purchase contract).
-
2010-09-01$39,900 309-char remark
Show marketing remark (309 chars)
Three bedroom in Pelham, needs work, but good opportunity. Sold 'As-is'. Failed Title 5, Seller offering 3% seller paid points towards a permanent interest rate buy down with Prospect Mortgage. Buyer must be pre-approved or have proof of funds prior to submission of the offer to purchase (purchase contract).
-
2001-07-02soldstatus $97,900
-
2001-06-28soldstatus $97,900
-
2001-02-09$94,900
ⓘ Source: listings_history table (triggers on properties + properties_extension) + one-shot
backfill from property_details.listing_events for pre-trigger history.
Tax reassessment forecast MA · Partial reset (capped growth)
- Current annual tax
- $3,683 · $307/mo
- Projected year-2 tax
- $3,683 · $307/mo
- Expected delta
- $0/yr ($0/mo · 0.0%)
ⓘ Screening estimate from a state-policy table — verify with the county assessor before closing.
Climate risk First Street
- Flood 1/10 Low FEMA zone X · 0% chance over 30 yrs
- Wildfire 3/10 Moderate
- Heat 2/10 Low 7 d/yr ≥93°F today · 16 d/yr by 30 yrs out
- Wind 4/10 Moderate 16% chance of damaging wind over 30 yrs
- Air quality 2/10 Low 1 unhealthy d/yr today · 3 by 30 yrs out
Nearby sold comps map
Loading sold comps map…
Walkable amenities ~0.75 mi
Loading nearby amenities…
Taxation est. · year 1
- Rental income
- $30,032
- − Mortgage interest
- −$15,684
- − Property taxes
- −$3,683
- − Insurance
- −$1,400
- − Repairs & maintenance
- −$2,403
- − Management
- −$2,403
- − Depreciation
- −$8,145
- Taxable loss
- −$3,686
- Est. tax savings @ 24.0%
- +$885
- After-tax cash flow
- $1,907/yr
For passive investors: Depreciation is non-cash, so a rental often shows a tax loss while cash-flowing — sheltering income. Rental losses are passive: they offset passive income freely, and up to $25,000/yr can offset ordinary (W-2) income if you actively participate and your MAGI is under $100k (phasing out to $0 by $150k); unused losses carry forward. On sale, claimed depreciation is recaptured at up to 25%, and gains may owe capital-gains tax (a 1031 exchange can defer both). Figures are a year-1 estimate at your 24.0% rate — not tax advice; consult a CPA.
Schools (NCES district)
- District
- Pelham
- NCES district ID
- 2509390
- Math proficiency
- 65% ▼ -10.00%
- Reading proficiency
- 70% ▲ 5.00%
- Median HH income
- $84,973
- Composite
- 61.93/100
- National rank
- #1485
- State rank
- #75 of 371 in MA
Livability — Pelham
No livability data for this city. (Only ~50 U.S. cities are tracked.)
Census & demographics
- County
- Hampshire County · 76,035 people
- Metro
- Springfield, MA
- Population (ZIP)
- 26,370
- Household income
- $70,818
- Rent vs Own
- Severe rent burden
- 2123.0
Population outlook (Hampshire County) Hauer SSP2
- Today (2025)
- 166,577 people
- By 2030
- 168,928 · +1.4%
- By 2040
- 171,197 · +2.8%
- By 2050
- 175,542 · +5.4%
- By 2075
- 199,884 · +20.0%
- By 2100
- 211,819 · +27.2%
Race, ethnicity, and origin ACS 2023
- Neighborhood character
- Predominantly White (71%)
- Race & ethnicity
- White 71% Two or more races 11% Hispanic / Latino 9% Asian 8% Black 4%
- Hispanic origin (detail)
- Puerto Rican 3% Dominican 1%
- Common ancestry
- Romanian 5% Lithuanian 3% Italian 2%
- Foreign-born
- 15% · Canada, China, South Korea
- Languages at home
- 80% English-only · Spanish 6% Other Indo-European 4% Chinese 3%
Political lean MEDSL · Hampshire
- 2024 margin
- Solid D (+41.9) · D 69.5% · R 27.6% · Other 2.9%
- 2008→2024 swing
- -3.6pp toward R · 2008: 45.6pp · 2024: 41.9pp
- All cycles
- 2024: D+41.9 2020: D+46.8 2016: D+39.5 2012: D+43.8 2008: D+45.6
Not yet ingested
- Civics
- —
Market trends
- HPI YoY
- ▼ -193.66%
- Current HPI
- 294.492
- Rent YoY
- ▲ 9.32%
- Metro
- Springfield, MA
- State GDP YoY
- ▲ 2.28%
- F500 in state
- 38
Industry mix (Fortune 500 HQ in MA)
| Industry | F500 HQs | Revenue |
|---|---|---|
| Technology | 3 | $17B |
|
||
| Insurance | 2 | $84B |
|
||
| Retail | 2 | $76B |
|
||
| Life Sciences | 1 | $43B |
|
||
| Energy Technology | 1 | $31B |
|
||
| Aerospace / Defense | 1 | $18B |
|
||
Price history
+195.0% since first listed8 events — show timeline
- 2026-05-19 Listed $280,000 MLS PIN
- 2013-02-14 Sold (MLS) $154,500 MLS PIN
- 2012-09-17 Listed $159,900 MLS PIN
- 2012-07-27 Sold (MLS) $14,000 MLS PIN
- 2010-09-01 Listed $39,900 MLS PIN
- 2001-07-02 Sold (MLS) $97,900 MLS PIN
- 2001-06-28 Sold (Public Records) $97,900 Public Records
- 2001-02-09 Listed $94,900 MLS PIN
Property tax history
-0.0%/yrLatest (2023): $3,683 · -0.6% YoY. Source: county tax records.
Cash-flow waterfall
monthlySold comps — $/sqft
last 12 mo · ≤1 miLoading sold comps…