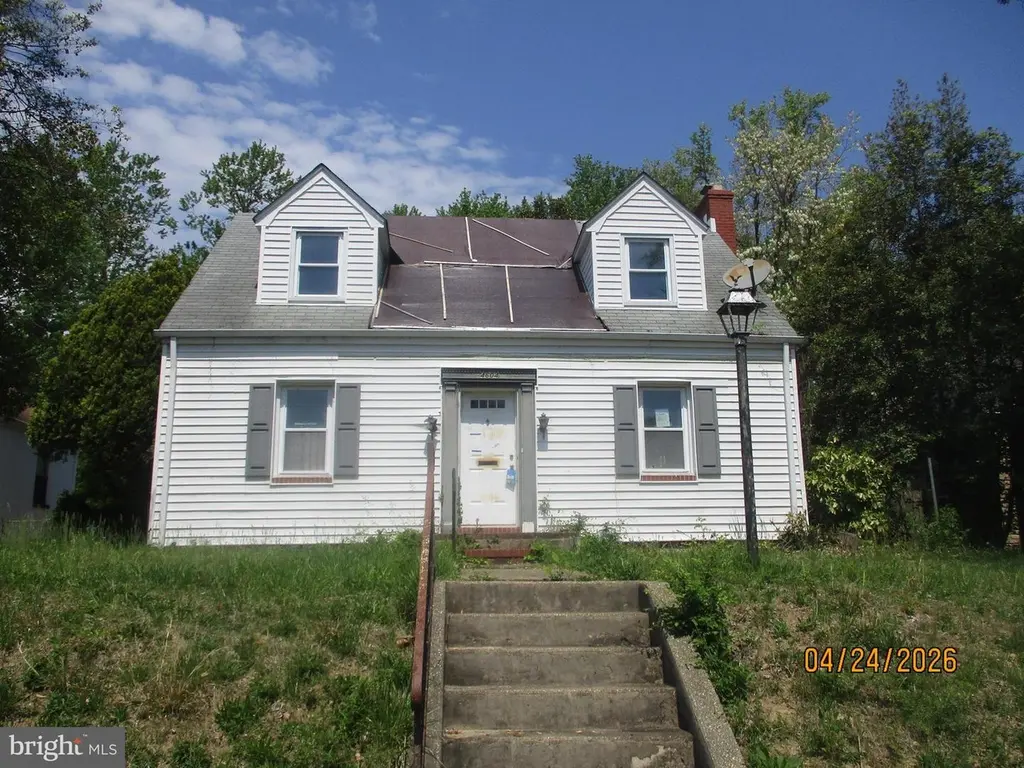
4604 Powell Ave · Overlea, MD
Flood risk 1/10 · Minimal
- FEMA flood zone
- X (unshaded)
- Chance of flooding over 30 yrs
- 0.0%
- Est. flood insurance / yr
- $473 – $860
Fire risk 1/10 · Minimal
- Est. fire insurance / yr
- $755 – $1,403
Heat risk 7/10 · Major
- Hot days now (above 103°F)
- 7 days/yr
- Hot days in 30 yrs
- 14 days/yr
Wind risk 6/10 · Moderate
- Chance of severe wind over 30 yrs
- 27.0%
Air-quality risk 5/10 · Moderate
- Unhealthy air days now
- 6 days/yr
- Unhealthy air days in 30 yrs
- 8 days/yr
Risk factors via First Street. Map © Google.
Why this score? — see what drove the B- grade
The composite is a weighted blend of 9 inputs, each scored 0–100. Each bar is that input's sub-score; the figure is the points it added to the 100-point composite (weight × sub-score).
- Cash flow +30.0/30.0
- 1% rule +10.0/10.0
- DSCR +10.0/10.0
- ARV discount +7.5/15.0
- Livability +4.0/5.0
- Rent growth +3.6/5.0
- Condition / age +2.5/5.0
- Schools +2.3/10.0
- Appreciation +0.0/10.0
$99,500
🖨 Deal sheet 📄 Offer letter ✓ Due diligence
Listing remarks
Investment opportunity in Baltimore City!. Please note that the property requires renovation and is being sold "AS-IS, WHERE-IS" in its existing condition, without representations or warranties of any kind. Buyer and Agent are strongly advised to conduct thorough due diligence on all aspects of the property—including condition, square footage, lot size, taxes, restrictions, easements, utilities, financing options, and code violations. No electricity or active utilities. All Offers to be submitted through BidOnHomes.
Key facts
- 6,168 sq ft lot
- Built 1952
- Listed 8 days
Property features AI
Exterior
- Parking: On-street parking
- Utilities: Public water; Public sewer; Hot water: natural gas
- Home design: Detached property; Fee simple ownership
- Construction: Stucco exterior; Other foundation type; Building not winterized
- Exterior features: Rear fencing; Below-grade area with finished/unfinished space
Interior
- Bedrooms: Three bedrooms on the upper level
- Flooring: Wood floors
- Bathrooms: One full bathroom and one half bathroom on the upper level; One half bathroom on the main level; Total: 1 full bath, 2 half baths
- Heating & cooling: Forced air heating (natural gas); Ceiling fan(s) and other cooling (electric)
- Interior features: Dining area; Open floor plan; Wood floors; Living Room; Dining Room; Family Room; Master Bedroom; Bedroom 2; Bedroom 3; Has fireplaces (2)
Neighborhood map
What this means for you Summary
Snapshot
- This is a 3-bed/2.0-bath single-family listed at $100k.
Deal economics
- At list price, monthly cash flow is $885 ($11k/yr) — positive.
- The deal already cash-flows at list — no discount required.
- Meets the 1% rule at list price ($2k rent vs $100k).
- Cap rate 17.0% vs local median 5.4% in Overlea — top-decile yield for the area; either an underpriced asset or a hidden risk that comps aren't pricing in. Stress-test before assuming the spread holds.
Location & tenants
- Location reads 81/100 on livability (#38 in MD, #1,418 nationally) — a professional / high-income tenant draw. Strengths: amenities A+, commute A+, housing A+; Watch: crime F.
- Baltimore County Public Schools (suburban): math 15% / reading 34% proficiency, ranked #11 of 24 in MD (top 46%) — low school quality limits family demand, transient renter base, plan for 1-2y turnover.
- Market conditions: Rents rising fast (+4.4%/yr); 173 active listings in the ZIP; 20 comparable units currently listed for rent nearby; rentals lingering (median 44d on market — plan ~5-8 weeks vacancy on turnover, expect pricing pressure); 55% of comp listings sitting > 30 days — soft ceiling on asking rent; 1,511 units permitted in Baltimore County in 2024 (643 in 5+ unit buildings).
- This rent runs 43% of the median local income ($65k/yr) — at the standard rent-burdened threshold; future hikes will face affordability resistance.
Forward outlook
- Local home prices are declining (-3.0%/yr); year-one equity from $688 of loan paydown is wiped out by about $3k of value loss. Plan a longer hold.
- Baltimore County population projected at +12% by 2050 — modest demand growth; plan on rents tracking national, not racing it.
- At projected returns (-3.0% appreciation + 4.4% rent growth), your $28k cash investment doubles in ~3 years — after that, you're playing with house money.
Negotiation context
- Only 8 days on market — expect competitive offers; lowballing is unlikely to land.
- 7 sale attempts since 19y ago with the ask held roughly flat each time — persistent listings suggest the price (not the market) is what's stuck; bring a comps-based counter.
Risks & watch-outs
- Watch-outs: property tax is 4.6% of price; built in 1952 — expect roof / HVAC / electrical / plumbing capex.
- Climate carrying-cost: major wind risk, 27% chance of damaging wind over 30y; extreme-heat days projected 7→14/yr by 2055 (HVAC capex compounding) — expect insurance premiums to compound above CPI over the hold.
Questions for the listing agent
- Built in 1952 — when were the roof, HVAC, electrical panel, plumbing, and water heater last replaced?
- Property tax is high relative to price — has the assessment been appealed recently, and will the sale trigger a re-assessment?
- Is there a deadline driving the sale (1031 exchange, divorce, estate, relocation)? That informs how much negotiation room exists.
- Crime grade is F in this area — have there been break-ins, vandalism, or insurance claims at this property in the last 3 years? What carrier currently insures it and at what premium?
- What's the average days-on-market for RENTAL listings here right now (not sales)? A rising rental-DOM trend means longer vacancies and softer asking-rent achievability than the comps imply.
- What's the recent tenant-quality profile in this submarket — average credit score on applications, eviction rate, late-payment / NSF rate, and stable-employment percentage? A property-management company in the area should have these aggregated.
- How much new for-sale + rental construction is in the pipeline within 1–3 miles? Heavy new supply typically softens prices + rents 12–24 months out; constrained supply supports both.
Investment metrics
- 1% rule
- 2.33% ✓
- Cap rate
- 16.96%
- Cash-on-cash
- 38.10%
- DSCR
- 2.70
- GRM
- 3.6
CMA / ARV
- ARV (median comp)
- $316,093
- List price
- $99,500
- Delta
- -68.52%
- Verdict
- UNDERPRICED
- Comps
- 20 within 1.0 mi
Show comp detail 12 sales within ~0.75 mi
| Address | Dist | Beds/Ba | Sqft | Sold | Price | $/sf | Match |
|---|---|---|---|---|---|---|---|
| 4433 Raspe Ave | 0.21mi | 4/2.5 (+1) | 1,720 (-6%) | 6mo | $309,000 | $180 | 67 |
| 4412 Springwood Ave | 0.22mi | 3/1.5 | 1,624 (-12%) | 3mo | $295,000 | $182 | 66 |
| 4502 Parkmont Ave | 0.18mi | 4/2.0 (+1) | 1,642 (-11%) | 4mo | $325,000 | $198 | 65 |
| 4422 Forest View Ave | 0.32mi | 4/2.0 (+1) | 1,686 (-8%) | 4mo | $150,000 | $89 | 63 |
| 4806 Hazelwood Ave | 0.28mi | 4/1.5 (+1) | 1,658 (-10%) | 1mo | $222,000 | $134 | 63 |
| 524 Elmwood Rd | 0.45mi | 3/1.5 | 1,650 (-10%) | 1mo | $319,000 | $193 | 59 |
| 4510 Bayonne Ave | 0.52mi | 4/2.0 (+1) | 1,991 (+8%) | 0mo | $370,000 | $186 | 57 |
| 5709 Anthony Ave | 0.71mi | 3/2.0 | 1,951 (+6%) | 2mo | $295,000 | $151 | 55 |
| 4103 Glenmore Ave | 0.52mi | 4/2.5 (+1) | 1,666 (-9%) | 1mo | $280,000 | $168 | 52 |
| 3905 Glenmore Ave | 0.67mi | 3/2.0 | 1,978 (+8%) | 6mo | $342,000 | $173 | 51 |
| 4211 Parkmont Ave | 0.40mi | 4/2.0 (+1) | 2,112 (+15%) | 3mo | $299,425 | $142 | 49 |
| 5703 Seymour Ave | 0.70mi | 4/1.5 (+1) | 1,680 (-9%) | 5mo | $310,000 | $185 | 42 |
Match score weights: distance 35% · size 25% · config 20% · recency 20%. Top-matched comps best support the ARV.
Projected returns pro-forma
-3.0% appreciation · 4.43% rent growth · sell at horizon
- IRR
- 36.1%
- Equity multiple
- 2.57×
- Total profit
- $43,785
- Equity at exit
- $14,836
- IRR
- 43.7%
- Equity multiple
- 5.51×
- Total profit
- $125,728
- Equity at exit
- $8,603
Cash invested: $27,860 (down + closing). Projections, not guarantees.
Landlord ↔ Tenant lean methodology
- Overall (STATE)
- 27 Tenant-Leaning
- State Maryland
- 27 Tenant-Leaning · D+14
- County
- — inherits STATE
- City
- — inherits STATE
ZIP-level market 21206
- Rents YoY
- 4.4%
- Active inventory
- 173
- Price-to-rent
- 3.6×
Monthly cashflow live
- Estimated rent
- $2,315 high interval (Pro) →
- Mortgage (P&I)
- −$522
- Tax from tax record
- −$381 /mo · $4,575/yr
- Insurance
- −$41
- HOA
- −$0
- Vacancy / Maint / Mgmt
- −$486
- Net cashflow
- $885
Break-even live
UW: 25.0% down · 7.5% · 30yr · 1.5% tax · 5.0% vac · 8.0% maint · 8.0% mgmt
Financing live
Cash to close
- Down payment
- $24,875
- Closing costs
- $2,985
- Reserves months
- —
- Total cash needed
- —
Loan-product check · same deal, 3 products live
Conventional
25% down · 7.5% · 30yr
- Down + closing
- —
- Monthly P&I
- —
- Monthly cashflow
- —
- DSCR
- —
- Eligible?
- —
Personal DTI + credit; lowest rate.
DSCR
20% down · 8.5% · 30yr
- Down + closing
- —
- Monthly P&I
- —
- Monthly cashflow
- —
- DSCR
- —
- Eligible?
- —
No personal income docs; deal must DSCR.
Hard money
10% down · 12.0% · 12mo
- Down + closing
- —
- Monthly P&I
- —
- Monthly cashflow
- —
- DSCR
- —
- Eligible?
- —
Short-term bridge; refi at stabilization.
Rent comps 20 comps
| Address | Beds | Baths | Sqft | Rent | $/sqft | DOM | Units | Dist |
|---|---|---|---|---|---|---|---|---|
| 5938 Clayton Ave Baltimore, MD | 4.0 | 2.0 | 1296 | $2,872 | $2.22 | 16d | 1 | 0.32mi |
| 5307 Valiquet Ave Unit A Baltimore, MD | 2.0 | 1.0 | 1672 | $1,375 | $0.82 | 43d | 1 | 0.60mi |
| 4111 Century Rd Baltimore, MD | 3.0 | 1.5 | 1432 | $2,500 | $1.75 | 43d | 1 | 0.61mi |
| 29 E Elm Ave Baltimore, MD | 3.0 | 2.0 | 2052 | $3,000 | $1.46 | 5d | 1 | 0.89mi |
| 5632 Belair Rd Baltimore, MD | 3.0 | 1.5 | 1260 | $2,100 | $1.67 | 23d | 1 | 0.94mi |
| 6410 Walther Ave Baltimore, MD | 2.0 | 1.0–2.0 | 1195 | $1,995 | $1.67 | 43d | 7 | 0.96mi |
| 8133 Bartholomew Ct Baltimore, MD | 3.0 | 2.5 | 1600 | $2,700 | $1.69 | 23d | 1 | 0.99mi |
| 5110 Kenwood Ave Baltimore, MD | 3.0 | 1.5 | 1406 | $2,500 | $1.78 | 43d | 1 | 1.06mi |
| 3412 Fleetwood Ave Baltimore, MD | 3.0 | 2.5 | 1620 | $2,195 | $1.35 | 43d | 1 | 1.13mi |
| 100 Elinor Ave Nottingham, MD | 4.0 | 2.5 | 1800 | $2,800 | $1.56 | 23d | 1 | 1.18mi |
| 101 Elinor Ave Nottingham, MD | 4.0 | 2.0 | 1476 | $2,900 | $1.96 | 43d | 1 | 1.19mi |
| 5248 Darien Rd Baltimore, MD | 3.0 | 1.0 | 1584 | $2,100 | $1.33 | 43d | 1 | 1.25mi |
| 5 Belhaven Dr Nottingham, MD | 4.0 | 1.5 | 1554 | $2,000 | $1.29 | 43d | 1 | 1.28mi |
| 1732 Chesaco Ave Rosedale, MD | 3.0 | 1.0 | 1260 | $2,295 | $1.82 | 43d | 1 | 1.28mi |
| 5313 Todd Ave Baltimore, MD | 3.0 | 1.5 | 1280 | $1,800 | $1.41 | 16d | 1 | 1.30mi |
| 3721 Frankford Ave Baltimore, MD | 3.0 | 2.0 | 1600 | $2,050 | $1.28 | 43d | 1 | 1.32mi |
| 3510 Hamilton Ave Baltimore, MD | 3.0 | 2.5 | 2100 | $2,300 | $1.10 | 23d | 1 | 1.34mi |
| 3158 Woodring Ave Parkville, MD | 3.0 | 1.5 | 1500 | $1,950 | $1.30 | 23d | 1 | 1.42mi |
| 3802 Biddison Ln Baltimore, MD | 4.0 | 1.5 | 1443 | $2,024 | $1.40 | 11d | 1 | 1.46mi |
| 8212 Dorset Ave Rosedale, MD | 4.0 | 1.5 | 1479 | $2,250 | $1.52 | 43d | 1 | 1.49mi |
Listing history 28 events
-
2026-05-05status Pending 537-char remark
-
2026-04-27$99,500 Active 537-char remark
-
2015-05-02historical
-
2015-04-29historical Temporarily Off-Market
-
2015-04-27status Active
-
2015-01-20status Contract
-
2015-01-07Active
-
2015-01-07$86,900
-
2014-09-02historical Withdrawn
-
2014-09-01historical
-
2014-07-17price
-
2014-07-11price
-
2014-05-03price
-
2014-04-29price
-
2014-03-17price
-
2014-02-28price
-
2014-02-22price
-
2014-02-14price
-
2014-01-30price
-
2013-12-23price
-
2013-12-17price
-
2013-12-02price
-
2013-11-11Active
-
2013-11-11$120,900
-
2007-06-07soldstatus $201,560
-
2007-05-29soldstatus $243,000
-
2007-03-30historical
-
2007-02-14$239,000
ⓘ Source: listings_history table (triggers on properties + properties_extension) + one-shot
backfill from property_details.listing_events for pre-trigger history.
Tax reassessment forecast MD · Partial reset (capped growth)
- Current annual tax
- $4,575 · $381/mo
- Projected year-2 tax
- $4,575 · $381/mo
- Expected delta
- $0/yr ($0/mo · 0.0%)
ⓘ Screening estimate from a state-policy table — verify with the county assessor before closing.
Climate risk First Street
- Flood 1/10 Low FEMA zone X (unshaded) · 0% chance over 30 yrs
- Wildfire 1/10 Low
- Heat 7/10 Severe 7 d/yr ≥103°F today · 14 d/yr by 30 yrs out
- Wind 6/10 Major 27% chance of damaging wind over 30 yrs
- Air quality 5/10 Major 6 unhealthy d/yr today · 8 by 30 yrs out
Nearby sold comps map
Loading sold comps map…
Walkable amenities ~0.75 mi
Loading nearby amenities…
Taxation est. · year 1
- Rental income
- $27,783
- − Mortgage interest
- −$5,574
- − Property taxes
- −$4,575
- − Insurance
- −$498
- − Repairs & maintenance
- −$2,223
- − Management
- −$2,223
- − Depreciation
- −$2,895
- Taxable income
- $9,797
- Est. tax owed @ 24.0%
- −$2,351
- After-tax cash flow
- $8,263/yr
For passive investors: Depreciation is non-cash, so a rental often shows a tax loss while cash-flowing — sheltering income. Rental losses are passive: they offset passive income freely, and up to $25,000/yr can offset ordinary (W-2) income if you actively participate and your MAGI is under $100k (phasing out to $0 by $150k); unused losses carry forward. On sale, claimed depreciation is recaptured at up to 25%, and gains may owe capital-gains tax (a 1031 exchange can defer both). Figures are a year-1 estimate at your 24.0% rate — not tax advice; consult a CPA.
Schools (NCES district)
- District
- Baltimore County Public Schools
- NCES district ID
- 2400120
- Math proficiency
- 15% ▼ -16.00%
- Reading proficiency
- 34% ▼ -5.00%
- Median HH income
- $66,746
- Composite
- 23.17/100
- National rank
- #7948
- State rank
- #11 of 24 in MD
Livability — Overlea
- Score
- 81/100
- State rank
- #38
- US rank
- #1418
Category grades
Schools grade is shown separately in the Schools card above.
Census & demographics
- Census place
- Overlea, MD
- County
- Baltimore City · 558,601 people
- Metro
- Baltimore-Columbia-Towson, MD
- Population (ZIP)
- 48,902
- Household income
- $64,531
- Rent vs Own
- Severe rent burden
- 2317.0
Population outlook (Baltimore County) Hauer SSP2
- Today (2025)
- 885,518 people
- By 2030
- 909,272 · +2.7%
- By 2040
- 951,547 · +7.5%
- By 2050
- 990,955 · +11.9%
- By 2075
- 1,086,411 · +22.7%
- By 2100
- 1,135,078 · +28.2%
Race, ethnicity, and origin ACS 2023
- Neighborhood character
- Predominantly Black (73%)
- Race & ethnicity
- Black 73% White 20% Two or more races 3% Hispanic / Latino 3% Asian 2%
- Common ancestry
- Romanian 3% Ukrainian 1%
- Foreign-born
- 8% · Canada
- Languages at home
- 92% English-only · Spanish 2% Arabic 2% Other Indo-European 1%
Political lean MEDSL · Baltimore
- 2024 margin
- Strong D (+24.5) · D 61.0% · R 36.5% · Other 2.5%
- 2008→2024 swing
- +9.9pp toward D · 2008: 14.6pp · 2024: 24.5pp
- All cycles
- 2024: D+24.5 2020: D+27.0 2016: D+17.4 2012: D+16.4 2008: D+14.6
Not yet ingested
- Civics
- —
Market trends
- HPI YoY
- ▼ -191.83%
- Current HPI
- 284.5645
- Rent YoY
- ▲ 4.43%
- Metro
- Baltimore-Columbia-Towson, MD
- State GDP YoY
- ▲ 2.97%
- F500 in state
- 12
Industry mix (Fortune 500 HQ in MD)
| Industry | F500 HQs | Revenue |
|---|---|---|
| Aerospace / Defense | 1 | $71B |
|
||
| Utilities | 1 | $25B |
|
||
| Hotels | 1 | $24B |
|
||
| Consumer Goods | 1 | $7B |
|
||
| Real Estate | 1 | $6B |
|
||
| Chemicals | 1 | $2B |
|
||
Price history
-58.4% since first listed28 events — show timeline
- 2026-05-05 Pending — BRIGHT MLS
- 2026-04-27 Listed $99,500 BRIGHT MLS
- 2015-05-02 Listing Removed — BRIGHT MLS
- 2015-04-29 Delisted — MRIS
- 2015-04-27 Relisted — MRIS
- 2015-01-20 Pending — MRIS
- 2015-01-07 Listed — MRIS
- 2015-01-07 Listed $86,900 BRIGHT MLS
- 2014-09-02 Delisted — MRIS
- 2014-09-01 Listing Removed — BRIGHT MLS
- 2014-07-17 Price Changed — MRIS
- 2014-07-11 Price Changed — MRIS
- 2014-05-03 Price Changed — MRIS
- 2014-04-29 Price Changed — MRIS
- 2014-03-17 Price Changed — MRIS
- 2014-02-28 Price Changed — MRIS
- 2014-02-22 Price Changed — MRIS
- 2014-02-14 Price Changed — MRIS
- 2014-01-30 Price Changed — MRIS
- 2013-12-23 Price Changed — MRIS
- 2013-12-17 Price Changed — MRIS
- 2013-12-02 Price Changed — MRIS
- 2013-11-11 Listed — MRIS
- 2013-11-11 Listed $120,900 BRIGHT MLS
- 2007-06-07 Sold (Public Records) $201,560 Public Records
- 2007-05-29 Sold (MLS) $243,000 MRIS
- 2007-03-30 Delisted — MRIS
- 2007-02-14 Listed $239,000 MRIS
Property tax history
-0.8%/yrLatest (2025): $4,575 · +5.4% YoY. Source: county tax records.
Cash-flow waterfall
monthlySold comps — $/sqft
last 12 mo · ≤1 miLoading sold comps…