 Multi-family
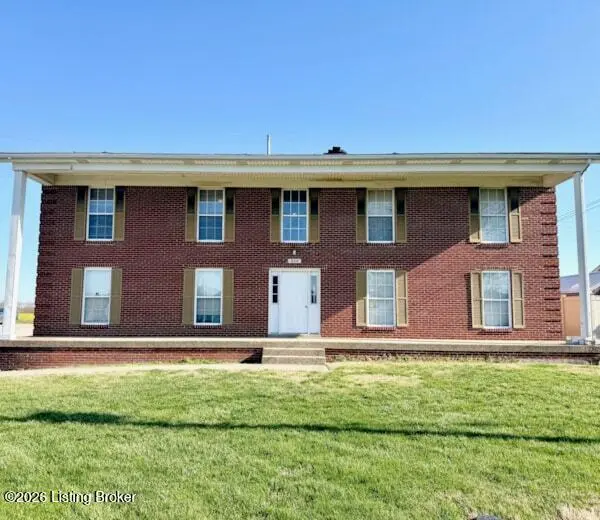
430 Joy Ave · Mount Washington, KY
Flood risk 1/10 · Minimal
- FEMA flood zone
- X (unshaded)
- Chance of flooding over 30 yrs
- 0.0%
- Est. flood insurance / yr
- $507 – $1,088
Fire risk 4/10 · Minor
- Est. fire insurance / yr
- $839 – $1,559
Heat risk 4/10 · Minor
- Hot days now (above 105°F)
- 7 days/yr
- Hot days in 30 yrs
- 19 days/yr
Wind risk 2/10 · Minimal
- Chance of severe wind over 30 yrs
- 3.0%
Air-quality risk 2/10 · Minimal
- Unhealthy air days now
- 1 days/yr
- Unhealthy air days in 30 yrs
- 2 days/yr
Risk factors via First Street. Map © Google.
Why this score? — see what drove the D+ grade
The composite is a weighted blend of 9 inputs, each scored 0–100. Each bar is that input's sub-score; the figure is the points it added to the 100-point composite (weight × sub-score).
- Cash flow +18.9/30.0
- ARV discount +7.5/15.0
- DSCR +5.9/10.0
- 1% rule +4.1/10.0
- Livability +3.5/5.0
- Schools +3.1/10.0
- Rent growth +2.5/5.0
- Condition / age +2.5/5.0
- Appreciation +0.0/10.0
$1,400,000
🖨 Deal sheet 📄 Offer letter ✓ Due diligence
Multi-family units
County records classify this as Multi-Family (2-4 Unit). Listing-text estimate: 1 unit. estimate disagrees with records
Listing remarks
Check out this cash-flowing 12-plex featuring onsite coin laundry and strong investment potential. The property consists of eight 2-bedroom, 1-bathroom units and two 1-bedroom, 1-bathroom units. One vacant unit is available for showings, while all occupied units may be viewed during the due diligence period following an accepted offer. Buyers are welcome to include a walk-through contingency with any submitted offer. The property is professionally managed, and rent rolls along with financials are available upon request. This is a great addition to any investment portfolio. Seller prefers to sell this property together with 3414 Burkland Blvd.
Key facts
- Onsite coin laundry
- Cash-flowing 12-plex
- 0.67 acre lot
Tags
Property features AI
Finance
- Financial info: Tenants pay electric; Tenants pay water
- HOA & community: No association fee
Exterior
- Parking: 10 total parking spaces; No covered parking
- Utilities: Electricity connected; 12 furnaces
- Home design: Apartment property; Shingle roof
- Construction: Built in 1997; Brick construction
- Exterior features: No exterior amenities listed
Interior
- Bedrooms: No individual bedrooms listed
- Heating & cooling: Forced air heating; Central air conditioning
- Interior features: Property is an apartment building; Separate meters for units
Neighborhood map
What this means for you Summary
Snapshot
- This is a multifamily listed at $1.40M.
Deal economics
- At list price, monthly cash flow is $1k ($17k/yr) — positive.
- The deal already cash-flows at list — no discount required.
- To meet the 1% rule (rent ≥ 1% of price), the offer needs to be $1.27M (9.0% below list).
- Recommended offer: $1.27M (9.0% below list) — sets the bar for 1% rule.
- Cap rate 7.5% vs local median 3.1% in Mount Washington — top-decile yield for the area; either an underpriced asset or a hidden risk that comps aren't pricing in. Stress-test before assuming the spread holds.
Location & tenants
- Location reads 70/100 on livability (#158 in KY) — a middle-class / working-renter tenant base. Strengths: crime A+, cost of living A+, housing A+; Watch: amenities F, commute F, health & safety F.
- Bullitt County (suburban): math 29% / reading 41% proficiency, ranked #55 of 165 in KY (top 33%) — families likely to look elsewhere, expect single-tenant / working-renter base with shorter leases.
- Market conditions: 295 active listings in the ZIP; 1 comparable units currently listed for rent nearby; solid renter incomes; 380 units permitted in Bullitt County in 2024 (8 in 5+ unit buildings).
- At $12,743/mo this rent would consume 154% of the median local household income ($99k/yr) (locally 90% of renters already pay >50% of income on rent) — very limited rent-growth headroom before tenants either downsize or default.
Forward outlook
- Local home prices are declining (-3.0%/yr); year-one equity from $10k of loan paydown is wiped out by about $42k of value loss. Plan a longer hold.
- Bullitt County population projected at +22% by 2050 — long-run rental-demand tailwind backs the buy-and-hold thesis.
Negotiation context
- It's been on market 20 days — a 2% lower offer ($1.38M) is reasonable based on typical stale-listing flexibility.
- Current owner paid $650k; list at $1.40M implies a 115% gain — meaningful room to come down on a strong offer.
Questions for the listing agent
- Is there a deadline driving the sale (1031 exchange, divorce, estate, relocation)? That informs how much negotiation room exists.
- The area grade is low — what's the realistic commute time and amenity access for the typical tenant pool here? Any planned neighborhood developments (good or bad) we should know about?
- What's the average days-on-market for RENTAL listings here right now (not sales)? A rising rental-DOM trend means longer vacancies and softer asking-rent achievability than the comps imply.
- What's the recent tenant-quality profile in this submarket — average credit score on applications, eviction rate, late-payment / NSF rate, and stable-employment percentage? A property-management company in the area should have these aggregated.
- How much new apartment / multifamily construction is in the pipeline within 1–3 miles? Heavy new supply (>2% of stock underway) typically softens rents 12–24 months out; light construction supports rent growth.
Investment metrics
- 1% rule
- 0.91% ✗
- Cap rate
- 7.51%
- Cash-on-cash
- 4.36%
- DSCR
- 1.19
- GRM
- 9.2
CMA / ARV
No comps found within radius.
Projected returns pro-forma
-3.0% appreciation · 3.0% rent growth · sell at horizon
- IRR
- -9.5%
- Equity multiple
- 0.65×
- Total profit
- $-136,596
- Equity at exit
- $208,745
- IRR
- -0.1%
- Equity multiple
- 0.99×
- Total profit
- $-3,942
- Equity at exit
- $121,046
Cash invested: $392,000 (down + closing). Projections, not guarantees.
Landlord ↔ Tenant lean methodology
- Overall (STATE)
- 83 Strongly Landlord-Friendly
- State Kentucky
- 83 Strongly Landlord-Friendly · R+16
- County
- — inherits STATE
- City
- — inherits STATE
ZIP-level market 40047
- Home prices YoY
- -18.8%
- Active inventory
- 295
- Price-to-rent
- 106.3×
Monthly cashflow live
- Estimated rent
- $12,743 medium interval (Pro) →
- Mortgage (P&I)
- −$7,342
- Tax from tax record
- −$718 /mo · $8,612/yr
- Insurance
- −$583
- HOA
- −$0
- Vacancy / Maint / Mgmt
- −$2,676
- Net cashflow
- $1,424
Break-even live
12-unit breakdown (identical units grouped — click to expand)
| Units | Beds | Baths | Est. rent |
|---|---|---|---|
| 8× units | 2 | 1 | $8,784 |
| #1 | 2 | 1 | $1,098 |
| #2 | 2 | 1 | $1,098 |
| #3 | 2 | 1 | $1,098 |
| #4 | 2 | 1 | $1,098 |
| #5 | 2 | 1 | $1,098 |
| #6 | 2 | 1 | $1,098 |
| #7 | 2 | 1 | $1,098 |
| #8 | 2 | 1 | $1,098 |
| 4× units | 1 | 1 | $3,960 |
| #9 | 1 | 1 | $990 |
| #10 | 1 | 1 | $990 |
| #11 | 1 | 1 | $990 |
| #12 | 1 | 1 | $990 |
| Total (12 units) | $12,743 | ||
UW: 25.0% down · 7.5% · 30yr · 1.5% tax · 5.0% vac · 8.0% maint · 8.0% mgmt
Financing live
Cash to close
- Down payment
- $350,000
- Closing costs
- $42,000
- Reserves months
- —
- Total cash needed
- —
Loan-product check · same deal, 3 products live
Conventional
25% down · 7.5% · 30yr
- Down + closing
- —
- Monthly P&I
- —
- Monthly cashflow
- —
- DSCR
- —
- Eligible?
- —
Personal DTI + credit; lowest rate.
DSCR
20% down · 8.5% · 30yr
- Down + closing
- —
- Monthly P&I
- —
- Monthly cashflow
- —
- DSCR
- —
- Eligible?
- —
No personal income docs; deal must DSCR.
Hard money
10% down · 12.0% · 12mo
- Down + closing
- —
- Monthly P&I
- —
- Monthly cashflow
- —
- DSCR
- —
- Eligible?
- —
Short-term bridge; refi at stabilization.
Rent comps 1 comps
| Address | Beds | Baths | Sqft | Rent | $/sqft | DOM | Units | Dist |
|---|---|---|---|---|---|---|---|---|
| 113 Taylor Ct Mount Washington, KY | 3.0 | 2.0 | 1448 | $2,320 | $1.60 | 2d | 1 | 1.19mi |
Listing history 13 events
-
2026-06-18days on market $1,400,000 Active 20 DOM
-
2026-06-17days on market $1,400,000 Active 19 DOM
-
2026-06-16days on market $1,400,000 Active 18 DOM
-
2026-06-15days on market $1,400,000 Active 17 DOM
-
2026-06-13days on market $1,400,000 Active 15 DOM
-
2026-06-10days on market $1,400,000 Active 12 DOM
-
2026-06-09days on market $1,400,000 Active 11 DOM
-
2026-06-08days on market $1,400,000 Active 10 DOM
-
2026-06-07days on market $1,400,000 Active 9 DOM
-
2026-06-03days on market $1,400,000 Active 5 DOM
-
2026-06-02days on market $1,400,000 Active 4 DOM
-
2026-06-01days on market $1,400,000 Active 3 DOM
-
2026-05-31days on market $1,400,000 Active 2 DOM
ⓘ Source: listings_history table (triggers on properties + properties_extension) + one-shot
backfill from property_details.listing_events for pre-trigger history.
Tax reassessment forecast KY · Resets to sale price
- Current annual tax
- $8,612 · $718/mo
- Projected year-2 tax
- $12,040 · $1,003/mo
- Expected delta
- +$3,428/yr (+$286/mo · 39.8%)
ⓘ Screening estimate from a state-policy table — verify with the county assessor before closing.
Climate risk First Street
- Flood 1/10 Low FEMA zone X (unshaded) · 0% chance over 30 yrs
- Wildfire 4/10 Moderate
- Heat 4/10 Moderate 7 d/yr ≥105°F today · 19 d/yr by 30 yrs out
- Wind 2/10 Low 3% chance of damaging wind over 30 yrs
- Air quality 2/10 Low 1 unhealthy d/yr today · 2 by 30 yrs out
Nearby sold comps map
Loading sold comps map…
Walkable amenities ~0.75 mi
Loading nearby amenities…
Taxation est. · year 1
- Rental income
- $152,916
- − Mortgage interest
- −$78,422
- − Property taxes
- −$8,612
- − Insurance
- −$7,000
- − Repairs & maintenance
- −$12,233
- − Management
- −$12,233
- − Depreciation
- −$40,727
- Taxable loss
- −$6,312
- Est. tax savings @ 24.0%
- +$1,515
- After-tax cash flow
- $18,605/yr
For passive investors: Depreciation is non-cash, so a rental often shows a tax loss while cash-flowing — sheltering income. Rental losses are passive: they offset passive income freely, and up to $25,000/yr can offset ordinary (W-2) income if you actively participate and your MAGI is under $100k (phasing out to $0 by $150k); unused losses carry forward. On sale, claimed depreciation is recaptured at up to 25%, and gains may owe capital-gains tax (a 1031 exchange can defer both). Figures are a year-1 estimate at your 24.0% rate — not tax advice; consult a CPA.
Schools (NCES district)
- District
- Bullitt County
- NCES district ID
- 2100750
- Math proficiency
- 29% ▼ -15.00%
- Reading proficiency
- 41% ▼ -14.00%
- Median HH income
- $55,009
- Composite
- 30.78/100
- National rank
- #6151
- State rank
- #55 of 165 in KY
Livability — Mount Washington
- Score
- 70/100
- State rank
- #158
- US rank
- #7984
Category grades
Schools grade is shown separately in the Schools card above.
Census & demographics
- Census place
- Mount Washington, KY
- County
- Bullitt County · 62,065 people
- City population
- 23,662
- Metro
- Louisville/Jefferson County, KY-IN
- Population (ZIP)
- 23,662
- Household income
- $99,124
- Rent vs Own
- Severe rent burden
- 90.0
Population outlook (Bullitt County) Hauer SSP2
- Today (2025)
- 89,555 people
- By 2030
- 94,389 · +5.4%
- By 2040
- 102,759 · +14.7%
- By 2050
- 108,955 · +21.7%
- By 2075
- 121,898 · +36.1%
- By 2100
- 126,383 · +41.1%
Race, ethnicity, and origin ACS 2023
- Neighborhood character
- Predominantly White (92%)
- Race & ethnicity
- White 92% Two or more races 5% Hispanic / Latino 3%
- Common ancestry
- Lithuanian 3% Slovak 2% Iranian 2%
- Foreign-born
- 2% · Canada
- Languages at home
- 97% English-only · Spanish 2%
Political lean MEDSL · Bullitt
- 2024 margin
- Solid R (+51.0) · D 23.8% · R 74.8% · Other 1.4%
- 2008→2024 swing
- -18.7pp toward R · 2008: -32.3pp · 2024: -51.0pp
- All cycles
- 2024: R+51.0 2020: R+48.0 2016: R+49.8 2012: R+35.7 2008: R+32.3
Not yet ingested
- Civics
- —
Market trends
- HPI YoY
- ▼ -61.20%
- Current HPI
- 264.3563
- Rent YoY
- —
- Metro
- Louisville/Jefferson County, KY-IN
- State GDP YoY
- ▲ 1.81%
- F500 in state
- 4
Industry mix (Fortune 500 HQ in KY)
| Industry | F500 HQs | Revenue |
|---|---|---|
| Healthcare | 1 | $118B |
|
||
| Food / Beverage | 1 | $7B |
|
||
Price history
+245.7% since first listed3 events — show timeline
- 2026-05-29 Listed $1,400,000 Metro Search MLS
- 2021-07-14 Sold (Public Records) $650,000 Public Records
- 2003-12-01 Sold (Public Records) $405,000 Public Records
Property tax history
+3.4%/yrLatest (2025): $8,612 · -0.8% YoY. Source: county tax records.
Cash-flow waterfall
monthlySold comps — $/sqft
last 12 mo · ≤1 miLoading sold comps…