5438 Verona Drive Unit 812 L Dr Unit L · Golf, FL
Flood risk 1/10 · Minimal
- FEMA flood zone
- X (unshaded)
- Chance of flooding over 30 yrs
- 0.0%
- Est. flood insurance / yr
- $507 – $1,088
Fire risk 1/10 · Minimal
- Est. fire insurance / yr
- $947 – $1,759
Heat risk 9/10 · Severe
- Hot days now (above 106°F)
- 7 days/yr
- Hot days in 30 yrs
- 26 days/yr
Wind risk 10/10 · Severe
- Chance of severe wind over 30 yrs
- 99.0%
Air-quality risk 2/10 · Minimal
- Unhealthy air days now
- 1 days/yr
- Unhealthy air days in 30 yrs
- 2 days/yr
Risk factors via First Street. Map © Google.
Why this score? — see what drove the D+ grade
The composite is a weighted blend of 9 inputs, each scored 0–100. Each bar is that input's sub-score; the figure is the points it added to the 100-point composite (weight × sub-score).
- Cash flow +9.8/30.0
- 1% rule +9.0/10.0
- ARV discount +7.5/15.0
- Appreciation +4.9/10.0
- Schools +4.3/10.0
- Livability +3.2/5.0
- DSCR +2.8/10.0
- Rent growth +2.8/5.0
- Condition / age +2.5/5.0
$195,000
🖨 Deal sheet (PDF) 📄 Offer letter ✓ Due diligence
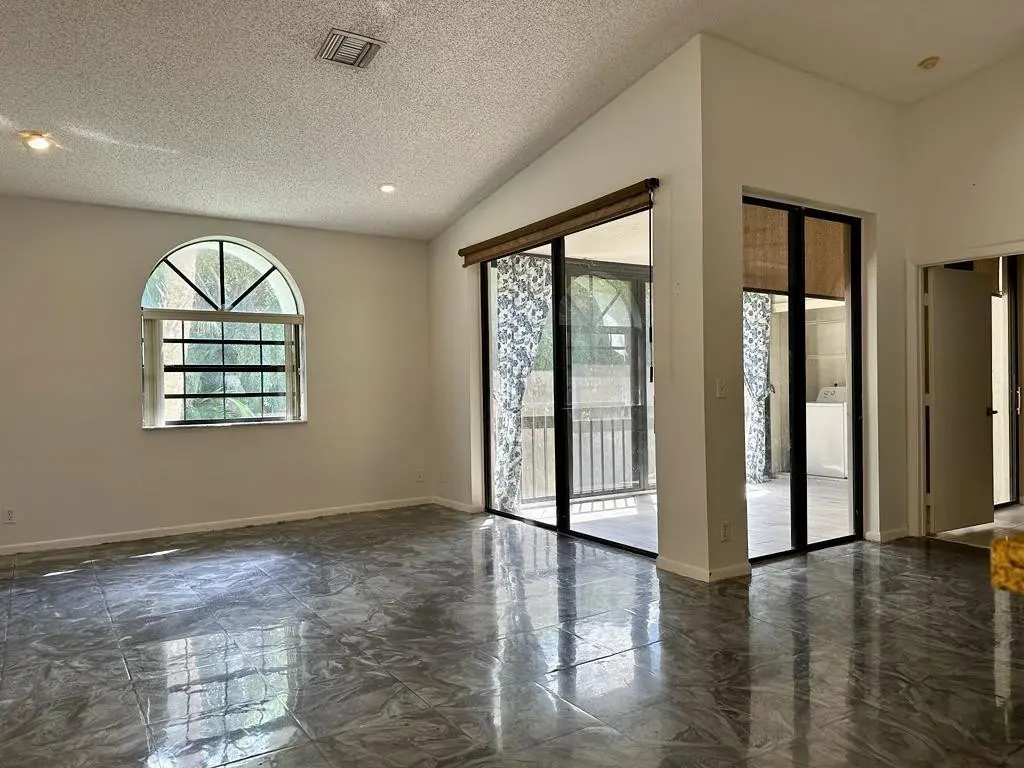
Listing remarks
All ages welcome, and no credit score required! Large fully updated condo in a gated community. Cathedral ceilings, split bedrooms, large screened in lanai with a private view. Full size washer/dryer is in the unit. The rent includes water & cable, and Platina has a Renovated resort style Club House that includes a cafe, billiard Room, Community Pool, community Room, Library, Pickleball, Pool, Sauna, Spa/Hot Tub, Tennis security & much more!
Key facts
- Gated community
- Community pool
- Pickleball
Tags
Property features AI
Finance
- Financial info: Monthly HOA fee required
- HOA & community: Monthly HOA with amenities; Community amenities include clubhouse, fitness center, pool, spa/hot tub, tennis courts, pickleball courts, shuffleboard court, recreation facilities, community room, cafe/restaurant, parking and security
Exterior
- Parking: One parking space; Guest parking
- Security: Gated community with guard
- Utilities: Public water; Public sewer; Cable available; Water, sewer and utilities available
- Home design: Condominium; Second-floor entry; Two-story building (unit on one level); Faces north; Resale condition
- Construction: Concrete block construction; Tile roof
- Exterior features: Screened porch; Porch; Waterfront property; In-ground spa
Interior
- Kitchen: Electric cooktop; Dishwasher; Microwave; Refrigerator; Garbage disposal; Owned water purifier; Owned water softener; Electric water heater
- Bedrooms: One main-level bedroom
- Flooring: Laminate flooring; Tile flooring
- Bathrooms: Two full bathrooms (one on main level)
- Heating & cooling: Central electric heating; Central air conditioning; Ceiling fans
- Interior features: Vaulted ceilings
- Laundry & utility: Washer hookup in unit; Electric dryer hookup in unit
Neighborhood map
What this means for you Summary
Snapshot
- This is a 2-bed/2.0-bath condo listed at $195k.
Deal economics
- At list price, monthly cash flow is $-125 ($-1k/yr) — negative.
- To cash-flow at today's rent, offer at most $173k (11.3% below list).
- Meets the 1% rule at list price ($3k rent vs $195k).
- Recommended offer: $173k (11.3% below list) — sets the bar for cash-flow.
Location & tenants
- Location reads 63/100 on livability (#703 in FL) — a middle-class / working-renter tenant base. Strengths: crime A+, employment A+, housing A+; Watch: amenities F, commute F, cost of living F.
- Palm Beach (suburban): math 46% / reading 53% proficiency, ranked #34 of 73 in FL (top 47%) — families likely to look elsewhere, expect single-tenant / working-renter base with shorter leases.
- Zoned schools: Crystal Lakes Elementary School (math 55% / reading 64%, grade B-, #690 of 2,144 statewide, top 34%, 788 students, 37% FRL); Boynton Beach Community High (math 13% / reading 25%, grade F, #565 of 667 statewide, top 85%, 1,547 students, 65% FRL) — zoned schools at 51% FRL track the district average.
- Market conditions: Rents rising (+1.3%/yr); 489 active listings in the ZIP; 40 comparable units currently listed for rent nearby; rentals at typical pace (median 26d on market — plan ~3-4 weeks tenant-placement turnaround); solid renter incomes; 3,974 units permitted in Palm Beach County in 2024 (1,012 in 5+ unit buildings).
- This rent runs 41% of the median local income ($81k/yr) — at the standard rent-burdened threshold; future hikes will face affordability resistance.
Forward outlook
- In year one you build about $877 of equity ($1k loan paydown + $-471 appreciation (-0.2% local appreciation)).
- Palm Beach County population projected at +30% by 2050 — long-run rental-demand tailwind backs the buy-and-hold thesis.
Negotiation context
- It's been on market 95 days — a 9% lower offer ($177k) is reasonable based on typical stale-listing flexibility.
- 15 sale attempts since 24y ago; this cycle's ask is 8028% above the opening price — seller raised mid-cycle; expect resistance to lowballs.
- Current owner paid $132k; 47% above their basis — modest negotiation headroom, anchor on the comps not their cost.
Risks & watch-outs
- Watch-outs: HOA is 34% of rent.
- Climate carrying-cost: severe wind risk, 99% chance of damaging wind over 30y; extreme-heat days projected 7→26/yr by 2055 (HVAC capex compounding) — expect insurance premiums to compound above CPI over the hold.
Questions for the listing agent
- What do current leases actually rent for vs. the listed asking? Can we see a recent rent roll and the last 12 months of T-12 income?
- It's been on market 95 days. Have you received any prior offers? Is the seller open to a 11% concession, seller financing, or rate buy-down credit?
- What does the HOA fee cover, when was the last increase, and are there any pending special assessments or reserve-fund shortfalls?
- Any open or pending special assessments — roof, HVAC, plumbing, elevator, façade? What's the per-unit balance and payoff schedule, and is the seller paying it off at close or rolling it to the buyer?
- Why hasn't it sold? Are there any deal-killer items the seller is aware of (foundation, flood, title, zoning, code violations)?
- Is there a deadline driving the sale (1031 exchange, divorce, estate, relocation)? That informs how much negotiation room exists.
- The area grade is low — what's the realistic commute time and amenity access for the typical tenant pool here? Any planned neighborhood developments (good or bad) we should know about?
- What's the average days-on-market for RENTAL listings here right now (not sales)? A rising rental-DOM trend means longer vacancies and softer asking-rent achievability than the comps imply.
- What's the recent tenant-quality profile in this submarket — average credit score on applications, eviction rate, late-payment / NSF rate, and stable-employment percentage? A property-management company in the area should have these aggregated.
- How much new apartment / multifamily construction is in the pipeline within 1–3 miles? Heavy new supply (>2% of stock underway) typically softens rents 12–24 months out; light construction supports rent growth.
Investment metrics
- 1% rule
- 1.40% ✓
- Cap rate
- 5.53%
- Cash-on-cash
- -2.74%
- DSCR
- 0.88
- GRM
- 5.9
CMA / ARV
No comps found within radius.
Projected returns pro-forma
-0.24% appreciation · 1.28% rent growth · sell at horizon
- IRR
- -8.1%
- Equity multiple
- 0.64×
- Total profit
- $-19,882
- Equity at exit
- $54,277
- IRR
- -3.9%
- Equity multiple
- 0.63×
- Total profit
- $-20,364
- Equity at exit
- $63,400
Cash invested: $54,600 (down + closing). Projections, not guarantees.
Landlord ↔ Tenant lean methodology
- Overall (STATE)
- 87 Strongly Landlord-Friendly
- State Florida
- 87 Strongly Landlord-Friendly · R+3
- County
- — inherits STATE
- City
- — inherits STATE
ZIP-level market 33437
- Home prices YoY
- -0.1%
- Rents YoY
- 1.3%
- Active inventory
- 489
- Price-to-rent
- 5.9×
Monthly cashflow live
- Estimated rent
- $2,739 high interval (Pro) →
- Mortgage (P&I)
- −$1,023
- Tax from tax record
- −$255 /mo · $3,063/yr
- Insurance
- −$81
- HOA
- −$929
- Vacancy / Maint / Mgmt
- −$575
- Net cashflow
- $-125
Break-even live
Sensitivity live
| Price | -10% $-14 | -5% $-69 | +0% $-125 | +5% $-180 | +10% $-235 |
|---|---|---|---|---|---|
| Rent | -10% $-341 | -5% $-233 | +0% $-125 | +5% $-16 | +10% $92 |
| Rate | -1.0pp $-26 | -0.5pp $-75 | base $-125 | +0.5pp $-175 | +1.0pp $-226 |
UW: 25.0% down · 7.5% · 30yr · 1.5% tax · 5.0% vac · 8.0% maint · 8.0% mgmt
Financing live
Cash to close
- Down payment
- $48,750
- Closing costs
- $5,850
- Reserves months
- —
- Total cash needed
- —
Loan-product check · same deal, 3 products live
Conventional
25% down · 7.5% · 30yr
- Down + closing
- —
- Monthly P&I
- —
- Monthly cashflow
- —
- DSCR
- —
- Eligible?
- —
Personal DTI + credit; lowest rate.
DSCR
20% down · 8.5% · 30yr
- Down + closing
- —
- Monthly P&I
- —
- Monthly cashflow
- —
- DSCR
- —
- Eligible?
- —
No personal income docs; deal must DSCR.
Hard money
10% down · 12.0% · 12mo
- Down + closing
- —
- Monthly P&I
- —
- Monthly cashflow
- —
- DSCR
- —
- Eligible?
- —
Short-term bridge; refi at stabilization.
Rent comps 40 comps
| Address | Beds | Baths | Sqft | Rent | $/sqft | DOM | Units | Dist |
|---|---|---|---|---|---|---|---|---|
| 5418 Firenze Dr Unit P Boynton Beach, FL | 2.0 | 2.0 | 1139 | $2,400 | $2.11 | 4d | 1 | 0.12mi |
| 5133 Brisata Cir Unit P Boynton Beach, FL | 3.0 | 2.0 | 1374 | $2,800 | $2.04 | 26d | 1 | 0.13mi |
| 5275 Europa Dr Unit I Boynton Beach, FL | 3.0 | 2.0 | 1282 | $2,500 | $1.95 | 3d | 1 | 0.22mi |
| 5157 Floria Way Unit J Boynton Beach, FL | 3.0 | 2.0 | 1447 | $3,300 | $2.28 | 26d | 1 | 0.23mi |
| 5299 Europa Dr Unit P Boynton Beach, FL | 3.0 | 2.0 | 1606 | $3,000 | $1.87 | 15d | 1 | 0.26mi |
| 5234 Europa Dr Unit A Boynton Beach, FL | 3.0 | 2.0 | 1578 | $2,500 | $1.58 | 21d | 1 | 0.31mi |
| 5155 Europa Dr Unit J Boynton Beach, FL | 3.0 | 2.0 | 1333 | $2,750 | $2.06 | 26d | 1 | 0.32mi |
| 10492 Boynton Place Cir Boynton Beach, FL | 1.0–3.0 | 1.0–2.0 | 1017 | $2,311 | $2.27 | 1d | 19 | 0.34mi |
| 10056 Boynton Place Cir Boynton Beach, FL | 3.0 | 2.0 | 1253 | $2,950 | $2.35 | 3d | 1 | 0.36mi |
| 10056 Boynton Place Cir Boynton Beach, FL | 3.0 | 2.0 | 1253 | $3,000 | $2.39 | 26d | 1 | 0.36mi |
| 10187 Mangrove Dr #104 Boynton Beach, FL | 2.0 | 2.0 | 1260 | $2,350 | $1.87 | 26d | 1 | 0.39mi |
| 5373 Mirror Lakes Blvd Boynton Beach, FL | 3.0 | 2.0 | 1310 | $2,100 | $1.60 | 26d | 1 | 0.40mi |
| 5217 Cedar Lake Rd Boynton Beach, FL | 1.0–3.0 | 1.0–2.0 | 1030 | $2,266 | $2.20 | 3d | 51 | 0.54mi |
| 9498 S Military Trl #5 Boynton Beach, FL | 3.0 | 2.5 | 1317 | $2,900 | $2.20 | 26d | 1 | 0.56mi |
| 9565 El Clair Ranch Rd Boynton Beach, FL | 3.0 | 2.0 | 1867 | $3,500 | $1.87 | 22d | 1 | 0.58mi |
| 9565 El Clair Ranch Rd Boynton Beach, FL | 3.0 | 2.0 | 1867 | $3,500 | $1.87 | 9d | 1 | 0.58mi |
| 5020 Ashley Lake Dr Boynton Beach, FL | 2.0 | 2.0 | 1002 | $2,394 | $2.39 | 4d | 1 | 0.60mi |
| 5020 Ashley Lake Dr Boynton Beach, FL | 2.0 | 2.0 | 1002 | $2,346 | $2.34 | 15d | 1 | 0.60mi |
| 5895 Autumn Lake Ln Unit A Boynton Beach, FL | 3.0 | 2.0 | 1469 | $2,600 | $1.77 | 26d | 1 | 0.61mi |
| 9935 Pineapple Tree Dr #202 Boynton Beach, FL | 2.0 | 2.0 | 1008 | $2,575 | $2.55 | 16d | 1 | 0.61mi |
| 9900 Pineapple Tree Dr #106 Boynton Beach, FL | 2.0 | 2.0 | 1008 | $2,250 | $2.23 | 26d | 1 | 0.67mi |
| 4944 Equestrian Cir Unit A Boynton Beach, FL | 2.0 | 2.0 | 1400 | $2,500 | $1.79 | 9d | 1 | 0.68mi |
| 10592 Tropic Palm Ave #202 Boynton Beach, FL | 2.0 | 2.0 | 1385 | $2,450 | $1.77 | 26d | 1 | 0.76mi |
| 6037 Rossmoor Lakes Ct Boynton Beach, FL | 3.0 | 2.0 | 1617 | $4,700 | $2.91 | 26d | 1 | 0.78mi |
| 10624 Tropic Palm Ave #202 Boynton Beach, FL | 3.0 | 2.0 | 1385 | $2,550 | $1.84 | 26d | 1 | 0.79mi |
| 6165 Country Fair Cir Boynton Beach, FL | 3.0 | 2.5 | 1656 | $3,200 | $1.93 | 26d | 1 | 0.80mi |
| 4907 Boxwood Cir Boynton Beach, FL | 3.0 | 2.0 | 1731 | $2,900 | $1.68 | 26d | 1 | 0.87mi |
| 9940 Bauhinia Tree Way Unit B Boynton Beach, FL | 1.0 | 1.0 | 1200 | $1,800 | $1.50 | 9d | 1 | 0.88mi |
| 9940 Bauhinia Tree Way Unit B Boynton Beach, FL | 1.0 | 1.0 | 1200 | $2,000 | $1.67 | 26d | 1 | 0.88mi |
| 9926 Watermill Cir Unit F Boynton Beach, FL | 3.0 | 2.0 | 1471 | $2,400 | $1.63 | 26d | 1 | 0.90mi |
| 4525 Nutmeg Tree Ln Unit A Boynton Beach, FL | 2.0 | 2.0 | 1404 | $3,000 | $2.14 | 26d | 1 | 0.90mi |
| 10596 Sunset Isles Ct Boynton Beach, FL | 3.0 | 2.0 | 1769 | $4,500 | $2.54 | 26d | 1 | 0.91mi |
| 10921 Royal Caribbean Cir Boynton Beach, FL | 3.0 | 2.0 | 1782 | $3,800 | $2.13 | 26d | 1 | 1.07mi |
| 10921 Royal Caribbean Cir Boynton Beach, FL | 3.0 | 2.0 | 1762 | $3,800 | $2.16 | 5d | 1 | 1.07mi |
| 10390 Utopia Cir E Unit E Boynton Beach, FL | 3.0 | 2.0 | 1845 | $4,200 | $2.28 | 4d | 1 | 1.09mi |
| 10390 Utopia Cir E Unit 10390 Boynton Beach, FL | 3.0 | 2.0 | 1845 | $4,200 | $2.28 | 26d | 1 | 1.09mi |
| 4045 White Pine Dr Boynton Beach, FL | 3.0 | 2.0 | 1566 | $1,800 | $1.15 | 3d | 1 | 1.14mi |
| 9336 Water Course Way Boynton Beach, FL | 3.0 | 2.0 | 1779 | $3,600 | $2.02 | 26d | 1 | 1.15mi |
| 9336 Water Course Way Boynton Beach, FL | 3.0 | 2.0 | 1779 | $3,600 | $2.02 | 23d | 1 | 1.15mi |
| 11115 Oakdale Rd Boynton Beach, FL | 3.0 | 2.0 | 1713 | $4,200 | $2.45 | 26d | 1 | 1.26mi |
HOA detail condo
- Monthly dues
- $929 · $11,148/yr
- Likely covers
- watercablepoolsecurity
- Assessments
- None detected in remarks — confirm with the listing agent.
Listing history 50 events
-
2026-06-21days on market $195,000 Active 95 DOM
-
2026-06-18days on market $195,000 Active 92 DOM
-
2026-06-17days on market $195,000 Active 91 DOM
-
2026-06-16days on market $195,000 Active 90 DOM
-
2026-06-15days on market $195,000 Active 89 DOM
-
2026-06-13days on market $195,000 Active 87 DOM
-
2026-06-09days on market $195,000 Active 83 DOM
-
2026-06-08days on market $195,000 Active 82 DOM
-
2026-06-07days on market $195,000 Active 81 DOM
-
2026-06-04days on market $195,000 Active 78 DOM
-
2026-06-03days on market $195,000 Active 77 DOM
-
2026-06-02days on market $195,000 Active 76 DOM
-
2026-06-01days on market $195,000 Active 75 DOM
-
2026-05-31days on market $195,000 Active 74 DOM
-
2026-05-02price $195,000
-
2026-03-28$2,399
-
2026-03-27historical $2,399
-
2026-03-27$2,399
-
2026-03-17$210,000 Active
-
2026-02-09historical $2,399
-
2025-12-12$2,399
-
2018-01-22soldstatus $132,500
-
2017-10-23historical
-
2017-10-16price $135,000
-
2017-09-01$140,000 Active
-
2017-09-01historical
-
2017-08-23price $135,000
-
2017-05-28price $140,000
-
2017-05-04$145,000 Active
-
2016-08-26soldstatus $89,124 Closed
-
2016-07-08status Pending
-
2016-05-02price $104,000
-
2016-04-29$109,900 Active
-
2016-03-03status Pending
-
2016-03-03historical
-
2016-02-02status Active
-
2016-02-01historical
-
2016-01-27status Active
-
2016-01-27historical
-
2015-11-02$109,900 Active
-
2015-10-12status Pending
-
2015-10-12historical
-
2015-10-08status Active
-
2015-10-06historical
-
2015-09-17$109,900 Active
-
2004-12-10soldstatus $180,000
-
2004-12-03soldstatus $180,000
-
2004-10-29historical
-
2004-10-15$189,000
-
2003-07-10soldstatus $127,500
ⓘ Source: listings_history table (triggers on properties + properties_extension) + one-shot
backfill from property_details.listing_events for pre-trigger history.
Tax reassessment forecast FL · Resets to sale price
- Current annual tax
- $3,063 · $255/mo
- Projected year-2 tax
- $3,063 · $255/mo
- Expected delta
- $0/yr ($0/mo · 0.0%)
ⓘ Screening estimate from a state-policy table — verify with the county assessor before closing.
Climate risk First Street
- Flood 1/10 Low FEMA zone X (unshaded) · 0% chance over 30 yrs
- Wildfire 1/10 Low
- Heat 9/10 Extreme 7 d/yr ≥106°F today · 26 d/yr by 30 yrs out
- Wind 10/10 Extreme 99% chance of damaging wind over 30 yrs
- Air quality 2/10 Low 1 unhealthy d/yr today · 2 by 30 yrs out
Nearby sold comps map
Loading sold comps map…
Walkable amenities ~0.75 mi
Loading nearby amenities…
Taxation est. · year 1
- Rental income
- $32,864
- − Mortgage interest
- −$10,923
- − Property taxes
- −$3,063
- − Insurance
- −$975
- − Repairs & maintenance
- −$2,629
- − Management
- −$2,629
- − HOA
- −$11,148
- − Depreciation
- −$5,673
- Taxable loss
- −$4,176
- Est. tax savings @ 24.0%
- +$1,002
- After-tax cash flow
- $-492/yr
For passive investors: Depreciation is non-cash, so a rental often shows a tax loss while cash-flowing — sheltering income. Rental losses are passive: they offset passive income freely, and up to $25,000/yr can offset ordinary (W-2) income if you actively participate and your MAGI is under $100k (phasing out to $0 by $150k); unused losses carry forward. On sale, claimed depreciation is recaptured at up to 25%, and gains may owe capital-gains tax (a 1031 exchange can defer both). Figures are a year-1 estimate at your 24.0% rate — not tax advice; consult a CPA.
Schools (NCES district)
- District
- Palm Beach
- NCES district ID
- 1201500
- Math proficiency
- 46% ▼ -16.00%
- Reading proficiency
- 53% ▼ -4.00%
- Median HH income
- $53,943
- Composite
- 42.72/100
- National rank
- #3160
- State rank
- #34 of 73 in FL
Livability — Golf
- Score
- 63/100
- State rank
- #703
- US rank
- #14941
Category grades
Schools grade is shown separately in the Schools card above.
Census & demographics
- County
- Palm Beach County · 1,438,312 people
- Metro
- Miami-Fort Lauderdale-Pompano Beach, FL
- Population (ZIP)
- 37,229
- Household income
- $80,710
- Rent vs Own
- Severe rent burden
- 902.0
Population outlook (Palm Beach County) Hauer SSP2
- Today (2025)
- 1,637,487 people
- By 2030
- 1,743,255 · +6.5%
- By 2040
- 1,948,712 · +19.0%
- By 2050
- 2,132,979 · +30.3%
- By 2075
- 2,530,027 · +54.5%
- By 2100
- 2,706,979 · +65.3%
Race, ethnicity, and origin ACS 2023
- Neighborhood character
- Predominantly White (68%)
- Race & ethnicity
- White 68% Two or more races 13% Hispanic / Latino 12% Black 10% Asian 3%
- Hispanic origin (detail)
- Mexican 1% Puerto Rican 2% Cuban 1% Dominican 1%
- Common ancestry
- Scotch-Irish 8% Romanian 8% Hispanic 6%
- Foreign-born
- 18% · Canada, Jamaica, Vietnam
- Languages at home
- 78% English-only · Spanish 10% French/Haitian/Cajun 6% Other Indo-European 2%
Political lean MEDSL · Palm Beach
- 2024 margin
- Toss-up / Even · D 50.0% · R 49.2%
- 2008→2024 swing
- -22.1pp toward R · 2008: 22.9pp · 2024: 0.8pp
- All cycles
- 2024: D+0.8 2020: D+12.8 2016: D+15.3 2012: D+17.0 2008: D+22.9
Not yet ingested
- Civics
- —
Market trends
- HPI YoY
- ▼ -0.24%
- Current HPI
- 257.5891
- Rent YoY
- ▲ 1.28%
- Metro
- Miami-Fort Lauderdale-Pompano Beach, FL
- State GDP YoY
- ▲ 3.28%
- F500 in state
- 36
Industry mix (Fortune 500 HQ in FL)
| Industry | F500 HQs | Revenue |
|---|---|---|
| Industrial Technology | 2 | $29B |
|
||
| Insurance | 2 | $17B |
|
||
| Retail | 1 | $60B |
|
||
| Technology Distribution | 1 | $58B |
|
||
| Homebuilding | 1 | $35B |
|
||
| Technology Manufacturing | 1 | $35B |
|
||
Price history
+191.0% since first listed44 events — show timeline
- 2026-05-02 Price Changed $195,000 Beaches MLS
- 2026-03-28 Listed for Rent $2,399 RMLSFL
- 2026-03-27 Rental Removed $2,399 GFLMLS
- 2026-03-27 Listed for Rent $2,399 GFLMLS
- 2026-03-17 Listed $210,000 Beaches MLS
- 2026-02-09 Rental Removed $2,399 GFLMLS
- 2025-12-12 Listed for Rent $2,399 GFLMLS
- 2018-01-22 Sold (Public Records) $132,500 Public Records
- 2017-10-23 Listing Removed — Beaches MLS
- 2017-10-16 Price Changed $135,000 Beaches MLS
- 2017-09-01 Listed $140,000 Beaches MLS
- 2017-09-01 Listing Removed — Beaches MLS
- 2017-08-23 Price Changed $135,000 Beaches MLS
- 2017-05-28 Price Changed $140,000 Beaches MLS
- 2017-05-04 Listed $145,000 Beaches MLS
- 2016-08-26 Sold (MLS) $89,124 Beaches MLS
- 2016-07-08 Pending — Beaches MLS
- 2016-05-02 Price Changed $104,000 Beaches MLS
- 2016-04-29 Listed $109,900 Beaches MLS
- 2016-03-03 Pending — Beaches MLS
- 2016-03-03 Listing Removed — Beaches MLS
- 2016-02-02 Relisted — Beaches MLS
- 2016-02-01 Listing Removed — Beaches MLS
- 2016-01-27 Relisted — Beaches MLS
- 2016-01-27 Listing Removed — Beaches MLS
- 2015-11-02 Listed $109,900 Beaches MLS
- 2015-10-12 Pending — Beaches MLS
- 2015-10-12 Listing Removed — Beaches MLS
- 2015-10-08 Relisted — Beaches MLS
- 2015-10-06 Listing Removed — Beaches MLS
- 2015-09-17 Listed $109,900 Beaches MLS
- 2004-12-10 Sold (Public Records) $180,000 Public Records
- 2004-12-03 Sold (MLS) $180,000 Beaches MLS
- 2004-10-29 Listing Removed — Beaches MLS
- 2004-10-15 Listed $189,000 Beaches MLS
- 2003-07-10 Sold (Public Records) $127,500 Public Records
- 2003-07-08 Sold (MLS) $127,500 Beaches MLS
- 2003-06-12 Listing Removed — Beaches MLS
- 2003-05-24 Listed $145,000 Beaches MLS
- 2002-05-29 Sold (Public Records) $98,500 Public Records
- 2002-05-20 Sold (MLS) $98,500 Beaches MLS
- 2002-04-04 Listing Removed — Beaches MLS
- 2002-03-04 Listed $104,000 Beaches MLS
- 1992-01-03 Sold (Public Records) $67,000 Public Records
Property tax history
+8.0%/yrLatest (2025): $3,063 · +0.0% YoY. Source: county tax records.
Cash-flow waterfall
monthlySold comps — $/sqft
last 12 mo · ≤1 miLoading sold comps…