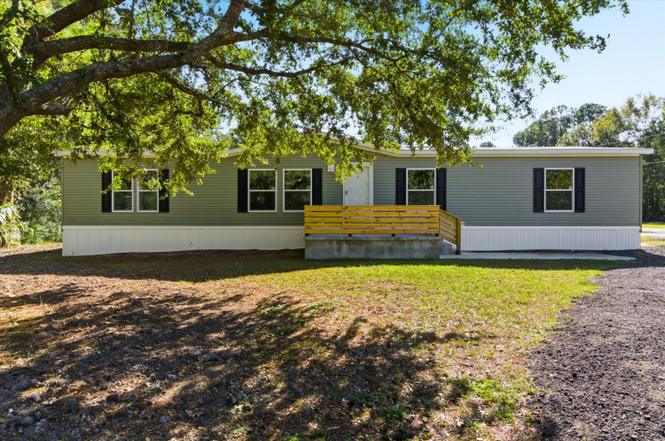
308 Howe Hall Rd · Goose Creek, SC
Flood risk 1/10 · Minimal
- FEMA flood zone
- X (unshaded)
- Chance of flooding over 30 yrs
- 0.0%
- Est. flood insurance / yr
- $507 – $1,088
Fire risk 4/10 · Minor
- Est. fire insurance / yr
- $783 – $1,453
Heat risk 9/10 · Severe
- Hot days now (above 107°F)
- 7 days/yr
- Hot days in 30 yrs
- 17 days/yr
Wind risk 8/10 · Major
- Chance of severe wind over 30 yrs
- 98.0%
Air-quality risk 2/10 · Minimal
- Unhealthy air days now
- 2 days/yr
- Unhealthy air days in 30 yrs
- 2 days/yr
Risk factors via First Street. Map © Google.
Why this score? — see what drove the D- grade
The composite is a weighted blend of 9 inputs, each scored 0–100. Each bar is that input's sub-score; the figure is the points it added to the 100-point composite (weight × sub-score).
- Cash flow +12.2/30.0
- ARV discount +7.5/15.0
- DSCR +3.6/10.0
- Rent growth +3.6/5.0
- Schools +3.6/10.0
- Livability +3.4/5.0
- Condition / age +2.5/5.0
- 1% rule +2.2/10.0
- Appreciation +0.0/10.0
$318,900
🖨 Deal sheet (PDF) 📄 Offer letter ✓ Due diligence
Listing remarks
Don't buy someone else's problems, old plumbing, HVAC, roof, appliances, bad odors. New 4-bedroom home is on a large 1/3 acre lot(14,520 sq ft), and has the option for a 1/2 acre lot(21,780 sq ft). ''NO HOA'' to deal with. Large open floor plan which makes it easy to entertain. Walkin pantry next to kitchen with plenty space for a freezer, plenty of cabinet and counter space to make meal prep a breeze, The big Master bedroom has a very large walk-in closet, plus has a separate garden tub and shower. Includes a energy-efficient insulation of R 38 in the ceiling, R 13 in the walls, and R 22 in floors. The property has a large long driveway for many cars, plus plenty of space for your boat o
Key facts
- Island for hosting
- Walk-in closet
- Large pantry
Tags
Property features AI
Exterior
- Utilities: Public sewer
- Home design: Manufactured/Mobile Home; Single wide; One story; New construction; Subdivision: Howe Hall
- Construction: Architectural roof
- Exterior features: Level lot
Interior
- Kitchen: Electric range; Microwave; Refrigerator
- Bedrooms: 4 bedrooms
- Flooring: Laminate
- Bathrooms: 2 bathrooms
- Heating & cooling: Central heat; Central air
- Interior features: Laminate flooring; Walk-in closet(s)
- Laundry & utility: Laundry room
Neighborhood map
What this means for you Summary
Snapshot
- This is a 4-bed/2.0-bath land listed at $319k.
Deal economics
- At list price, monthly cash flow is $-64 ($-772/yr) — negative.
- To cash-flow at today's rent, offer at most $308k (3.6% below list).
- To meet the 1% rule (rent ≥ 1% of price), the offer needs to be $230k (28.0% below list).
- Recommended offer: $230k (28.0% below list) — sets the bar for 1% rule.
- Cap rate 6.1% vs local median 4.0% in Goose Creek — top-decile yield for the area; either an underpriced asset or a hidden risk that comps aren't pricing in. Stress-test before assuming the spread holds.
Location & tenants
- Location reads 67/100 on livability (#103 in SC) — a middle-class / working-renter tenant base. Strengths: housing A+, employment A, cost of living B+; Watch: amenities F, commute F, health & safety F.
- Berkeley 01 (suburban): math 35% / reading 48% proficiency, ranked #30 of 80 in SC (top 38%) — families likely to look elsewhere, expect single-tenant / working-renter base with shorter leases.
- Zoned schools: Goose Creek Elementary (math 12% / reading 21%, grade F, #535 of 597 statewide, top 90%, 945 students, 100% FRL); Sedgefield Middle (math 13% / reading 26%, grade F, #182 of 229 statewide, top 80%, 986 students, 100% FRL); Goose Creek High (math 33% / reading 68%, grade D+, #150 of 196 statewide, top 76%, 1,981 students, 52% FRL) — zoned schools average 84% FRL vs 48% district-wide (36 pts higher); higher-poverty schools than district average — tighter screening recommended.
- Zoned-school proficiency averages 29% at this address vs 42% district-wide (-13 pts) — the specific schools serving this property underperform the Berkeley 01 average; the district grade overstates school quality for this exact location.
- Market conditions: Rents rising fast (+4.5%/yr); 266 active listings in the ZIP; 10 comparable units currently listed for rent nearby; rentals at typical pace (median 16d on market — plan ~3-4 weeks tenant-placement turnaround); solid renter incomes; 3,183 units permitted in Berkeley County in 2024 (580 in 5+ unit buildings).
- This rent runs 34% of the median local income ($82k/yr) — at the standard rent-burdened threshold; future hikes will face affordability resistance.
Forward outlook
- Local home prices are declining (-3.0%/yr); year-one equity from $2k of loan paydown is wiped out by about $10k of value loss. Plan a longer hold.
- Berkeley County population projected at +48% by 2050 — long-run rental-demand tailwind backs the buy-and-hold thesis.
Negotiation context
- It's been on market 120 days — a 9% lower offer ($290k) is reasonable based on typical stale-listing flexibility.
Risks & watch-outs
- Climate carrying-cost: severe wind risk, 98% chance of damaging wind over 30y; extreme-heat days projected 7→17/yr by 2055 (HVAC capex compounding) — expect insurance premiums to compound above CPI over the hold.
Questions for the listing agent
- What do current leases actually rent for vs. the listed asking? Can we see a recent rent roll and the last 12 months of T-12 income?
- It's been on market 120 days. Have you received any prior offers? Is the seller open to a 28% concession, seller financing, or rate buy-down credit?
- Why hasn't it sold? Are there any deal-killer items the seller is aware of (foundation, flood, title, zoning, code violations)?
- Is there a deadline driving the sale (1031 exchange, divorce, estate, relocation)? That informs how much negotiation room exists.
- The area grade is low — what's the realistic commute time and amenity access for the typical tenant pool here? Any planned neighborhood developments (good or bad) we should know about?
- What's the average days-on-market for RENTAL listings here right now (not sales)? A rising rental-DOM trend means longer vacancies and softer asking-rent achievability than the comps imply.
- What's the recent tenant-quality profile in this submarket — average credit score on applications, eviction rate, late-payment / NSF rate, and stable-employment percentage? A property-management company in the area should have these aggregated.
- How much new for-sale + rental construction is in the pipeline within 1–3 miles? Heavy new supply typically softens prices + rents 12–24 months out; constrained supply supports both.
Investment metrics
- 1% rule
- 0.72% ✗
- Cap rate
- 6.05%
- Cash-on-cash
- -0.86%
- DSCR
- 0.96
- GRM
- 11.6
CMA / ARV
No comps found within radius.
Projected returns pro-forma
-3.0% appreciation · 4.52% rent growth · sell at horizon
- IRR
- -16.3%
- Equity multiple
- 0.41×
- Total profit
- $-52,369
- Equity at exit
- $47,549
- IRR
- -6.0%
- Equity multiple
- 0.59×
- Total profit
- $-36,447
- Equity at exit
- $27,573
Cash invested: $89,292 (down + closing). Projections, not guarantees.
Landlord ↔ Tenant lean methodology
- Overall (STATE)
- 90 Strongly Landlord-Friendly
- State South Carolina
- 90 Strongly Landlord-Friendly · R+6
- County
- — inherits STATE
- City
- — inherits STATE
ZIP-level market 29445
- Home prices YoY
- -18.0%
- Rents YoY
- 4.5%
- Active inventory
- 266
- Price-to-rent
- 11.6×
Monthly cashflow live
- Estimated rent
- $2,298 high interval (Pro) →
- Mortgage (P&I)
- −$1,672
- Tax from tax record
- −$74 /mo · $891/yr
- Insurance
- −$133
- HOA
- −$0
- Vacancy / Maint / Mgmt
- −$483
- Net cashflow
- $-64
Break-even live
Sensitivity live
| Price | -10% $116 | -5% $26 | +0% $-64 | +5% $-155 | +10% $-245 |
|---|---|---|---|---|---|
| Rent | -10% $-246 | -5% $-155 | +0% $-64 | +5% $26 | +10% $117 |
| Rate | -1.0pp $96 | -0.5pp $17 | base $-64 | +0.5pp $-147 | +1.0pp $-231 |
UW: 25.0% down · 7.5% · 30yr · 1.5% tax · 5.0% vac · 8.0% maint · 8.0% mgmt
Financing live
Cash to close
- Down payment
- $79,725
- Closing costs
- $9,567
- Reserves months
- —
- Total cash needed
- —
Loan-product check · same deal, 3 products live
Conventional
25% down · 7.5% · 30yr
- Down + closing
- —
- Monthly P&I
- —
- Monthly cashflow
- —
- DSCR
- —
- Eligible?
- —
Personal DTI + credit; lowest rate.
DSCR
20% down · 8.5% · 30yr
- Down + closing
- —
- Monthly P&I
- —
- Monthly cashflow
- —
- DSCR
- —
- Eligible?
- —
No personal income docs; deal must DSCR.
Hard money
10% down · 12.0% · 12mo
- Down + closing
- —
- Monthly P&I
- —
- Monthly cashflow
- —
- DSCR
- —
- Eligible?
- —
Short-term bridge; refi at stabilization.
Rent comps 10 comps
| Address | Beds | Baths | Sqft | Rent | $/sqft | DOM | Units | Dist |
|---|---|---|---|---|---|---|---|---|
| 467 Truman Dr Goose Creek, SC | 4.0 | 3.5 | 1421 | $2,200 | $1.55 | 5d | 1 | 0.23mi |
| 230 Buchanan Cir Goose Creek, SC | 3.0 | 2.5 | 1512 | $1,900 | $1.26 | 5d | 1 | 0.40mi |
| 139 Rosedale Ave Goose Creek, SC | 3.0 | 2.0 | 1829 | $2,206 | $1.21 | 5d | 1 | 0.79mi |
| 3019 Woodington Pl Goose Creek, SC | 4.0 | 2.5 | 1804 | $2,350 | $1.30 | 5d | 1 | 0.89mi |
| 138 Thistle Rd Goose Creek, SC | 3.0 | 2.5 | 1617 | $2,095 | $1.30 | 23d | 1 | 1.37mi |
| 147 Pinewind Way Goose Creek, SC | 2.0–3.0 | 2.0–2.5 | 1336 | $2,345 | $1.76 | 13d | 1 | 1.44mi |
| 203 Brookshire Rd Goose Creek, SC | 3.0 | 3.0 | 1550 | $2,500 | $1.61 | 16d | 1 | 1.47mi |
| 285 Brookshire Rd Goose Creek, SC | 3.0 | 3.0 | 1450 | $1,900 | $1.31 | 23d | 1 | 1.49mi |
| 285 Brookshire Rd Goose Creek, SC | 3.0 | 3.0 | 1450 | $1,900 | $1.31 | 25d | 1 | 1.49mi |
| 163 Woodward Rd Goose Creek, SC | 3.0 | 3.0 | 1475 | $2,300 | $1.56 | 25d | 1 | 1.50mi |
Listing history 19 events
-
2026-06-21days on market $318,900 Active 120 DOM
-
2026-06-18days on market $318,900 Active 117 DOM
-
2026-06-17days on market $318,900 Active 116 DOM
-
2026-06-16days on market $318,900 Active 115 DOM
-
2026-06-15days on market $318,900 Active 114 DOM
-
2026-06-13days on market $318,900 Active 112 DOM
-
2026-06-13days on market $318,900 Active 111 DOM
-
2026-06-10pricedays on market $318,900 Active 109 DOM
-
2026-06-09days on market $319,900 Active 108 DOM
-
2026-06-08days on market $319,900 Active 107 DOM
-
2026-06-07days on market $319,900 Active 106 DOM
-
2026-06-05days on market $319,900 Active 103 DOM
-
2026-06-03days on market $319,900 Active 102 DOM
-
2026-06-03days on market $319,900 Active 101 DOM
-
2026-06-01days on market $319,900 Active 100 DOM
-
2026-05-31days on market $319,900 Active 99 DOM
-
2026-03-27price $319,900
-
2026-03-23price $328,900
-
2026-02-21$329,000 Active
ⓘ Source: listings_history table (triggers on properties + properties_extension) + one-shot
backfill from property_details.listing_events for pre-trigger history.
Tax reassessment forecast SC · Resets to sale price
- Current annual tax
- $891 · $74/mo
- Projected year-2 tax
- $1,818 · $151/mo
- Expected delta
- +$927/yr (+$77/mo · 104.1%)
ⓘ Screening estimate from a state-policy table — verify with the county assessor before closing.
Climate risk First Street
- Flood 1/10 Low FEMA zone X (unshaded) · 0% chance over 30 yrs
- Wildfire 4/10 Moderate
- Heat 9/10 Extreme 7 d/yr ≥107°F today · 17 d/yr by 30 yrs out
- Wind 8/10 Severe 98% chance of damaging wind over 30 yrs
- Air quality 2/10 Low 2 unhealthy d/yr today · 2 by 30 yrs out
Nearby sold comps map
Loading sold comps map…
Walkable amenities ~0.75 mi
Loading nearby amenities…
Taxation est. · year 1
- Rental income
- $27,572
- − Mortgage interest
- −$17,863
- − Property taxes
- −$891
- − Insurance
- −$1,594
- − Repairs & maintenance
- −$2,206
- − Management
- −$2,206
- − Depreciation
- −$9,277
- Taxable loss
- −$6,465
- Est. tax savings @ 24.0%
- +$1,552
- After-tax cash flow
- $780/yr
For passive investors: Depreciation is non-cash, so a rental often shows a tax loss while cash-flowing — sheltering income. Rental losses are passive: they offset passive income freely, and up to $25,000/yr can offset ordinary (W-2) income if you actively participate and your MAGI is under $100k (phasing out to $0 by $150k); unused losses carry forward. On sale, claimed depreciation is recaptured at up to 25%, and gains may owe capital-gains tax (a 1031 exchange can defer both). Figures are a year-1 estimate at your 24.0% rate — not tax advice; consult a CPA.
Schools (NCES district)
- District
- Berkeley 01
- NCES district ID
- 4501170
- Math proficiency
- 35% ▼ -8.00%
- Reading proficiency
- 48% ▼ -2.00%
- Median HH income
- $52,724
- Composite
- 35.95/100
- National rank
- #4799
- State rank
- #30 of 80 in SC
Livability — Goose Creek
- Score
- 67/100
- State rank
- #103
- US rank
- #10912
Category grades
Schools grade is shown separately in the Schools card above.
Census & demographics
- County
- Berkeley County · 198,768 people
- City population
- 59,227
- Metro
- Charleston-North Charleston, SC
- Population (ZIP)
- 59,227
- Household income
- $81,594
- Rent vs Own
- Severe rent burden
- 1308.0
Population outlook (Berkeley County) Hauer SSP2
- Today (2025)
- 254,184 people
- By 2030
- 279,677 · +10.0%
- By 2040
- 329,379 · +29.6%
- By 2050
- 375,557 · +47.8%
- By 2075
- 476,740 · +87.6%
- By 2100
- 535,945 · +110.8%
Race, ethnicity, and origin ACS 2023
- Neighborhood character
- Diverse neighborhood (Simpson 0.63)
- Race & ethnicity
- White 55% Black 23% Hispanic / Latino 11% Two or more races 9% Asian 3%
- Hispanic origin (detail)
- Mexican 4% Puerto Rican 3%
- Common ancestry
- Slovak 2% Lithuanian 2% Italian 1%
- Foreign-born
- 9% · Canada, Jamaica, Vietnam
- Languages at home
- 86% English-only · Spanish 8% Other Indo-European 2% Tagalog/Filipino 2%
Political lean MEDSL · Berkeley
- 2024 margin
- R (+16.3) · D 41.1% · R 57.4% · Other 1.4%
- 2008→2024 swing
- -3.2pp toward R · 2008: -13.1pp · 2024: -16.3pp
- All cycles
- 2024: R+16.3 2020: R+11.7 2016: R+17.4 2012: R+18.9 2008: R+13.1
Not yet ingested
- Civics
- —
Market trends
- HPI YoY
- ▼ -66.40%
- Current HPI
- 301.8653
- Rent YoY
- ▲ 4.52%
- Metro
- Charleston-North Charleston, SC
- State GDP YoY
- ▲ 4.51%
- F500 in state
- 2
Industry mix (Fortune 500 HQ in SC)
| Industry | F500 HQs | Revenue |
|---|---|---|
| Packaging | 1 | $7B |
|
||
Price history
-2.8% since first listed3 events — show timeline
- 2026-03-27 Price Changed $319,900 Charleston Trident MLS
- 2026-03-23 Price Changed $328,900 Charleston Trident MLS
- 2026-02-21 Listed $329,000 Charleston Trident MLS
Property tax history
+16.8%/yrLatest (2025): $891 · +0.6% YoY. Source: county tax records.
Cash-flow waterfall
monthlySold comps — $/sqft
last 12 mo · ≤1 miLoading sold comps…