401 W 1st St · Erick, OK
Flood risk 1/10 · Minimal
- FEMA flood zone
- —
- Chance of flooding over 30 yrs
- 0.0%
- Est. flood insurance / yr
- —
Fire risk 5/10 · Moderate
- Est. fire insurance / yr
- $2,463 – $4,575
Heat risk 6/10 · Moderate
- Hot days now (above 105°F)
- 7 days/yr
- Hot days in 30 yrs
- 20 days/yr
Wind risk 2/10 · Minimal
- Chance of severe wind over 30 yrs
- 2.0%
Air-quality risk 1/10 · Minimal
- Unhealthy air days now
- 0 days/yr
- Unhealthy air days in 30 yrs
- 0 days/yr
Risk factors via First Street. Map © Google.
Why this score? — see what drove the A- grade
The composite is a weighted blend of 9 inputs, each scored 0–100. Each bar is that input's sub-score; the figure is the points it added to the 100-point composite (weight × sub-score).
- Cash flow +28.2/30.0
- ARV discount +15.0/15.0
- DSCR +10.0/10.0
- 1% rule +7.8/10.0
- Appreciation +7.3/10.0
- Schools +4.8/10.0
- Livability +3.2/5.0
- Rent growth +2.5/5.0
- Condition / age +2.5/5.0
$76,900
🖨 Deal sheet (PDF) 📄 Offer letter ✓ Due diligence
Listing remarks
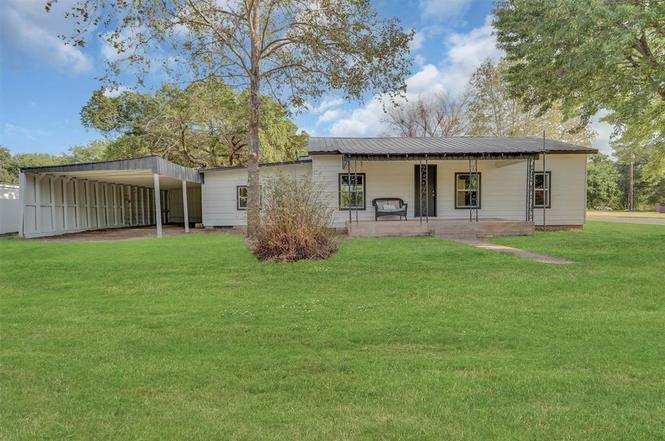
Charming 2-Bedroom Home in Erick, OK – Updated and Move-In Ready! Welcome to this beautifully updated 2-bedroom, 1-bathroom home located in the heart of Erick, Oklahoma. This well-maintained property features a spacious layout with fresh updates throughout, making it perfect for families, first-time buyers, or anyone looking for a cozy, comfortable space to call home. Step inside to find a bright and inviting living area, an updated kitchen with modern finishes, and two bedrooms. The full bathroom has been tastefully remodeled for both style and function. Outside, enjoy a large yard—ideal for entertaining, gardening, or relaxing under the Oklahoma sky. With plenty of outdoor
Key facts
- New plumbing
- Fresh paint
- Remodeled bathroom
Tags
Property features AI
Finance
- Other: Livestock allowed; Located in Brooks addition; Directions: North into Erick on S Sheb Wooley Ave then left on W 1st Street
- Financial info: Loan qualification possible; Property listed as active
- HOA & community: No mandatory association dues
Exterior
- Parking: 2-car garage
- Home design: Single-family residence; One level; Existing property
- Construction: Frame construction; Metal roof; Combination foundation; Built on existing site
- Exterior features: Covered porch; Outbuildings; Interior, rural lot
Interior
- Bedrooms: 2 bedrooms
- Bathrooms: 1 full bathroom
- Heating & cooling: Electric heating
- Interior features: One living area; No fireplace; Storm shelter; Homestead eligible
Neighborhood map
What this means for you Summary
Snapshot
- This is a 3-bed/1.0-bath single-family listed at $77k.
Deal economics
- At list price, monthly cash flow is $243 ($3k/yr) — positive.
- The deal already cash-flows at list — no discount required.
- Meets the 1% rule at list price ($981 rent vs $77k).
- Recommended offer: $68k (12.0% below list) — sets the bar for market timing.
Location & tenants
- Location reads 63/100 on livability (#218 in OK) — a middle-class / working-renter tenant base. Strengths: cost of living A+, crime B+, housing B+; Watch: amenities F, commute F, employment F.
- Erick (rural): math 50% / reading 60% proficiency, ranked #19 of 513 in OK (top 4%) — acceptable for families but not a draw, mixed tenant base, ~2y average lease.
- Zoned schools: Erick Es (math 52% / reading 57%, grade C, #23 of 845 statewide, top 3%, 152 students, 0% FRL); Erick Hs (math 24% / reading 24%, grade F, #150 of 447 statewide, top 48%, 57 students, 0% FRL) — zoned schools average 0% FRL vs 44% district-wide (44 pts lower); this property's tenant base skews higher-income than the district average.
- Zoned-school proficiency averages 40% at this address vs 55% district-wide (-16 pts) — the specific schools serving this property underperform the Erick average; the district grade overstates school quality for this exact location.
- Market conditions: 19 active listings in the ZIP; 16 units permitted in Beckham County in 2024 (0 in 5+ unit buildings).
Forward outlook
- In year one you build about $4k of equity ($532 loan paydown + $4k appreciation (4.6% local appreciation)).
- Beckham County population projected at +35% by 2050 — long-run rental-demand tailwind backs the buy-and-hold thesis.
- At projected returns (4.6% appreciation + 3.0% rent growth), your $22k cash investment doubles in ~3 years — after that, you're playing with house money.
- By year 8, paydown + projected appreciation supports a ~$30k cash-out refi (75% LTV) — recoverable capital for the next deal without selling this one.
Negotiation context
- It's been on market 298 days — a 12% lower offer ($68k) is reasonable based on typical stale-listing flexibility.
- 3 sale attempts; this cycle's ask has dropped $20k (21%) from the opening price — seller is motivated, your offer sets the floor, not the list.
- Current owner paid $8k; list at $77k implies a 805% gain — meaningful room to come down on a strong offer.
Risks & watch-outs
- Watch-outs: built in 1935 — expect roof / HVAC / electrical / plumbing capex.
Questions for the listing agent
- It's been on market 298 days. Have you received any prior offers? Is the seller open to a 12% concession, seller financing, or rate buy-down credit?
- Built in 1935 — when were the roof, HVAC, electrical panel, plumbing, and water heater last replaced?
- Why hasn't it sold? Are there any deal-killer items the seller is aware of (foundation, flood, title, zoning, code violations)?
- Is there a deadline driving the sale (1031 exchange, divorce, estate, relocation)? That informs how much negotiation room exists.
- What's the average days-on-market for RENTAL listings here right now (not sales)? A rising rental-DOM trend means longer vacancies and softer asking-rent achievability than the comps imply.
- What's the recent tenant-quality profile in this submarket — average credit score on applications, eviction rate, late-payment / NSF rate, and stable-employment percentage? A property-management company in the area should have these aggregated.
- How much new for-sale + rental construction is in the pipeline within 1–3 miles? Heavy new supply typically softens prices + rents 12–24 months out; constrained supply supports both.
Investment metrics
- 1% rule
- 1.28% ✓
- Cap rate
- 10.09%
- Cash-on-cash
- 13.55%
- DSCR
- 1.60
- GRM
- 6.5
CMA / ARV
- ARV (on-the-fly)
- $110,580
- Comps found
- 2
Show comp detail 2 sales within ~0.75 mi
| Address | Dist | Beds/Ba | Sqft | Sold | Price | $/sf | Match |
|---|---|---|---|---|---|---|---|
| 311 N Walnut St | 0.20mi | 3/2.0 | 1,160 (-0%) | 21mo | $110,000 | $95 | 68 |
| 104 S Cedar Ave | 0.26mi | 2/2.0 (-1) | 1,104 (-5%) | 23mo | $38,000 | $34 | 51 |
Match score weights: distance 35% · size 25% · config 20% · recency 20%. Top-matched comps best support the ARV.
Projected returns pro-forma
4.57% appreciation · 3.0% rent growth · sell at horizon
- IRR
- 23.7%
- Equity multiple
- 2.46×
- Total profit
- $31,368
- Equity at exit
- $41,600
- IRR
- 23.3%
- Equity multiple
- 4.83×
- Total profit
- $82,403
- Equity at exit
- $70,212
Cash invested: $21,532 (down + closing). Projections, not guarantees.
Landlord ↔ Tenant lean methodology
- Overall (STATE)
- 83 Strongly Landlord-Friendly
- State Oklahoma
- 83 Strongly Landlord-Friendly · R+20
- County
- — inherits STATE
- City
- — inherits STATE
ZIP-level market 73645
- Home prices YoY
- 4.4%
- Active inventory
- 19
- Price-to-rent
- 6.5×
Monthly cashflow live
- Estimated rent
- $981 medium interval (Pro) →
- Mortgage (P&I)
- −$403
- Tax est. 1.5%
- −$96 /mo · $1,154/yr
- Insurance
- −$32
- HOA
- −$0
- Vacancy / Maint / Mgmt
- −$206
- Net cashflow
- $243
Break-even live
Sensitivity live
| Price | -10% $296 | -5% $270 | +0% $243 | +5% $217 | +10% $190 |
|---|---|---|---|---|---|
| Rent | -10% $166 | -5% $204 | +0% $243 | +5% $282 | +10% $321 |
| Rate | -1.0pp $282 | -0.5pp $263 | base $243 | +0.5pp $223 | +1.0pp $203 |
UW: 25.0% down · 7.5% · 30yr · 1.5% tax · 5.0% vac · 8.0% maint · 8.0% mgmt
Financing live
Cash to close
- Down payment
- $19,225
- Closing costs
- $2,307
- Reserves months
- —
- Total cash needed
- —
Loan-product check · same deal, 3 products live
Conventional
25% down · 7.5% · 30yr
- Down + closing
- —
- Monthly P&I
- —
- Monthly cashflow
- —
- DSCR
- —
- Eligible?
- —
Personal DTI + credit; lowest rate.
DSCR
20% down · 8.5% · 30yr
- Down + closing
- —
- Monthly P&I
- —
- Monthly cashflow
- —
- DSCR
- —
- Eligible?
- —
No personal income docs; deal must DSCR.
Hard money
10% down · 12.0% · 12mo
- Down + closing
- —
- Monthly P&I
- —
- Monthly cashflow
- —
- DSCR
- —
- Eligible?
- —
Short-term bridge; refi at stabilization.
Listing history 16 events
-
2026-06-21days on market $76,900 Active 298 DOM
-
2026-06-21days on market $76,900 Active 297 DOM
-
2026-06-18days on market $76,900 Active 295 DOM
-
2026-06-17days on market $76,900 Active 294 DOM
-
2026-06-16days on market $76,900 Active 293 DOM
-
2026-06-15days on market $76,900 Active 292 DOM
-
2026-06-13days on market $76,900 Active 290 DOM
-
2026-06-12days on market $76,900 Active 289 DOM
-
2026-06-09days on market $76,900 Active 286 DOM
-
2026-06-08days on market $76,900 Active 285 DOM
-
2026-06-08days on market $76,900 Active 284 DOM
-
2026-06-07days on market $76,900 Active 283 DOM
-
2026-06-04days on market $76,900 Active 280 DOM
-
2026-06-02days on market $76,900 Active 279 DOM
-
2026-06-01days on market $76,900 Active 278 DOM
-
2026-05-31days on market $76,900 Active 277 DOM
ⓘ Source: listings_history table (triggers on properties + properties_extension) + one-shot
backfill from property_details.listing_events for pre-trigger history.
Climate risk First Street
- Flood 1/10 Low 0% chance over 30 yrs
- Wildfire 5/10 Major
- Heat 6/10 Major 7 d/yr ≥105°F today · 20 d/yr by 30 yrs out
- Wind 2/10 Low 2% chance of damaging wind over 30 yrs
- Air quality 1/10 Low 0 unhealthy d/yr today · 0 by 30 yrs out
Nearby sold comps map
Loading sold comps map…
Walkable amenities ~0.75 mi
Loading nearby amenities…
Taxation est. · year 1
- Rental income
- $11,766
- − Mortgage interest
- −$4,308
- − Property taxes
- −$1,154
- − Insurance
- −$384
- − Repairs & maintenance
- −$941
- − Management
- −$941
- − Depreciation
- −$2,237
- Taxable income
- $1,801
- Est. tax owed @ 24.0%
- −$432
- After-tax cash flow
- $2,486/yr
For passive investors: Depreciation is non-cash, so a rental often shows a tax loss while cash-flowing — sheltering income. Rental losses are passive: they offset passive income freely, and up to $25,000/yr can offset ordinary (W-2) income if you actively participate and your MAGI is under $100k (phasing out to $0 by $150k); unused losses carry forward. On sale, claimed depreciation is recaptured at up to 25%, and gains may owe capital-gains tax (a 1031 exchange can defer both). Figures are a year-1 estimate at your 24.0% rate — not tax advice; consult a CPA.
Schools (NCES district)
- District
- Erick
- NCES district ID
- 4011040
- Math proficiency
- 50% ▲ 5.00%
- Reading proficiency
- 60% ▲ 5.00%
- Median HH income
- $39,189
- Composite
- 47.69/100
- National rank
- #4918
- State rank
- #19 of 513 in OK
Livability — Erick
- Score
- 63/100
- State rank
- #218
- US rank
- #15619
Category grades
Schools grade is shown separately in the Schools card above.
Census & demographics
- Census place
- Erick, OK
- Population (ZIP)
- 1,090
Population outlook (Beckham County) Hauer SSP2
- Today (2025)
- 26,564 people
- By 2030
- 28,217 · +6.2%
- By 2040
- 31,865 · +20.0%
- By 2050
- 35,862 · +35.0%
- By 2075
- 47,189 · +77.6%
- By 2100
- 55,622 · +109.4%
Race, ethnicity, and origin ACS 2023
- Neighborhood character
- Predominantly White (77%)
- Race & ethnicity
- White 77% Hispanic / Latino 12% Two or more races 10% Native American 1%
- Hispanic origin (detail)
- Mexican 12%
- Common ancestry
- Italian 5% Lithuanian 3% Slovak 1%
- Languages at home
- 96% English-only · Spanish 3%
Political lean MEDSL · Beckham
- 2024 margin
- Solid R (+70.1) · D 14.2% · R 84.3% · Other 1.4%
- 2008→2024 swing
- -14.0pp toward R · 2008: -56.1pp · 2024: -70.1pp
- All cycles
- 2024: R+70.1 2020: R+72.0 2016: R+70.8 2012: R+59.1 2008: R+56.1
Not yet ingested
- Civics
- —
Market trends
- HPI YoY
- ▲ 4.57%
- Current HPI
- 108.667
- Rent YoY
- —
- Metro
- —
- State GDP YoY
- ▲ 1.55%
- F500 in state
- 6
Industry mix (Fortune 500 HQ in OK)
| Industry | F500 HQs | Revenue |
|---|---|---|
| Energy | 3 | $48B |
|
||
Price history
+804.7% since first listed7 events — show timeline
- 2026-05-28 Relisted — MLSOK
- 2026-03-14 Relisted — MLSOK
- 2026-03-12 Pending — MLSOK
- 2026-02-26 Price Changed $76,900 MLSOK
- 2025-09-10 Price Changed $86,900 MLSOK
- 2025-08-13 Listed $96,900 MLSOK
- 2011-07-29 Sold (Public Records) $8,500 Public Records
Property tax history
+5.1%/yrLatest (2025): $117 · +5.4% YoY. Source: county tax records.
Cash-flow waterfall
monthlySold comps — $/sqft
last 12 mo · ≤1 miLoading sold comps…