4525 1st Ave. Ave SW #10 · Cedar Rapids, IA
Flood risk 1/10 · Minimal
- FEMA flood zone
- X (unshaded)
- Chance of flooding over 30 yrs
- 0.0%
- Est. flood insurance / yr
- $507 – $1,088
Fire risk 1/10 · Minimal
- Est. fire insurance / yr
- $902 – $1,676
Heat risk 3/10 · Minor
- Hot days now (above 103°F)
- 7 days/yr
- Hot days in 30 yrs
- 15 days/yr
Wind risk 2/10 · Minimal
- Chance of severe wind over 30 yrs
- —
Air-quality risk 2/10 · Minimal
- Unhealthy air days now
- 0 days/yr
- Unhealthy air days in 30 yrs
- 1 days/yr
Risk factors via First Street. Map © Google.
Why this score? — see what drove the D grade
The composite is a weighted blend of 9 inputs, each scored 0–100. Each bar is that input's sub-score; the figure is the points it added to the 100-point composite (weight × sub-score).
- Cash flow +10.2/30.0
- ARV discount +7.5/15.0
- 1% rule +5.3/10.0
- Rent growth +4.7/5.0
- Schools +4.7/10.0
- Livability +3.9/5.0
- DSCR +2.9/10.0
- Condition / age +2.5/5.0
- Appreciation +0.0/10.0
$104,900
🖨 Deal sheet (PDF) 📄 Offer letter ✓ Due diligence
Listing remarks MLS
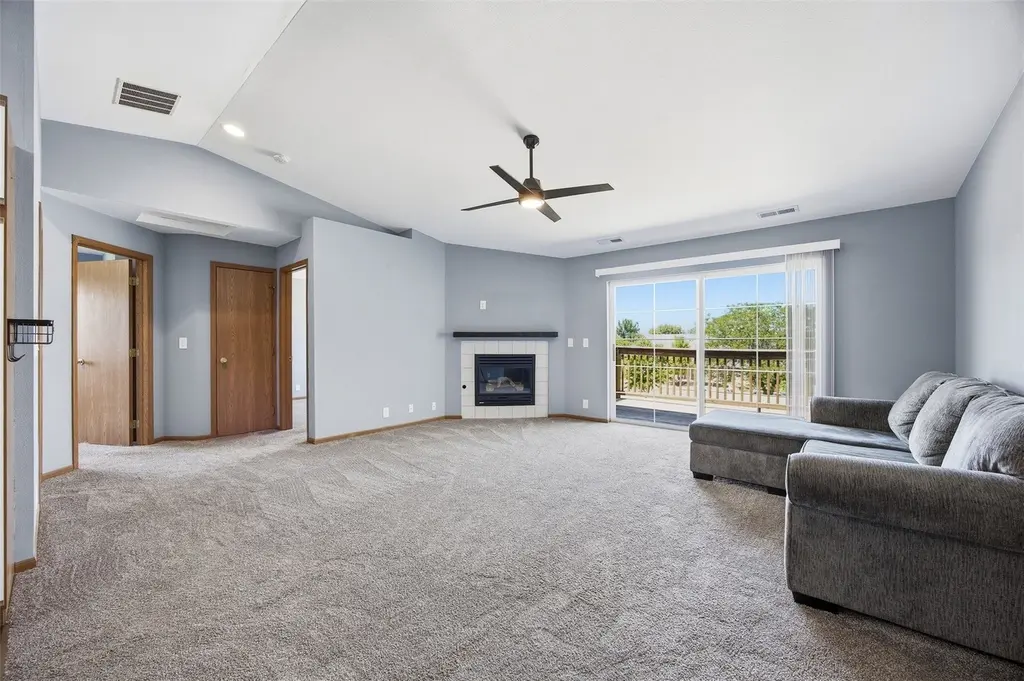
WHY RENT WHEN YOU CAN OWN! BUILD EQUITY, GET PROPERTY TAX BENFITS, AND OWN THE AMERICAN DREAM. .. This condo was lovingly lived in and maintained by the owner for over 16 years. (It was not a rental). The many features that the new owner will enjoy is the cathedral/vaulted ceilings to give the feel of open spaces with more daylight, that only a 3rd floor condo can provide. The living room includes a built in gas fireplace and large sliding doors to lead out to your own private deck. The many updates also include: brand new carpet and paint througout. New kitchen & bathroom flooring (2020). Newer washer and dryer are included. Brand new water heater with drip pan (for extra peace of mind). Newer kitchen faucet and sprayer. Newer bathroom faucet. New roof & insulation (both building and garage!). 1 stall garage directly across from the front door is included and has built in shelving that stays. The building is secure and includes an intercom system. Third Floor condos tend to be very popular for the vaulted ceilings and the no people living above you. .. so don't miss out on owning this lovingly maintained, owner occupied, condo.
Key facts
- Modern ceiling fans
- Matte black fixtures
- Updated sink
Tags
Property features AI
Finance
- HOA & community: Homeowners association with a $185 monthly fee
Exterior
- Parking: Detached garage with garage door opener (1 garage space); Off-street parking
- Utilities: Public water; Public sewer
- Home design: Condominium (residential); Frame construction with vinyl siding
- Construction: Has home warranty
- Exterior features: Deck
Interior
- Kitchen: Dishwasher; Range; Microwave; Refrigerator; Gas water heater
- Bathrooms: One full bathroom
- Heating & cooling: Central air conditioning; Forced air heating
- Interior features: Vaulted ceilings; Gas fireplace in the living room
- Laundry & utility: Washer; Dryer; Intercom
Neighborhood map
What this means for you Summary
Snapshot
- This is a 2-bed/1.0-bath condo listed at $105k.
Deal economics
- At list price, monthly cash flow is $-59 ($-708/yr) — negative.
- To cash-flow at today's rent, offer at most $94k (9.9% below list).
- Meets the 1% rule at list price ($1k rent vs $105k).
- Recommended offer: $94k (9.9% below list) — sets the bar for cash-flow.
- Cap rate 5.6% vs local median 3.5% in Cedar Rapids — top-decile yield for the area; either an underpriced asset or a hidden risk that comps aren't pricing in. Stress-test before assuming the spread holds.
Location & tenants
- Location reads 78/100 on livability (#134 in IA, #2,474 nationally) — a middle-class / working-renter tenant base. Strengths: cost of living A+, housing A+, health & safety A+; Watch: crime C-, commute F.
- Cedar Rapids Community School District (urban): math 50% / reading 59% proficiency, ranked #265 of 289 in IA (top 92%) — acceptable for families but not a draw, mixed tenant base, ~2y average lease.
- Zoned schools: Hoover Elementary School (math 37% / reading 42%, grade F, #579 of 616 statewide, top 95%, 387 students, 80% FRL); Roosevelt Creative Corridor Business Academy (math 36% / reading 47%, grade F, #235 of 246 statewide, top 96%, 510 students, 69% FRL); Thomas Jefferson High School (math 41% / reading 62%, grade D+, #307 of 336 statewide, top 91%, 1,543 students, 56% FRL) — zoned schools average 68% FRL vs 43% district-wide (25 pts higher); higher-poverty schools than district average — tighter screening recommended.
- Market conditions: Rents rising fast (+8.8%/yr); 419 active listings in the ZIP; 3 comparable units currently listed for rent nearby; rentals at typical pace (median 15d on market — plan ~3-4 weeks tenant-placement turnaround); 1,023 units permitted in Linn County in 2024 (456 in 5+ unit buildings).
Forward outlook
- Local home prices are declining (-3.0%/yr); year-one equity from $725 of loan paydown is wiped out by about $3k of value loss. Plan a longer hold.
- Linn County population projected at +16% by 2050 — long-run rental-demand tailwind backs the buy-and-hold thesis.
Negotiation context
- Only 5 days on market — expect competitive offers; lowballing is unlikely to land.
- 2 sale attempts since 3y ago with the ask held roughly flat each time — persistent listings suggest the price (not the market) is what's stuck; bring a comps-based counter.
Questions for the listing agent
- What do current leases actually rent for vs. the listed asking? Can we see a recent rent roll and the last 12 months of T-12 income?
- What does the HOA fee cover, when was the last increase, and are there any pending special assessments or reserve-fund shortfalls?
- Any open or pending special assessments — roof, HVAC, plumbing, elevator, façade? What's the per-unit balance and payoff schedule, and is the seller paying it off at close or rolling it to the buyer?
- Is there a deadline driving the sale (1031 exchange, divorce, estate, relocation)? That informs how much negotiation room exists.
- Schools are B-rated — typically a magnet for longer-tenancy family renters. What's the average tenant stay here, and is there a school-zone premium baked into asking?
- The area grade is low — what's the realistic commute time and amenity access for the typical tenant pool here? Any planned neighborhood developments (good or bad) we should know about?
- What's the average days-on-market for RENTAL listings here right now (not sales)? A rising rental-DOM trend means longer vacancies and softer asking-rent achievability than the comps imply.
- What's the recent tenant-quality profile in this submarket — average credit score on applications, eviction rate, late-payment / NSF rate, and stable-employment percentage? A property-management company in the area should have these aggregated.
- How much new apartment / multifamily construction is in the pipeline within 1–3 miles? Heavy new supply (>2% of stock underway) typically softens rents 12–24 months out; light construction supports rent growth.
Investment metrics
- 1% rule
- 1.03% ✓
- Cap rate
- 5.62%
- Cash-on-cash
- -2.41%
- DSCR
- 0.89
- GRM
- 8.1
CMA / ARV
No comps found within radius.
Projected returns pro-forma
-3.0% appreciation · 8.0% rent growth · sell at horizon
- IRR
- -13.3%
- Equity multiple
- 0.49×
- Total profit
- $-14,905
- Equity at exit
- $15,641
- IRR
- 3.2%
- Equity multiple
- 1.30×
- Total profit
- $8,751
- Equity at exit
- $9,070
Cash invested: $29,372 (down + closing). Projections, not guarantees.
Landlord ↔ Tenant lean methodology
- Overall (STATE)
- 83 Strongly Landlord-Friendly
- State Iowa
- 83 Strongly Landlord-Friendly · R+6
- County
- — inherits STATE
- City
- — inherits STATE
ZIP-level market 52404
- Rents YoY
- 8.8%
- Active inventory
- 419
- Price-to-rent
- 8.1×
Monthly cashflow live
- Estimated rent
- $1,082 medium interval (Pro) →
- Mortgage (P&I)
- −$550
- Tax from tax record
- −$135 /mo · $1,622/yr
- Insurance
- −$44
- HOA
- −$185
- Vacancy / Maint / Mgmt
- −$227
- Net cashflow
- $-59
Break-even live
Sensitivity live
| Price | -10% $0 | -5% $-29 | +0% $-59 | +5% $-89 | +10% $-118 |
|---|---|---|---|---|---|
| Rent | -10% $-145 | -5% $-102 | +0% $-59 | +5% $-16 | +10% $26 |
| Rate | -1.0pp $-6 | -0.5pp $-32 | base $-59 | +0.5pp $-86 | +1.0pp $-114 |
UW: 25.0% down · 7.5% · 30yr · 1.5% tax · 5.0% vac · 8.0% maint · 8.0% mgmt
Financing live
Cash to close
- Down payment
- $26,225
- Closing costs
- $3,147
- Reserves months
- —
- Total cash needed
- —
Loan-product check · same deal, 3 products live
Conventional
25% down · 7.5% · 30yr
- Down + closing
- —
- Monthly P&I
- —
- Monthly cashflow
- —
- DSCR
- —
- Eligible?
- —
Personal DTI + credit; lowest rate.
DSCR
20% down · 8.5% · 30yr
- Down + closing
- —
- Monthly P&I
- —
- Monthly cashflow
- —
- DSCR
- —
- Eligible?
- —
No personal income docs; deal must DSCR.
Hard money
10% down · 12.0% · 12mo
- Down + closing
- —
- Monthly P&I
- —
- Monthly cashflow
- —
- DSCR
- —
- Eligible?
- —
Short-term bridge; refi at stabilization.
Rent comps 3 comps
| Address | Beds | Baths | Sqft | Rent | $/sqft | DOM | Units | Dist |
|---|---|---|---|---|---|---|---|---|
| 1225 Jacolyn Dr SW Unit 215 Cedar Rapids, IA | 2.0 | 2.0 | 870 | $1,025 | $1.18 | 45d | 1 | 0.08mi |
| 2100 Westdale Dr SW Cedar Rapids, IA | 1.0–2.0 | 1.0 | 696 | $895 | $1.29 | 15d | 11 | 0.58mi |
| 5830 Greenbriar Ln SW Cedar Rapids, IA | 1.0–2.0 | 1.0 | 832 | $1,400 | $1.68 | 15d | 2 | 1.05mi |
HOA detail condo
- Monthly dues
- $185 · $2,220/yr
- Likely covers
- watergas
- Assessments
- None detected in remarks — confirm with the listing agent.
Listing history 6 events
-
2026-06-13status $104,900 Pending 5 DOM
-
2026-06-10days on market $104,900 Active 5 DOM
-
2026-06-09days on market $104,900 Active 4 DOM
-
2026-06-08days on market $104,900 Active 3 DOM
-
2026-06-07remarks 693-char remark
-
2026-06-07$104,900 Active 2 DOM
ⓘ Source: listings_history table (triggers on properties + properties_extension) + one-shot
backfill from property_details.listing_events for pre-trigger history.
Tax reassessment forecast IA · Partial reset (capped growth)
- Current annual tax
- $1,622 · $135/mo
- Projected year-2 tax
- $1,634 · $136/mo
- Expected delta
- +$12/yr (+$1/mo · 0.8%)
ⓘ Screening estimate from a state-policy table — verify with the county assessor before closing.
Climate risk First Street
- Flood 1/10 Low FEMA zone X (unshaded) · 0% chance over 30 yrs
- Wildfire 1/10 Low
- Heat 3/10 Moderate 7 d/yr ≥103°F today · 15 d/yr by 30 yrs out
- Wind 2/10 Low
- Air quality 2/10 Low 0 unhealthy d/yr today · 1 by 30 yrs out
Nearby sold comps map
Loading sold comps map…
Walkable amenities ~0.75 mi
Loading nearby amenities…
Taxation est. · year 1
- Rental income
- $12,987
- − Mortgage interest
- −$5,876
- − Property taxes
- −$1,622
- − Insurance
- −$524
- − Repairs & maintenance
- −$1,039
- − Management
- −$1,039
- − HOA
- −$2,220
- − Depreciation
- −$3,052
- Taxable loss
- −$2,385
- Est. tax savings @ 24.0%
- +$572
- After-tax cash flow
- $-136/yr
For passive investors: Depreciation is non-cash, so a rental often shows a tax loss while cash-flowing — sheltering income. Rental losses are passive: they offset passive income freely, and up to $25,000/yr can offset ordinary (W-2) income if you actively participate and your MAGI is under $100k (phasing out to $0 by $150k); unused losses carry forward. On sale, claimed depreciation is recaptured at up to 25%, and gains may owe capital-gains tax (a 1031 exchange can defer both). Figures are a year-1 estimate at your 24.0% rate — not tax advice; consult a CPA.
Schools (NCES district)
- District
- Cedar Rapids Community School District
- NCES district ID
- 1906540
- Math proficiency
- 50% ▼ -12.00%
- Reading proficiency
- 59% ▼ -6.00%
- Median HH income
- $53,568
- Composite
- 46.82/100
- National rank
- #2378
- State rank
- #265 of 289 in IA
Livability — Cedar Rapids
- Score
- 78/100
- State rank
- #134
- US rank
- #2474
Category grades
Schools grade is shown separately in the Schools card above.
Census & demographics
- Census place
- Cedar Rapids, IA
- County
- Linn County · 179,860 people
- City population
- 137,154
- Metro
- Cedar Rapids, IA
- Population (ZIP)
- 42,958
- Household income
- $61,870
- Rent vs Own
- Severe rent burden
- 1041.0
Population outlook (Linn County) Hauer SSP2
- Today (2025)
- 239,589 people
- By 2030
- 248,587 · +3.8%
- By 2040
- 264,817 · +10.5%
- By 2050
- 278,685 · +16.3%
- By 2075
- 311,754 · +30.1%
- By 2100
- 336,773 · +40.6%
Race, ethnicity, and origin ACS 2023
- Neighborhood character
- Predominantly White (74%)
- Race & ethnicity
- White 74% Black 10% Two or more races 10% Hispanic / Latino 7%
- Hispanic origin (detail)
- Mexican 5%
- Common ancestry
- Portuguese 3% Lithuanian 2% Romanian 2%
- Foreign-born
- 8% · Canada
- Languages at home
- 90% English-only · Spanish 3% French/Haitian/Cajun 2% Other Asian/Pacific 1%
Political lean MEDSL · Linn
- 2024 margin
- Lean D (+9.9) · D 54.2% · R 44.3% · Other 1.4%
- 2008→2024 swing
- -11.6pp toward R · 2008: 21.5pp · 2024: 9.9pp
- All cycles
- 2024: D+9.9 2020: D+13.7 2016: D+9.0 2012: D+17.6 2008: D+21.5
Not yet ingested
- Civics
- —
Market trends
- HPI YoY
- ▼ -154.96%
- Current HPI
- 241.81
- Rent YoY
- ▲ 8.79%
- Metro
- Cedar Rapids, IA
- State GDP YoY
- ▲ 2.48%
- F500 in state
- 4
Industry mix (Fortune 500 HQ in IA)
| Industry | F500 HQs | Revenue |
|---|---|---|
| Financial Services | 1 | $16B |
|
||
| Retail / Convenience | 1 | $15B |
|
||
Price history
+56.6% since first listed5 events — show timeline
- 2026-06-05 Listed $104,900 CRAAR, CDRMLS
- 2024-01-04 Sold (Public Records) $97,000 Public Records
- 2023-12-29 Sold (MLS) $97,000 CRAAR, CDRMLS
- 2023-11-08 Listed $99,500 CRAAR, CDRMLS
- 2007-06-26 Sold (Public Records) $67,000 Public Records
Property tax history
+2.8%/yrLatest (2025): $1,622 · +16.0% YoY. Source: county tax records.
Cash-flow waterfall
monthlySold comps — $/sqft
last 12 mo · ≤1 miLoading sold comps…