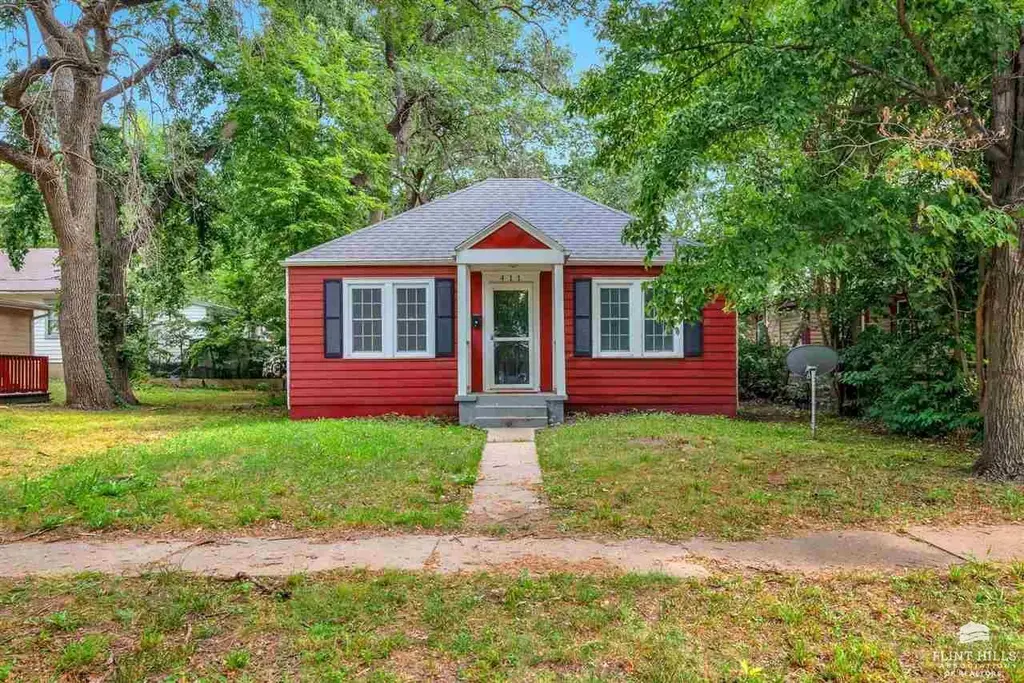
411 W 4th St · Junction City, KS
Flood risk 1/10 · Minimal
- FEMA flood zone
- X (unshaded)
- Chance of flooding over 30 yrs
- 0.0%
- Est. flood insurance / yr
- $507 – $1,088
Fire risk 5/10 · Moderate
- Est. fire insurance / yr
- $1,154 – $2,142
Heat risk 4/10 · Minor
- Hot days now (above 107°F)
- 7 days/yr
- Hot days in 30 yrs
- 16 days/yr
Wind risk 2/10 · Minimal
- Chance of severe wind over 30 yrs
- —
Air-quality risk 3/10 · Minor
- Unhealthy air days now
- 2 days/yr
- Unhealthy air days in 30 yrs
- 3 days/yr
Risk factors via First Street. Map © Google.
Why this score? — see what drove the C+ grade
The composite is a weighted blend of 9 inputs, each scored 0–100. Each bar is that input's sub-score; the figure is the points it added to the 100-point composite (weight × sub-score).
- Cash flow +25.1/30.0
- DSCR +8.2/10.0
- ARV discount +7.5/15.0
- 1% rule +6.6/10.0
- Rent growth +4.0/5.0
- Livability +3.3/5.0
- Schools +3.0/10.0
- Condition / age +2.5/5.0
- Appreciation +0.0/10.0
$100,000
🖨 Deal sheet 📄 Offer letter ✓ Due diligence
Listing remarks MLS
Another spectacular listing brought to you by Kyrsten Ross (785)307-3977 with RE/MAX Signature Properties (785)579-5300. This adorable 2 bedroom/1 bath home is ready for you! This quaint home has been remodeled top to bottom in recent years with new roof, HVAC, flooring, kitchen, and windows. Don't miss your opportunity to view this lovely home, call/text Kyrsten (785)307-3977 today to view this home or any others in the area!!
Key facts
- Move-in-ready
- Newer roof
- Hvac system
Tags
Neighborhood map
What this means for you Summary
Snapshot
- This is a 2-bed/1.0-bath single-family listed at $100k.
Deal economics
- At list price, monthly cash flow is $220 ($3k/yr) — positive.
- The deal already cash-flows at list — no discount required.
- Meets the 1% rule at list price ($1k rent vs $100k).
Location & tenants
- Location reads 66/100 on livability (#266 in KS) — a middle-class / working-renter tenant base. Strengths: cost of living A+, housing A+, health & safety A+; Watch: schools D+, crime F, amenities F.
- Geary County Schools (town): math 32% / reading 39% proficiency, ranked #60 of 169 in KS (top 36%) — families likely to look elsewhere, expect single-tenant / working-renter base with shorter leases.
- Market conditions: Rents rising fast (+6.0%/yr); 260 active listings in the ZIP; 93 units permitted in Geary County in 2024 (0 in 5+ unit buildings).
Forward outlook
- Local home prices are declining (-3.0%/yr); year-one equity from $691 of loan paydown is wiped out by about $3k of value loss. Plan a longer hold.
- Geary County population projected at +8% by 2050 — modest demand growth; plan on rents tracking national, not racing it.
- At projected returns (-3.0% appreciation + 6.0% rent growth), your $28k cash investment doubles in ~9 years — after that, you're playing with house money.
Negotiation context
- Only 10 days on market — expect competitive offers; lowballing is unlikely to land.
- 2 sale attempts since 7y ago; this cycle's ask is 10711% above the opening price — seller raised mid-cycle; expect resistance to lowballs.
- Current owner paid $24k; list at $100k implies a 326% gain — meaningful room to come down on a strong offer.
Risks & watch-outs
- Watch-outs: built in 1950 — expect roof / HVAC / electrical / plumbing capex.
- Climate carrying-cost: moderate wildfire risk — expect insurance premiums to compound above CPI over the hold.
Questions for the listing agent
- Built in 1950 — when were the roof, HVAC, electrical panel, plumbing, and water heater last replaced?
- Is there a deadline driving the sale (1031 exchange, divorce, estate, relocation)? That informs how much negotiation room exists.
- Schools are D-rated, which usually means shorter tenancies and higher turnover. Who's the typical renter profile here, and what's been the actual vacancy rate?
- Crime grade is F in this area — have there been break-ins, vandalism, or insurance claims at this property in the last 3 years? What carrier currently insures it and at what premium?
- What's the average days-on-market for RENTAL listings here right now (not sales)? A rising rental-DOM trend means longer vacancies and softer asking-rent achievability than the comps imply.
- What's the recent tenant-quality profile in this submarket — average credit score on applications, eviction rate, late-payment / NSF rate, and stable-employment percentage? A property-management company in the area should have these aggregated.
- How much new for-sale + rental construction is in the pipeline within 1–3 miles? Heavy new supply typically softens prices + rents 12–24 months out; constrained supply supports both.
Investment metrics
- 1% rule
- 1.16% ✓
- Cap rate
- 8.94%
- Cash-on-cash
- 9.44%
- DSCR
- 1.42
- GRM
- 7.2
CMA / ARV
No comps found within radius.
Projected returns pro-forma
-3.0% appreciation · 6.05% rent growth · sell at horizon
- IRR
- 1.4%
- Equity multiple
- 1.05×
- Total profit
- $1,529
- Equity at exit
- $14,910
- IRR
- 13.9%
- Equity multiple
- 2.27×
- Total profit
- $35,565
- Equity at exit
- $8,646
Cash invested: $28,000 (down + closing). Projections, not guarantees.
Landlord ↔ Tenant lean methodology
- Overall (STATE)
- 83 Strongly Landlord-Friendly
- State Kansas
- 83 Strongly Landlord-Friendly · R+10
- County
- — inherits STATE
- City
- — inherits STATE
ZIP-level market 66441
- Rents YoY
- 6.0%
- Active inventory
- 260
- Price-to-rent
- 7.2×
Monthly cashflow live
- Estimated rent
- $1,164 medium interval (Pro) →
- Mortgage (P&I)
- −$524
- Tax from tax record
- −$133 /mo · $1,594/yr
- Insurance
- −$42
- HOA
- −$0
- Vacancy / Maint / Mgmt
- −$244
- Net cashflow
- $220
Break-even live
UW: 25.0% down · 7.5% · 30yr · 1.5% tax · 5.0% vac · 8.0% maint · 8.0% mgmt
Financing live
Cash to close
- Down payment
- $25,000
- Closing costs
- $3,000
- Reserves months
- —
- Total cash needed
- —
Loan-product check · same deal, 3 products live
Conventional
25% down · 7.5% · 30yr
- Down + closing
- —
- Monthly P&I
- —
- Monthly cashflow
- —
- DSCR
- —
- Eligible?
- —
Personal DTI + credit; lowest rate.
DSCR
20% down · 8.5% · 30yr
- Down + closing
- —
- Monthly P&I
- —
- Monthly cashflow
- —
- DSCR
- —
- Eligible?
- —
No personal income docs; deal must DSCR.
Hard money
10% down · 12.0% · 12mo
- Down + closing
- —
- Monthly P&I
- —
- Monthly cashflow
- —
- DSCR
- —
- Eligible?
- —
Short-term bridge; refi at stabilization.
Listing history 9 events
-
2026-05-30statusdays on market $100,000 Pending 10 DOM
-
2024-10-03historical $925
-
2024-09-05$925
-
2024-05-02price $95,000
-
2023-07-09historical
-
2019-12-11soldstatus 431-char remark
Show marketing remark (431 chars)
Another spectacular listing brought to you by Kyrsten Ross (785)307-3977 with RE/MAX Signature Properties (785)579-5300. This adorable 2 bedroom/1 bath home is ready for you! This quaint home has been remodeled top to bottom in recent years with new roof, HVAC, flooring, kitchen, and windows. Don't miss your opportunity to view this lovely home, call/text Kyrsten (785)307-3977 today to view this home or any others in the area!!
-
2019-09-03$64,900 431-char remark
Show marketing remark (431 chars)
Another spectacular listing brought to you by Kyrsten Ross (785)307-3977 with RE/MAX Signature Properties (785)579-5300. This adorable 2 bedroom/1 bath home is ready for you! This quaint home has been remodeled top to bottom in recent years with new roof, HVAC, flooring, kitchen, and windows. Don't miss your opportunity to view this lovely home, call/text Kyrsten (785)307-3977 today to view this home or any others in the area!!
-
2003-04-01soldstatus $23,500
-
1992-01-01soldstatus $27,337
ⓘ Source: listings_history table (triggers on properties + properties_extension) + one-shot
backfill from property_details.listing_events for pre-trigger history.
Tax reassessment forecast KS · Resets to sale price
- Current annual tax
- $1,594 · $133/mo
- Projected year-2 tax
- $1,594 · $133/mo
- Expected delta
- $0/yr ($0/mo · 0.0%)
ⓘ Screening estimate from a state-policy table — verify with the county assessor before closing.
Climate risk First Street
- Flood 1/10 Low FEMA zone X (unshaded) · 0% chance over 30 yrs
- Wildfire 5/10 Major
- Heat 4/10 Moderate 7 d/yr ≥107°F today · 16 d/yr by 30 yrs out
- Wind 2/10 Low
- Air quality 3/10 Moderate 2 unhealthy d/yr today · 3 by 30 yrs out
Nearby sold comps map
Loading sold comps map…
Walkable amenities ~0.75 mi
Loading nearby amenities…
Taxation est. · year 1
- Rental income
- $13,963
- − Mortgage interest
- −$5,602
- − Property taxes
- −$1,594
- − Insurance
- −$500
- − Repairs & maintenance
- −$1,117
- − Management
- −$1,117
- − Depreciation
- −$2,909
- Taxable income
- $1,124
- Est. tax owed @ 24.0%
- −$270
- After-tax cash flow
- $2,374/yr
For passive investors: Depreciation is non-cash, so a rental often shows a tax loss while cash-flowing — sheltering income. Rental losses are passive: they offset passive income freely, and up to $25,000/yr can offset ordinary (W-2) income if you actively participate and your MAGI is under $100k (phasing out to $0 by $150k); unused losses carry forward. On sale, claimed depreciation is recaptured at up to 25%, and gains may owe capital-gains tax (a 1031 exchange can defer both). Figures are a year-1 estimate at your 24.0% rate — not tax advice; consult a CPA.
Schools (NCES district)
- District
- Geary County Schools
- NCES district ID
- 2007890
- Math proficiency
- 32% ▲ 1.00%
- Reading proficiency
- 39% ▲ 2.00%
- Median HH income
- $44,319
- Composite
- 30.2/100
- National rank
- #6306
- State rank
- #60 of 169 in KS
Livability — Junction City
- Score
- 66/100
- State rank
- #266
- US rank
- #11965
Category grades
Schools grade is shown separately in the Schools card above.
Census & demographics
- Census place
- Junction City, KS
- County
- Geary County · 25,828 people
- City population
- 25,828
- Metro
- Manhattan, KS
- Population (ZIP)
- 25,828
- Household income
- $59,522
- Rent vs Own
- Severe rent burden
- 950.0
Population outlook (Geary County) Hauer SSP2
- Today (2025)
- 37,364 people
- By 2030
- 38,234 · +2.3%
- By 2040
- 39,727 · +6.3%
- By 2050
- 40,314 · +7.9%
- By 2075
- 44,283 · +18.5%
- By 2100
- 46,935 · +25.6%
Race, ethnicity, and origin ACS 2023
- Neighborhood character
- Diverse neighborhood (Simpson 0.66)
- Race & ethnicity
- White 53% Black 19% Two or more races 15% Hispanic / Latino 15% Asian 3%
- Hispanic origin (detail)
- Mexican 8% Puerto Rican 4%
- Common ancestry
- Lithuanian 3% Italian 2% Portuguese 2%
- Foreign-born
- 8% · Canada, South Korea, Vietnam
- Languages at home
- 85% English-only · Spanish 9% German/W. Germanic 1% Korean 1%
Political lean MEDSL · Geary
- 2024 margin
- R (+17.6) · D 40.1% · R 57.7% · Other 2.2%
- 2008→2024 swing
- -5.2pp toward R · 2008: -12.4pp · 2024: -17.6pp
- All cycles
- 2024: R+17.6 2020: R+14.7 2016: R+21.7 2012: R+14.4 2008: R+12.4
Not yet ingested
- Civics
- —
Market trends
- HPI YoY
- ▼ -152.25%
- Current HPI
- 137.9936
- Rent YoY
- ▲ 6.05%
- Metro
- Manhattan, KS
- State GDP YoY
- —
- F500 in state
- 0
Price history
+247.5% since first listed8 events — show timeline
- 2024-10-03 Rental Removed $925 APPFOLIO
- 2024-09-05 Listed for Rent $925 APPFOLIO
- 2024-05-02 Price Changed $95,000 FHAOR as distributed by MLS GRID
- 2023-07-09 Rental Removed — APPFOLIO
- 2019-12-11 Sold (MLS) — FHAOR as distributed by MLS GRID
- 2019-09-03 Listed $64,900 FHAOR as distributed by MLS GRID
- 2003-04-01 Sold (Public Records) $23,500 Public Records
- 1992-01-01 Sold (Public Records) $27,337 Public Records
Property tax history
+2.9%/yrLatest (2025): $1,594 · +9.0% YoY. Source: county tax records.
Cash-flow waterfall
monthlySold comps — $/sqft
last 12 mo · ≤1 miLoading sold comps…