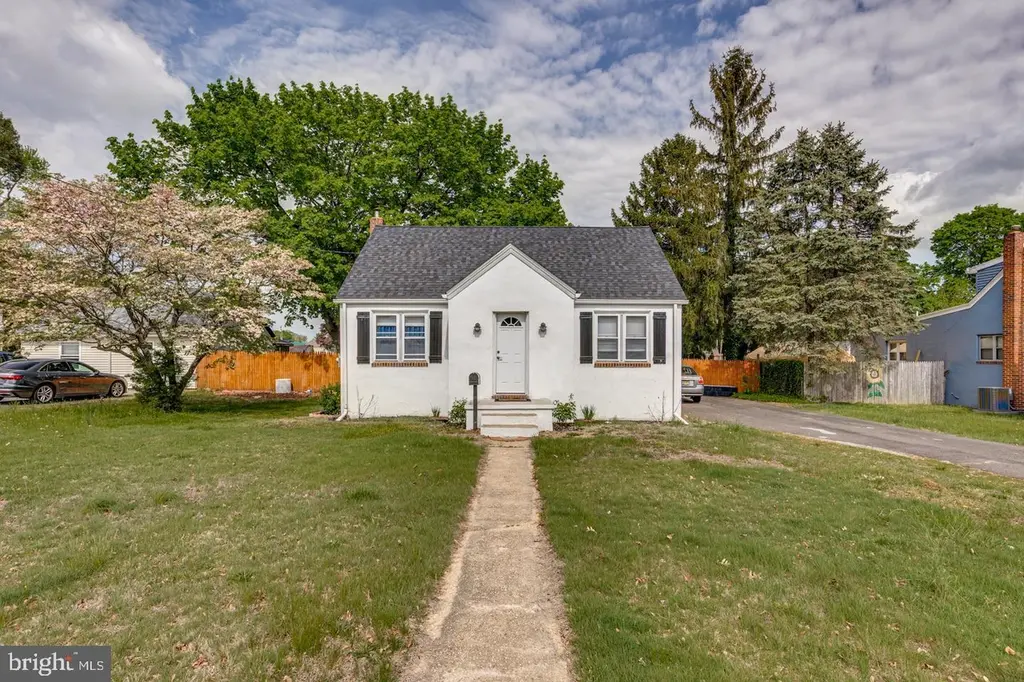
319 Pine St · Williamstown, NJ
Flood risk 1/10 · Minimal
- FEMA flood zone
- X (unshaded)
- Chance of flooding over 30 yrs
- 0.0%
- Est. flood insurance / yr
- $507 – $1,088
Fire risk 3/10 · Minor
- Est. fire insurance / yr
- $526 – $976
Heat risk 7/10 · Major
- Hot days now (above 104°F)
- 7 days/yr
- Hot days in 30 yrs
- 15 days/yr
Wind risk 6/10 · Moderate
- Chance of severe wind over 30 yrs
- 63.0%
Air-quality risk 3/10 · Minor
- Unhealthy air days now
- 2 days/yr
- Unhealthy air days in 30 yrs
- 4 days/yr
Risk factors via First Street. Map © Google.
Why this score? — see what drove the F grade
The composite is a weighted blend of 9 inputs, each scored 0–100. Each bar is that input's sub-score; the figure is the points it added to the 100-point composite (weight × sub-score).
- Cash flow +13.7/30.0
- DSCR +4.1/10.0
- 1% rule +4.0/10.0
- Livability +3.5/5.0
- Schools +3.0/10.0
- Rent growth +2.5/5.0
- Condition / age +2.5/5.0
- ARV discount +0.0/15.0
- Appreciation +0.0/10.0
$275,000
🖨 Deal sheet 📄 Offer letter ✓ Due diligence
Listing remarks MLS
Attention investors! Recently refreshed home in Williamstown, convenient to Route 42, ACE, shopping and Geets! Nice, quiet neighborhood. Large, fenced backyard. Current lease at $2,050/mo. through 6/30/25 with good tenants. Make your appointment today (24 hours notice, please)!
Key facts
- Newer kitchen
- Washer and dryer
- Unfinished basement
Tags
Property features AI
Exterior
- Parking: Asphalt driveway; Driveway parking
- Utilities: Public water; Public sewer; Electric hot water
- Home design: Detached property; Estimated year built; Property in very good condition; Fee simple ownership
- Construction: Block construction; Block foundation
- Exterior features: Wood fencing; Shed; Screened porch; Full unfinished basement with interior access
Interior
- Kitchen: Electric oven/range; Refrigerator
- Bedrooms: Two bedrooms on the main level; One bedroom on the upper level
- Flooring: Hardwood; Laminate plank; Tile/brick
- Bathrooms: One full bathroom on the main level; One full bathroom total
- Heating & cooling: Heat pump with electric backup; Electric heating fuel; Central air (electric)
- Interior features: Ceiling fans; Tub with shower; Entry-level bedroom; Wood floors
- Laundry & utility: Washer; Dryer
Neighborhood map
What this means for you Summary
Snapshot
- This is a 3-bed/1.0-bath single-family listed at $275k.
Deal economics
- At list price, monthly cash flow is $18 ($216/yr) — positive.
- The deal already cash-flows at list — no discount required.
- To meet the 1% rule (rent ≥ 1% of price), the offer needs to be $248k (9.9% below list).
- Recommended offer: $248k (9.9% below list) — sets the bar for 1% rule.
- Cap rate 6.4% vs local median 4.9% in Williamstown — top-decile yield for the area; either an underpriced asset or a hidden risk that comps aren't pricing in. Stress-test before assuming the spread holds.
Location & tenants
- Location reads 69/100 on livability (#289 in NJ) — a middle-class / working-renter tenant base. Strengths: employment A+, housing A+; Watch: cost of living D+, amenities F, commute F.
- Monroe Township Public School District (suburban): math 20% / reading 45% proficiency, ranked #302 of 472 in NJ (top 64%) — families likely to look elsewhere, expect single-tenant / working-renter base with shorter leases.
- Zoned schools: Williamstown High School (math 21% / reading 50%, grade F, #234 of 399 statewide, top 59%, 1,782 students, 26% FRL) — zoned schools at 26% FRL track the district average.
- Market conditions: 268 active listings in the ZIP; 4 comparable units currently listed for rent nearby; rentals leasing fast (median 1d on market — plan ~1-2 weeks tenant-placement turnaround); solid renter incomes; 1,047 units permitted in Gloucester County in 2024 (183 in 5+ unit buildings).
- This rent runs 31% of the median local income ($97k/yr) — at the standard rent-burdened threshold; future hikes will face affordability resistance.
Forward outlook
- Local home prices are declining (-3.0%/yr); year-one equity from $2k of loan paydown is wiped out by about $8k of value loss. Plan a longer hold.
- Gloucester County population projected to shrink 5% by 2050 — rents likely to lag national; underwrite the cash flow, not the appreciation.
Negotiation context
- Only 8 days on market — expect competitive offers; lowballing is unlikely to land.
- 5 sale attempts since 8y ago; this cycle's ask is 12995% above the opening price — seller raised mid-cycle; expect resistance to lowballs.
- Current owner paid $229k; 20% above their basis — modest negotiation headroom, anchor on the comps not their cost.
Risks & watch-outs
- Watch-outs: built in 1947 — expect roof / HVAC / electrical / plumbing capex.
- Climate carrying-cost: major wind risk, 63% chance of damaging wind over 30y; extreme-heat days projected 7→15/yr by 2055 (HVAC capex compounding) — expect insurance premiums to compound above CPI over the hold.
Questions for the listing agent
- Built in 1947 — when were the roof, HVAC, electrical panel, plumbing, and water heater last replaced?
- Is there a deadline driving the sale (1031 exchange, divorce, estate, relocation)? That informs how much negotiation room exists.
- The area grade is low — what's the realistic commute time and amenity access for the typical tenant pool here? Any planned neighborhood developments (good or bad) we should know about?
- What's the average days-on-market for RENTAL listings here right now (not sales)? A rising rental-DOM trend means longer vacancies and softer asking-rent achievability than the comps imply.
- What's the recent tenant-quality profile in this submarket — average credit score on applications, eviction rate, late-payment / NSF rate, and stable-employment percentage? A property-management company in the area should have these aggregated.
- How much new for-sale + rental construction is in the pipeline within 1–3 miles? Heavy new supply typically softens prices + rents 12–24 months out; constrained supply supports both.
Investment metrics
- 1% rule
- 0.90% ✗
- Cap rate
- 6.37%
- Cash-on-cash
- 0.28%
- DSCR
- 1.01
- GRM
- 9.2
CMA / ARV
- ARV (on-the-fly)
- $189,600
- Comps found
- 5
Show comp detail 5 sales within ~0.75 mi
| Address | Dist | Beds/Ba | Sqft | Sold | Price | $/sf | Match |
|---|---|---|---|---|---|---|---|
| 319 Pine St | 0.00mi | 3/1.0 | 790 (0%) | 18mo | $229,000 | $290 | 85 |
| 503 Sicklerville Rd | 0.18mi | 2/1.0 (-1) | 832 (+5%) | 7mo | $164,500 | $198 | 72 |
| 142 Lindale Ave | 0.19mi | 4/1.0 (+1) | 896 (+13%) | 14mo | $215,000 | $240 | 52 |
| 9 Filbert St | 0.68mi | 2/1.0 (-1) | 816 (+3%) | 21mo | $240,000 | $294 | 40 |
| 344 Lake Ave | 0.48mi | 2/1.0 (-1) | 896 (+13%) | 13mo | $150,000 | $167 | 39 |
Match score weights: distance 35% · size 25% · config 20% · recency 20%. Top-matched comps best support the ARV.
Projected returns pro-forma
-3.0% appreciation · 3.0% rent growth · sell at horizon
- IRR
- -15.8%
- Equity multiple
- 0.44×
- Total profit
- $-43,354
- Equity at exit
- $41,003
- IRR
- -7.4%
- Equity multiple
- 0.53×
- Total profit
- $-36,026
- Equity at exit
- $23,777
Cash invested: $77,000 (down + closing). Projections, not guarantees.
Landlord ↔ Tenant lean methodology
- Overall (STATE)
- 21 Tenant-Leaning
- State New Jersey
- 21 Tenant-Leaning · D+6
- County
- — inherits STATE
- City
- — inherits STATE
ZIP-level market 08094
- Active inventory
- 268
- Price-to-rent
- 9.2×
Monthly cashflow live
- Estimated rent
- $2,479 medium interval (Pro) →
- Mortgage (P&I)
- −$1,442
- Tax from tax record
- −$383 /mo · $4,602/yr
- Insurance
- −$115
- HOA
- −$0
- Vacancy / Maint / Mgmt
- −$521
- Net cashflow
- $18
Break-even live
UW: 25.0% down · 7.5% · 30yr · 1.5% tax · 5.0% vac · 8.0% maint · 8.0% mgmt
Financing live
Cash to close
- Down payment
- $68,750
- Closing costs
- $8,250
- Reserves months
- —
- Total cash needed
- —
Loan-product check · same deal, 3 products live
Conventional
25% down · 7.5% · 30yr
- Down + closing
- —
- Monthly P&I
- —
- Monthly cashflow
- —
- DSCR
- —
- Eligible?
- —
Personal DTI + credit; lowest rate.
DSCR
20% down · 8.5% · 30yr
- Down + closing
- —
- Monthly P&I
- —
- Monthly cashflow
- —
- DSCR
- —
- Eligible?
- —
No personal income docs; deal must DSCR.
Hard money
10% down · 12.0% · 12mo
- Down + closing
- —
- Monthly P&I
- —
- Monthly cashflow
- —
- DSCR
- —
- Eligible?
- —
Short-term bridge; refi at stabilization.
Rent comps 4 comps
| Address | Beds | Baths | Sqft | Rent | $/sqft | DOM | Units | Dist |
|---|---|---|---|---|---|---|---|---|
| 15 Kent Rd Williamstown, NJ | 1.0–2.0 | 1.0 | 850 | $1,925 | $2.26 | 1d | 1 | 0.17mi |
| 601 N Black Horse Pike Williamstown, NJ | 2.0 | 1.0 | 760 | $1,938 | $2.55 | 1d | 1 | 0.31mi |
| 401 N Main St Williamstown, NJ | 1.0–2.0 | 1.0 | 860 | $1,825 | $2.12 | 1d | 1 | 0.61mi |
| 401 Blue Bell Rd Unit C Williamstown, NJ | 3.0 | 1.0 | 1000 | $1,700 | $1.70 | 1d | 1 | 0.81mi |
Listing history 6 events
-
2026-06-18days on market $275,000 Coming Soon 8 DOM
-
2026-06-17days on market $275,000 Coming Soon 7 DOM
-
2026-06-16days on market $275,000 Coming Soon 6 DOM
-
2026-06-15days on market $275,000 Coming Soon 5 DOM
-
2026-06-13remarks 693-char remark
-
2026-06-13$275,000 Coming Soon 3 DOM
ⓘ Source: listings_history table (triggers on properties + properties_extension) + one-shot
backfill from property_details.listing_events for pre-trigger history.
Tax reassessment forecast NJ · Partial reset (capped growth)
- Current annual tax
- $4,602 · $383/mo
- Projected year-2 tax
- $5,725 · $477/mo
- Expected delta
- +$1,123/yr (+$94/mo · 24.4%)
ⓘ Screening estimate from a state-policy table — verify with the county assessor before closing.
Climate risk First Street
- Flood 1/10 Low FEMA zone X (unshaded) · 0% chance over 30 yrs
- Wildfire 3/10 Moderate
- Heat 7/10 Severe 7 d/yr ≥104°F today · 15 d/yr by 30 yrs out
- Wind 6/10 Major 63% chance of damaging wind over 30 yrs
- Air quality 3/10 Moderate 2 unhealthy d/yr today · 4 by 30 yrs out
Nearby sold comps map
Loading sold comps map…
Walkable amenities ~0.75 mi
Loading nearby amenities…
Taxation est. · year 1
- Rental income
- $29,745
- − Mortgage interest
- −$15,404
- − Property taxes
- −$4,602
- − Insurance
- −$1,375
- − Repairs & maintenance
- −$2,380
- − Management
- −$2,380
- − Depreciation
- −$8,000
- Taxable loss
- −$4,396
- Est. tax savings @ 24.0%
- +$1,055
- After-tax cash flow
- $1,271/yr
For passive investors: Depreciation is non-cash, so a rental often shows a tax loss while cash-flowing — sheltering income. Rental losses are passive: they offset passive income freely, and up to $25,000/yr can offset ordinary (W-2) income if you actively participate and your MAGI is under $100k (phasing out to $0 by $150k); unused losses carry forward. On sale, claimed depreciation is recaptured at up to 25%, and gains may owe capital-gains tax (a 1031 exchange can defer both). Figures are a year-1 estimate at your 24.0% rate — not tax advice; consult a CPA.
Schools (NCES district)
- District
- Monroe Township Public School District
- NCES district ID
- 3410470
- Math proficiency
- 20% ▼ -24.00%
- Reading proficiency
- 45% ▼ -9.00%
- Median HH income
- $71,557
- Composite
- 30.24/100
- National rank
- #6295
- State rank
- #302 of 472 in NJ
Livability — Williamstown
- Score
- 69/100
- State rank
- #289
- US rank
- #8603
Category grades
Schools grade is shown separately in the Schools card above.
Census & demographics
- Census place
- Williamstown, NJ
- County
- Gloucester County · 160,422 people
- City population
- 41,595
- Metro
- Philadelphia-Camden-Wilmington, PA-NJ-DE-MD
- Population (ZIP)
- 41,595
- Household income
- $96,699
- Rent vs Own
- Severe rent burden
- 721.0
Population outlook (Gloucester County) Hauer SSP2
- Today (2025)
- 298,895 people
- By 2030
- 299,031 · +0.0%
- By 2040
- 294,020 · -1.6%
- By 2050
- 284,188 · -4.9%
- By 2075
- 260,720 · -12.8%
- By 2100
- 229,565 · -23.2%
Race, ethnicity, and origin ACS 2023
- Neighborhood character
- Predominantly White (73%)
- Race & ethnicity
- White 73% Hispanic / Latino 11% Black 10% Two or more races 8% Asian 1%
- Hispanic origin (detail)
- Puerto Rican 6% Dominican 1%
- Common ancestry
- Romanian 6% Slovak 2% Lithuanian 1%
- Foreign-born
- 4% · Canada
- Languages at home
- 92% English-only · Spanish 5% Russian/Polish/Slavic 1%
Political lean MEDSL · Gloucester
- 2024 margin
- Toss-up / Even · D 47.8% · R 50.6% · Other 1.6%
- 2008→2024 swing
- -15.0pp toward R · 2008: 12.2pp · 2024: -2.8pp
- All cycles
- 2024: R+2.8 2020: D+1.9 2016: R+0.4 2012: D+10.5 2008: D+12.2
Not yet ingested
- Civics
- —
Market trends
- HPI YoY
- ▼ -213.12%
- Current HPI
- 278.3849
- Rent YoY
- —
- Metro
- Philadelphia-Camden-Wilmington, PA-NJ-DE-MD
- State GDP YoY
- ▲ 2.05%
- F500 in state
- 34
Industry mix (Fortune 500 HQ in NJ)
| Industry | F500 HQs | Revenue |
|---|---|---|
| Consumer Goods | 3 | $31B |
|
||
| Pharmaceuticals | 2 | $153B |
|
||
| Technology | 2 | $21B |
|
||
| Insurance | 2 | $20B |
|
||
| Healthcare | 2 | $19B |
|
||
| Financial Services | 1 | $70B |
|
||
Price history
+50.7% since first listed22 events — show timeline
- 2026-06-10 Coming Soon $275,000 BRIGHT MLS
- 2025-05-21 Rental Removed $2,100 BRIGHTMLS
- 2025-05-02 Listed for Rent $2,100 BRIGHTMLS
- 2024-12-18 Sold (Public Records) $229,000 Public Records
- 2024-12-12 Sold (MLS) $229,000 BRIGHT MLS
- 2024-11-27 Pending — BRIGHT MLS
- 2024-09-10 Price Changed $239,000 BRIGHT MLS
- 2024-08-22 Relisted — BRIGHT MLS
- 2024-08-19 Listing Removed — BRIGHT MLS
- 2024-08-15 Listed $259,000 BRIGHT MLS
- 2024-08-14 Coming Soon $259,000 BRIGHT MLS
- 2019-10-08 Listing Removed — BRIGHT MLS
- 2019-09-21 Price Changed $84,900 BRIGHT MLS
- 2019-08-13 Listed $86,900 BRIGHT MLS
- 2019-01-04 Sold (Public Records) $41,000 Public Records
- 2018-12-31 Sold (MLS) $53,000 BRIGHT MLS
- 2018-11-17 Pending — BRIGHT MLS
- 2018-10-26 Price Changed $59,900 BRIGHT MLS
- 2018-10-20 Price Changed $62,500 BRIGHT MLS
- 2018-10-05 Price Changed $67,500 BRIGHT MLS
- 2018-09-24 Listed $72,500 BRIGHT MLS
- 2002-11-26 Sold (Public Records) $182,500 Public Records
Property tax history
+2.6%/yrLatest (2025): $4,602 · +13.6% YoY. Source: county tax records.
Cash-flow waterfall
monthlySold comps — $/sqft
last 12 mo · ≤1 miLoading sold comps…