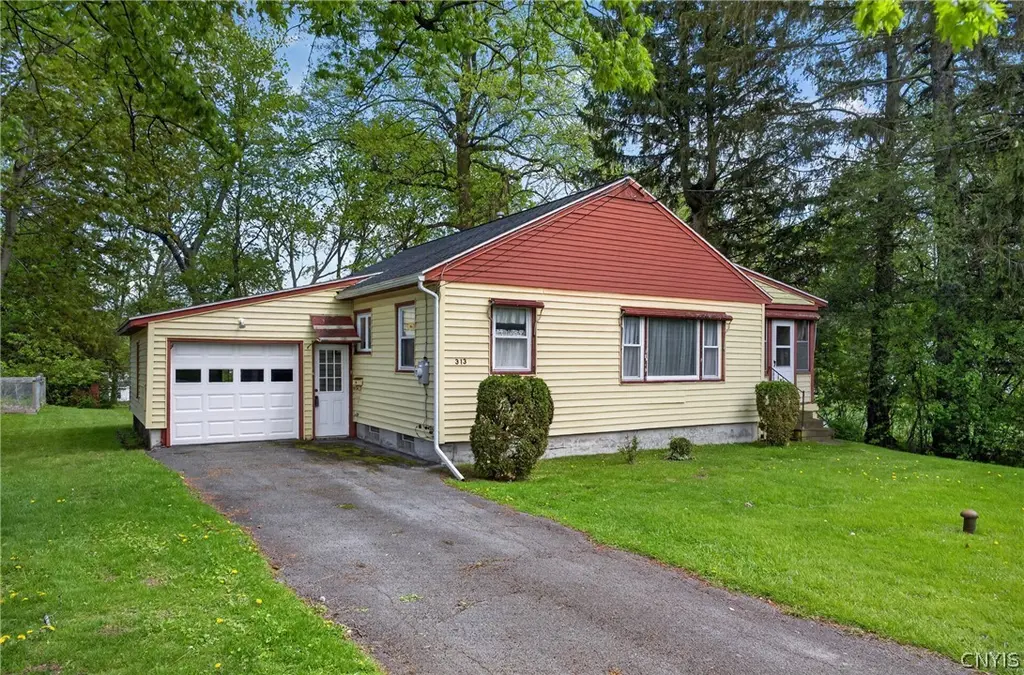
313 S Terry Rd · Westvale, NY
Flood risk 1/10 · Minimal
- FEMA flood zone
- X (unshaded)
- Chance of flooding over 30 yrs
- 0.0%
- Est. flood insurance / yr
- $473 – $860
Fire risk 1/10 · Minimal
- Est. fire insurance / yr
- $691 – $1,283
Heat risk 3/10 · Minor
- Hot days now (above 95°F)
- 7 days/yr
- Hot days in 30 yrs
- 16 days/yr
Wind risk 1/10 · Minimal
- Chance of severe wind over 30 yrs
- 0.0%
Air-quality risk 2/10 · Minimal
- Unhealthy air days now
- 0 days/yr
- Unhealthy air days in 30 yrs
- 1 days/yr
Risk factors via First Street. Map © Google.
Why this score? — see what drove the D grade
The composite is a weighted blend of 9 inputs, each scored 0–100. Each bar is that input's sub-score; the figure is the points it added to the 100-point composite (weight × sub-score).
- ARV discount +13.0/15.0
- Cash flow +8.1/30.0
- Schools +5.3/10.0
- Livability +4.0/5.0
- 1% rule +3.4/10.0
- Rent growth +2.5/5.0
- Condition / age +2.5/5.0
- DSCR +2.1/10.0
- Appreciation +0.0/10.0
$219,900
🖨 Deal sheet (PDF) 📄 Offer letter ✓ Due diligence
Listing remarks
Welcome to your new home! This beautifully updated home at 313 S Terry Rd is truly move-in ready and waiting for its next owner. Nearly every major improvement has already been completed, giving you peace of mind from day one. Recent updates include a new roof, fully renovated kitchen and bathroom, new appliances, furnace, and hot water tank. Inside, you’ll find a clean, modern feel with updated finishes and a functional layout perfect for everyday living. Whether you’re a first-time buyer, downsizing, or looking for a turnkey investment, this home offers the perfect combination of comfort, convenience, and low-maintenance living. Just unpack and enjoy — all the hard work
Key facts
- New furnace
- New hot water tank
- New appliances
Tags
Property features AI
Exterior
- Parking: Attached garage with 1 garage space
- Utilities: Public water (connected); Sewer connected
- Home design: Single-story home; Existing/resale property
- Construction: Vinyl siding; Blown-in insulation and insulated attic/crawl hatchway(s); Block foundation
- Exterior features: Blacktop driveway; City street frontage; Rectangular residential lot (60 x 153)
Interior
- Kitchen: Gas cooktop; Microwave; Dishwasher; Refrigerator
- Bedrooms: Three main-level bedrooms
- Flooring: Hardwood; Laminate; Vinyl; Varied flooring
- Bathrooms: One full bathroom on the main level
- Heating & cooling: Gas forced-air heating
- Interior features: Eat-in kitchen; Full basement with recreation space
- Laundry & utility: Washer and dryer located in the basement; Gas water heater
Neighborhood map
What this means for you Summary
Snapshot
- This is a 3-bed/1.0-bath single-family listed at $220k.
Deal economics
- At list price, monthly cash flow is $-219 ($-3k/yr) — negative.
- To cash-flow at today's rent, offer at most $181k (17.6% below list).
- To meet the 1% rule (rent ≥ 1% of price), the offer needs to be $184k (16.4% below list).
- Recommended offer: $181k (17.6% below list) — sets the bar for cash-flow.
- Cap rate 5.1% vs local median 3.9% in Westvale — top-decile yield for the area; either an underpriced asset or a hidden risk that comps aren't pricing in. Stress-test before assuming the spread holds.
Location & tenants
- Location reads 80/100 on livability (#105 in NY, #1,731 nationally) — a professional / high-income tenant draw. Strengths: employment A+, housing A+, health & safety A; Watch: amenities F, commute F.
- Westhill Central School District (suburban): math 57% / reading 64% proficiency, ranked #212 of 590 in NY (top 36%) — acceptable for families but not a draw, mixed tenant base, ~2y average lease; only 11% free/reduced lunch — higher-income household profile.
- Zoned schools: Cherry Road Elementary School (math 65% / reading 72%, grade B+, #517 of 2,108 statewide, top 25%, 365 students, 32% FRL); Onondaga Hill Middle School (math 39% / reading 60%, grade C, #280 of 729 statewide, top 40%, 554 students, 32% FRL); Westhill High School (math 98% / reading 70%, grade A, #409 of 1,100 statewide, top 39%, 550 students, 25% FRL) — zoned schools average 29% FRL vs 11% district-wide (18 pts higher); higher-poverty schools than district average — tighter screening recommended.
- Market conditions: 53 active listings in the ZIP; 1 comparable units currently listed for rent nearby; solid renter incomes; 616 units permitted in Onondaga County in 2024 (256 in 5+ unit buildings).
Forward outlook
- Local home prices are declining (-3.0%/yr); year-one equity from $2k of loan paydown is wiped out by about $7k of value loss. Plan a longer hold.
- Onondaga County population projected to shrink 9% by 2050 — rents likely to lag national; underwrite the cash flow, not the appreciation.
Negotiation context
- It's been on market 17 days — a 2% lower offer ($217k) is reasonable based on typical stale-listing flexibility.
Risks & watch-outs
- Watch-outs: built in 1958 — expect roof / HVAC / electrical / plumbing capex.
Questions for the listing agent
- What do current leases actually rent for vs. the listed asking? Can we see a recent rent roll and the last 12 months of T-12 income?
- Built in 1958 — when were the roof, HVAC, electrical panel, plumbing, and water heater last replaced?
- Is there a deadline driving the sale (1031 exchange, divorce, estate, relocation)? That informs how much negotiation room exists.
- Schools are A-rated — typically a magnet for longer-tenancy family renters. What's the average tenant stay here, and is there a school-zone premium baked into asking?
- The area grade is low — what's the realistic commute time and amenity access for the typical tenant pool here? Any planned neighborhood developments (good or bad) we should know about?
- What's the average days-on-market for RENTAL listings here right now (not sales)? A rising rental-DOM trend means longer vacancies and softer asking-rent achievability than the comps imply.
- What's the recent tenant-quality profile in this submarket — average credit score on applications, eviction rate, late-payment / NSF rate, and stable-employment percentage? A property-management company in the area should have these aggregated.
- How much new for-sale + rental construction is in the pipeline within 1–3 miles? Heavy new supply typically softens prices + rents 12–24 months out; constrained supply supports both.
Investment metrics
- 1% rule
- 0.84% ✗
- Cap rate
- 5.10%
- Cash-on-cash
- -4.27%
- DSCR
- 0.81
- GRM
- 10.0
CMA / ARV
- ARV (median comp)
- $250,525
- List price
- $219,900
- Delta
- -12.22%
- Verdict
- UNDERPRICED
- Comps
- 20 within 1.0 mi
Show comp detail 12 sales within ~0.75 mi
| Address | Dist | Beds/Ba | Sqft | Sold | Price | $/sf | Match |
|---|---|---|---|---|---|---|---|
| 509 Bronson Rd | 0.27mi | 3/2.0 | 992 (+5%) | 4mo | $215,000 | $217 | 72 |
| 210 Newcastle Rd | 0.18mi | 3/1.5 | 1,014 (+7%) | 7mo | $220,000 | $217 | 72 |
| 213 Walberta Rd | 0.34mi | 3/1.0 | 1,044 (+10%) | 2mo | $217,531 | $208 | 65 |
| 102 Kent Pl | 0.65mi | 3/1.0 | 960 (+2%) | 8mo | $230,000 | $240 | 60 |
| 104 Ferndale Rd | 0.39mi | 3/2.0 | 996 (+5%) | 18mo | $186,000 | $187 | 54 |
| 229 Marian Dr | 0.70mi | 3/1.5 | 988 (+5%) | 6mo | $210,000 | $213 | 52 |
| 103 Century Dr | 0.54mi | 2/1.5 (-1) | 1,014 (+7%) | 5mo | $224,000 | $221 | 51 |
| 122 Timber Wolf Cir | 0.45mi | 2/2.0 (-1) | 1,056 (+12%) | 5mo | $251,000 | $238 | 46 |
| 213 Marian Dr | 0.65mi | 3/1.0 | 1,000 (+6%) | 18mo | $164,800 | $165 | 45 |
| 502 W Manchester Rd | 0.53mi | 3/1.5 | 1,060 (+12%) | 15mo | $235,000 | $222 | 41 |
| 502 W High Ter | 0.59mi | 3/1.5 | 1,041 (+10%) | 18mo | $287,500 | $276 | 38 |
| 218 Terry Rd N | 0.72mi | 2/1.0 (-1) | 896 (-5%) | 18mo | $182,500 | $204 | 38 |
Match score weights: distance 35% · size 25% · config 20% · recency 20%. Top-matched comps best support the ARV.
Projected returns pro-forma
-3.0% appreciation · 3.0% rent growth · sell at horizon
- IRR
- -23.4%
- Equity multiple
- 0.20×
- Total profit
- $-49,462
- Equity at exit
- $32,788
- IRR
- -18.0%
- Equity multiple
- 0.02×
- Total profit
- $-60,542
- Equity at exit
- $19,013
Cash invested: $61,572 (down + closing). Projections, not guarantees.
Landlord ↔ Tenant lean methodology
- Overall (STATE)
- 15 Strongly Tenant-Friendly
- State New York
- 15 Strongly Tenant-Friendly · D+10
- County
- — inherits STATE
- City
- — inherits STATE
ZIP-level market 13219
- Home prices YoY
- -20.6%
- Active inventory
- 53
- Price-to-rent
- 10.0×
Monthly cashflow live
- Estimated rent
- $1,838 medium interval (Pro) →
- Mortgage (P&I)
- −$1,153
- Tax from tax record
- −$426 /mo · $5,111/yr
- Insurance
- −$92
- HOA
- −$0
- Vacancy / Maint / Mgmt
- −$386
- Net cashflow
- $-219
Break-even live
Sensitivity live
| Price | -10% $-95 | -5% $-157 | +0% $-219 | +5% $-281 | +10% $-343 |
|---|---|---|---|---|---|
| Rent | -10% $-364 | -5% $-292 | +0% $-219 | +5% $-146 | +10% $-74 |
| Rate | -1.0pp $-108 | -0.5pp $-163 | base $-219 | +0.5pp $-276 | +1.0pp $-334 |
UW: 25.0% down · 7.5% · 30yr · 1.5% tax · 5.0% vac · 8.0% maint · 8.0% mgmt
Financing live
Cash to close
- Down payment
- $54,975
- Closing costs
- $6,597
- Reserves months
- —
- Total cash needed
- —
Loan-product check · same deal, 3 products live
Conventional
25% down · 7.5% · 30yr
- Down + closing
- —
- Monthly P&I
- —
- Monthly cashflow
- —
- DSCR
- —
- Eligible?
- —
Personal DTI + credit; lowest rate.
DSCR
20% down · 8.5% · 30yr
- Down + closing
- —
- Monthly P&I
- —
- Monthly cashflow
- —
- DSCR
- —
- Eligible?
- —
No personal income docs; deal must DSCR.
Hard money
10% down · 12.0% · 12mo
- Down + closing
- —
- Monthly P&I
- —
- Monthly cashflow
- —
- DSCR
- —
- Eligible?
- —
Short-term bridge; refi at stabilization.
Rent comps 1 comps
| Address | Beds | Baths | Sqft | Rent | $/sqft | DOM | Units | Dist |
|---|---|---|---|---|---|---|---|---|
| 306 Hall Ave Unit Left Side Solvay, NY | 3.0 | 1.5 | 1120 | $1,750 | $1.56 | 46d | 1 | 1.43mi |
Listing history 1 events
-
2026-05-11$219,900 Active 721-char remark
ⓘ Source: listings_history table (triggers on properties + properties_extension) + one-shot
backfill from property_details.listing_events for pre-trigger history.
Tax reassessment forecast NY · Partial reset (capped growth)
- Current annual tax
- $5,111 · $426/mo
- Projected year-2 tax
- $5,111 · $426/mo
- Expected delta
- $0/yr ($0/mo · 0.0%)
ⓘ Screening estimate from a state-policy table — verify with the county assessor before closing.
Climate risk First Street
- Flood 1/10 Low FEMA zone X (unshaded) · 0% chance over 30 yrs
- Wildfire 1/10 Low
- Heat 3/10 Moderate 7 d/yr ≥95°F today · 16 d/yr by 30 yrs out
- Wind 1/10 Low 0% chance of damaging wind over 30 yrs
- Air quality 2/10 Low 0 unhealthy d/yr today · 1 by 30 yrs out
Nearby sold comps map
Loading sold comps map…
Walkable amenities ~0.75 mi
Loading nearby amenities…
Taxation est. · year 1
- Rental income
- $22,052
- − Mortgage interest
- −$12,318
- − Property taxes
- −$5,111
- − Insurance
- −$1,100
- − Repairs & maintenance
- −$1,764
- − Management
- −$1,764
- − Depreciation
- −$6,397
- Taxable loss
- −$6,402
- Est. tax savings @ 24.0%
- +$1,537
- After-tax cash flow
- $-1,092/yr
For passive investors: Depreciation is non-cash, so a rental often shows a tax loss while cash-flowing — sheltering income. Rental losses are passive: they offset passive income freely, and up to $25,000/yr can offset ordinary (W-2) income if you actively participate and your MAGI is under $100k (phasing out to $0 by $150k); unused losses carry forward. On sale, claimed depreciation is recaptured at up to 25%, and gains may owe capital-gains tax (a 1031 exchange can defer both). Figures are a year-1 estimate at your 24.0% rate — not tax advice; consult a CPA.
Schools (NCES district)
- District
- Westhill Central School District
- NCES district ID
- 3607320
- Math proficiency
- 57% ▼ -10.00%
- Reading proficiency
- 64% ▲ 9.00%
- Median HH income
- $66,976
- Composite
- 53.09/100
- National rank
- #1516
- State rank
- #212 of 590 in NY
Livability — Westvale
- Score
- 80/100
- State rank
- #105
- US rank
- #1731
Category grades
Schools grade is shown separately in the Schools card above.
Census & demographics
- Census place
- Westvale, NY
- County
- Onondaga County · 247,257 people
- City population
- 15,546
- Metro
- Syracuse, NY
- Population (ZIP)
- 14,744
- Household income
- $85,149
- Rent vs Own
- Severe rent burden
- 222.0
Population outlook (Onondaga County) Hauer SSP2
- Today (2025)
- 467,894 people
- By 2030
- 463,381 · -1.0%
- By 2040
- 447,697 · -4.3%
- By 2050
- 426,399 · -8.9%
- By 2075
- 373,661 · -20.1%
- By 2100
- 307,967 · -34.2%
Race, ethnicity, and origin ACS 2023
- Neighborhood character
- Predominantly White (87%)
- Race & ethnicity
- White 87% Two or more races 5% Hispanic / Latino 5% Black 4% Asian 1%
- Common ancestry
- Romanian 8% Lithuanian 4% Subsaharan African 3%
- Foreign-born
- 7% · Canada
- Languages at home
- 91% English-only · Russian/Polish/Slavic 3% Spanish 2% Arabic 1%
Political lean MEDSL · Onondaga
- 2024 margin
- D (+17.3) · D 58.6% · R 41.4%
- 2008→2024 swing
- -3.0pp toward R · 2008: 20.3pp · 2024: 17.3pp
- All cycles
- 2024: D+17.3 2020: D+20.6 2016: D+12.8 2012: D+21.1 2008: D+20.3
Not yet ingested
- Civics
- —
Market trends
- HPI YoY
- ▼ -77.80%
- Current HPI
- 300.7211
- Rent YoY
- —
- Metro
- Syracuse, NY
- State GDP YoY
- ▲ 2.60%
- F500 in state
- 92
Industry mix (Fortune 500 HQ in NY)
| Industry | F500 HQs | Revenue |
|---|---|---|
| Financial Services | 10 | $950B |
|
||
| Consumer Goods | 9 | $162B |
|
||
| Insurance | 4 | $225B |
|
||
| Telecommunications | 2 | $144B |
|
||
| Pharmaceuticals | 2 | $112B |
|
||
| Media / Entertainment | 2 | $69B |
|
||
Price history
3 events — show timeline
- 2026-05-28 Pending — CNYIS
- 2026-05-19 Contingent — CNYIS
- 2026-05-11 Listed $219,900 CNYIS
Property tax history
+12.3%/yrLatest (2025): $5,111 · +6.8% YoY. Source: county tax records.
Cash-flow waterfall
monthlySold comps — $/sqft
last 12 mo · ≤1 miLoading sold comps…