305 Polk Ave · Charleston, IL
Flood risk 1/10 · Minimal
- FEMA flood zone
- X (unshaded)
- Chance of flooding over 30 yrs
- 0.0%
- Est. flood insurance / yr
- $473 – $860
Fire risk 1/10 · Minimal
- Est. fire insurance / yr
- $804 – $1,492
Heat risk 4/10 · Minor
- Hot days now (above 105°F)
- 7 days/yr
- Hot days in 30 yrs
- 19 days/yr
Wind risk 2/10 · Minimal
- Chance of severe wind over 30 yrs
- 1.0%
Air-quality risk 2/10 · Minimal
- Unhealthy air days now
- 1 days/yr
- Unhealthy air days in 30 yrs
- 1 days/yr
Risk factors via First Street. Map © Google.
Why this score? — see what drove the B grade
The composite is a weighted blend of 9 inputs, each scored 0–100. Each bar is that input's sub-score; the figure is the points it added to the 100-point composite (weight × sub-score).
- Cash flow +29.2/30.0
- ARV discount +15.0/15.0
- DSCR +10.0/10.0
- 1% rule +9.3/10.0
- Livability +3.7/5.0
- Rent growth +2.5/5.0
- Condition / age +2.5/5.0
- Schools +1.4/10.0
- Appreciation +0.0/10.0
$72,000
🖨 Deal sheet 📄 Offer letter ✓ Due diligence
Listing remarks MLS
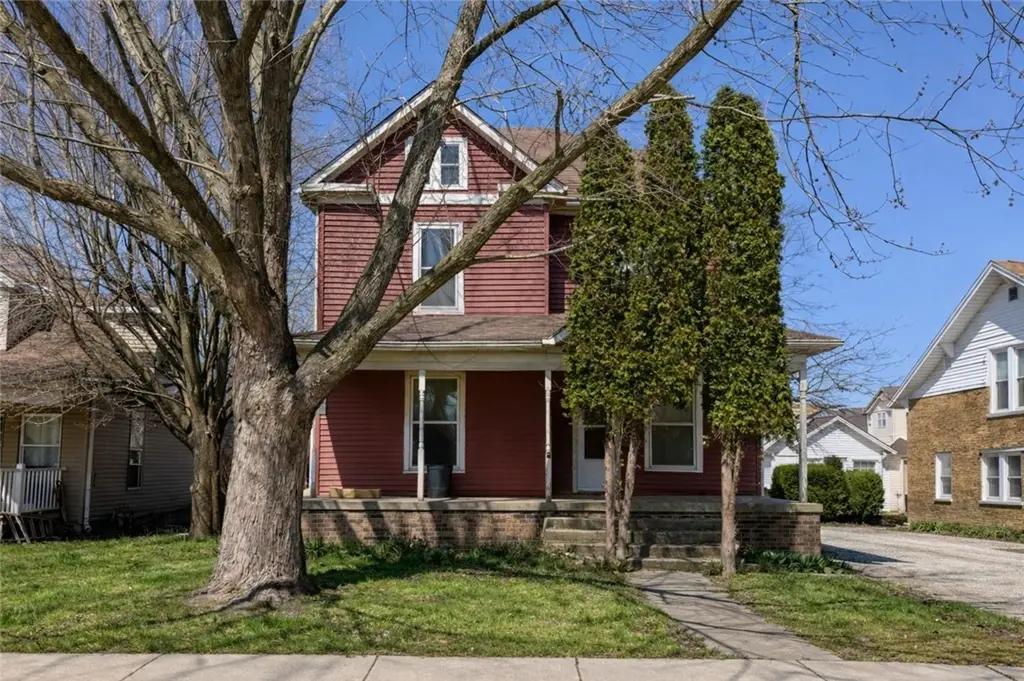
Timeless details. Unlimited potential. This 3-bedroom, 2-bath home offers a rare opportunity to bring new life to a property full of character and original detail. From the moment you arrive, the inviting front porch sets the tone—perfect for morning coffee or winding down in the evening. Inside, you’ll find hardwood floors, tall ceilings, and distinctive architectural features that reflect the home’s history. Built-in shelving, decorative columns, and detailed trim work create a strong foundation for someone with vision to restore and personalize. The layout offers spacious living and dining areas, along with a functional kitchen ready for updates. Upstairs and throughout the home, the bedrooms provide comfortable space with natural light, while the two full bathrooms offer convenience for everyday living. Whether you’re looking for a renovation project, investment opportunity, or a place to create something truly your own, this home presents incredible potential. With the right updates, it could be transformed into a standout property!
Key facts
- Detailed trim work
- Front porch
- Decorative columns
Tags
Neighborhood map
What this means for you Summary
Snapshot
- This is a 3-bed/2.0-bath single-family listed at $72k.
Deal economics
- At list price, monthly cash flow is $250 ($3k/yr) — positive.
- The deal already cash-flows at list — no discount required.
- Meets the 1% rule at list price ($1k rent vs $72k).
- Recommended offer: $68k (6.0% below list) — sets the bar for market timing.
- Cap rate 10.5% vs local median 4.0% in Charleston — top-decile yield for the area; either an underpriced asset or a hidden risk that comps aren't pricing in. Stress-test before assuming the spread holds.
Location & tenants
- Location reads 73/100 on livability (#293 in IL) — a middle-class / working-renter tenant base. Strengths: cost of living A+, housing A+, health & safety A+; Watch: crime C-, amenities C-, schools F.
- Charleston CUSD 1 (town): math 14% / reading 21% proficiency, ranked #489 of 620 in IL (top 79%) — low school quality limits family demand, transient renter base, plan for 1-2y turnover.
- Market conditions: 125 active listings in the ZIP; 1 comparable units currently listed for rent nearby; 34 units permitted in Coles County in 2024 (30 in 5+ unit buildings).
Forward outlook
- Local home prices are declining (-3.0%/yr); year-one equity from $498 of loan paydown is wiped out by about $2k of value loss. Plan a longer hold.
- Coles County population projected to shrink 7% by 2050 — rents likely to lag national; underwrite the cash flow, not the appreciation.
- At projected returns (-3.0% appreciation + 3.0% rent growth), your $20k cash investment doubles in ~8 years — after that, you're playing with house money.
Negotiation context
- It's been on market 83 days — a 6% lower offer ($68k) is reasonable based on typical stale-listing flexibility.
Risks & watch-outs
- Watch-outs: property tax is 2.6% of price; built in 1915 — expect roof / HVAC / electrical / plumbing capex.
Questions for the listing agent
- It's been on market 83 days. Have you received any prior offers? Is the seller open to a 6% concession, seller financing, or rate buy-down credit?
- Built in 1915 — when were the roof, HVAC, electrical panel, plumbing, and water heater last replaced?
- Property tax is high relative to price — has the assessment been appealed recently, and will the sale trigger a re-assessment?
- Why hasn't it sold? Are there any deal-killer items the seller is aware of (foundation, flood, title, zoning, code violations)?
- Is there a deadline driving the sale (1031 exchange, divorce, estate, relocation)? That informs how much negotiation room exists.
- Schools are F-rated, which usually means shorter tenancies and higher turnover. Who's the typical renter profile here, and what's been the actual vacancy rate?
- What's the average days-on-market for RENTAL listings here right now (not sales)? A rising rental-DOM trend means longer vacancies and softer asking-rent achievability than the comps imply.
- What's the recent tenant-quality profile in this submarket — average credit score on applications, eviction rate, late-payment / NSF rate, and stable-employment percentage? A property-management company in the area should have these aggregated.
- How much new for-sale + rental construction is in the pipeline within 1–3 miles? Heavy new supply typically softens prices + rents 12–24 months out; constrained supply supports both.
Investment metrics
- 1% rule
- 1.43% ✓
- Cap rate
- 10.46%
- Cash-on-cash
- 14.90%
- DSCR
- 1.66
- GRM
- 5.8
CMA / ARV
- ARV (median comp)
- $94,565
- List price
- $72,000
- Delta
- -23.86%
- Verdict
- UNDERPRICED
- Comps
- 20 within 1.0 mi
Show comp detail 12 sales within ~0.75 mi
| Address | Dist | Beds/Ba | Sqft | Sold | Price | $/sf | Match |
|---|---|---|---|---|---|---|---|
| 815 Van Buren Ave | 0.50mi | 3/2.0 | 1,594 (-1%) | 0mo | $87,500 | $55 | 75 |
| 6 Brosam Dr | 0.32mi | 3/2.0 | 1,728 (+7%) | 2mo | $152,500 | $88 | 71 |
| 620 4th St | 0.38mi | 4/2.5 (+1) | 1,639 (+2%) | 6mo | $89,900 | $55 | 67 |
| 29 Jackson Ave | 0.45mi | 3/1.5 | 1,511 (-6%) | 0mo | $93,900 | $62 | 67 |
| 920 E St | 0.48mi | 2/2.0 (-1) | 1,620 (+1%) | 8mo | $154,900 | $96 | 65 |
| 9 Brosam Dr | 0.34mi | 3/2.0 | 1,452 (-10%) | 7mo | $135,000 | $93 | 62 |
| 1130 Buchanan Ave | 0.49mi | 3/2.5 | 1,535 (-5%) | 9mo | $148,000 | $96 | 60 |
| 1015 10th St | 0.39mi | 4/2.0 (+1) | 1,786 (+11%) | 0mo | $212,000 | $119 | 58 |
| 409 3rd St | 0.51mi | 3/1.5 | 1,752 (+9%) | 5mo | $55,000 | $31 | 56 |
| 829 10th St | 0.43mi | 3/1.5 | 1,846 (+15%) | 4mo | $185,000 | $100 | 50 |
| 314 Adams Ave | 0.61mi | 2/1.5 (-1) | 1,476 (-8%) | 2mo | $50,000 | $34 | 49 |
| 1402 14th St | 0.59mi | 4/2.0 (+1) | 1,430 (-11%) | 5mo | $78,000 | $55 | 45 |
Match score weights: distance 35% · size 25% · config 20% · recency 20%. Top-matched comps best support the ARV.
Projected returns pro-forma
-3.0% appreciation · 3.0% rent growth · sell at horizon
- IRR
- 5.5%
- Equity multiple
- 1.21×
- Total profit
- $4,332
- Equity at exit
- $10,735
- IRR
- 15.0%
- Equity multiple
- 2.22×
- Total profit
- $24,530
- Equity at exit
- $6,225
Cash invested: $20,160 (down + closing). Projections, not guarantees.
Landlord ↔ Tenant lean methodology
- Overall (STATE)
- 43 Moderately Tenant-Leaning
- State Illinois
- 43 Moderately Tenant-Leaning · D+7
- County
- — inherits STATE
- City
- — inherits STATE
ZIP-level market 61920
- Home prices YoY
- -28.1%
- Active inventory
- 125
- Price-to-rent
- 5.8×
Monthly cashflow live
- Estimated rent
- $1,032 medium interval (Pro) →
- Mortgage (P&I)
- −$378
- Tax from tax record
- −$157 /mo · $1,886/yr
- Insurance
- −$30
- HOA
- −$0
- Vacancy / Maint / Mgmt
- −$217
- Net cashflow
- $250
Break-even live
UW: 25.0% down · 7.5% · 30yr · 1.5% tax · 5.0% vac · 8.0% maint · 8.0% mgmt
Financing live
Cash to close
- Down payment
- $18,000
- Closing costs
- $2,160
- Reserves months
- —
- Total cash needed
- —
Loan-product check · same deal, 3 products live
Conventional
25% down · 7.5% · 30yr
- Down + closing
- —
- Monthly P&I
- —
- Monthly cashflow
- —
- DSCR
- —
- Eligible?
- —
Personal DTI + credit; lowest rate.
DSCR
20% down · 8.5% · 30yr
- Down + closing
- —
- Monthly P&I
- —
- Monthly cashflow
- —
- DSCR
- —
- Eligible?
- —
No personal income docs; deal must DSCR.
Hard money
10% down · 12.0% · 12mo
- Down + closing
- —
- Monthly P&I
- —
- Monthly cashflow
- —
- DSCR
- —
- Eligible?
- —
Short-term bridge; refi at stabilization.
Rent comps 1 comps
| Address | Beds | Baths | Sqft | Rent | $/sqft | DOM | Units | Dist |
|---|---|---|---|---|---|---|---|---|
| 1408 6th St Charleston, IL | 2.0 | 1.0 | 1346 | $729 | $0.54 | 44d | 3 | 0.23mi |
Listing history 19 events
-
2026-06-19days on market $72,000 Active 83 DOM
-
2026-06-18days on market $72,000 Active 82 DOM
-
2026-06-18price $72,000 Active 81 DOM
-
2026-06-17days on market $75,000 Active 81 DOM
-
2026-06-16days on market $75,000 Active 80 DOM
-
2026-06-15days on market $75,000 Active 79 DOM
-
2026-06-14days on market $75,000 Active 77 DOM
-
2026-06-12days on market $75,000 Active 76 DOM
-
2026-06-09days on market $75,000 Active 73 DOM
-
2026-06-08days on market $75,000 Active 72 DOM
-
2026-06-07days on market $75,000 Active 71 DOM
-
2026-06-05days on market $75,000 Active 68 DOM
-
2026-06-03days on market $75,000 Active 67 DOM
-
2026-06-02days on market $75,000 Active 66 DOM
-
2026-06-01days on market $75,000 Active 65 DOM
-
2026-05-31days on market $75,000 Active 64 DOM
-
2026-05-30days on market $75,000 Active 63 DOM
-
2026-05-07historical Active Under Contract 1077-char remark
Show marketing remark (1077 chars)
Timeless details. Unlimited potential. This 3-bedroom, 2-bath home offers a rare opportunity to bring new life to a property full of character and original detail. From the moment you arrive, the inviting front porch sets the tone—perfect for morning coffee or winding down in the evening. Inside, you’ll find hardwood floors, tall ceilings, and distinctive architectural features that reflect the home’s history. Built-in shelving, decorative columns, and detailed trim work create a strong foundation for someone with vision to restore and personalize. The layout offers spacious living and dining areas, along with a functional kitchen ready for updates. Upstairs and throughout the home, the bedrooms provide comfortable space with natural light, while the two full bathrooms offer convenience for everyday living. Whether you’re looking for a renovation project, investment opportunity, or a place to create something truly your own, this home presents incredible potential. With the right updates, it could be transformed into a standout property!
-
2026-03-28$75,000 Active 1077-char remark
Show marketing remark (1077 chars)
Timeless details. Unlimited potential. This 3-bedroom, 2-bath home offers a rare opportunity to bring new life to a property full of character and original detail. From the moment you arrive, the inviting front porch sets the tone—perfect for morning coffee or winding down in the evening. Inside, you’ll find hardwood floors, tall ceilings, and distinctive architectural features that reflect the home’s history. Built-in shelving, decorative columns, and detailed trim work create a strong foundation for someone with vision to restore and personalize. The layout offers spacious living and dining areas, along with a functional kitchen ready for updates. Upstairs and throughout the home, the bedrooms provide comfortable space with natural light, while the two full bathrooms offer convenience for everyday living. Whether you’re looking for a renovation project, investment opportunity, or a place to create something truly your own, this home presents incredible potential. With the right updates, it could be transformed into a standout property!
ⓘ Source: listings_history table (triggers on properties + properties_extension) + one-shot
backfill from property_details.listing_events for pre-trigger history.
Tax reassessment forecast IL · Partial reset (capped growth)
- Current annual tax
- $1,886 · $157/mo
- Projected year-2 tax
- $1,886 · $157/mo
- Expected delta
- $0/yr ($0/mo · 0.0%)
ⓘ Screening estimate from a state-policy table — verify with the county assessor before closing.
Climate risk First Street
- Flood 1/10 Low FEMA zone X (unshaded) · 0% chance over 30 yrs
- Wildfire 1/10 Low
- Heat 4/10 Moderate 7 d/yr ≥105°F today · 19 d/yr by 30 yrs out
- Wind 2/10 Low 100% chance of damaging wind over 30 yrs
- Air quality 2/10 Low 1 unhealthy d/yr today · 1 by 30 yrs out
Nearby sold comps map
Loading sold comps map…
Walkable amenities ~0.75 mi
Loading nearby amenities…
Taxation est. · year 1
- Rental income
- $12,380
- − Mortgage interest
- −$4,033
- − Property taxes
- −$1,886
- − Insurance
- −$360
- − Repairs & maintenance
- −$990
- − Management
- −$990
- − Depreciation
- −$2,095
- Taxable income
- $2,026
- Est. tax owed @ 24.0%
- −$486
- After-tax cash flow
- $2,517/yr
For passive investors: Depreciation is non-cash, so a rental often shows a tax loss while cash-flowing — sheltering income. Rental losses are passive: they offset passive income freely, and up to $25,000/yr can offset ordinary (W-2) income if you actively participate and your MAGI is under $100k (phasing out to $0 by $150k); unused losses carry forward. On sale, claimed depreciation is recaptured at up to 25%, and gains may owe capital-gains tax (a 1031 exchange can defer both). Figures are a year-1 estimate at your 24.0% rate — not tax advice; consult a CPA.
Schools (NCES district)
- District
- Charleston CUSD 1
- NCES district ID
- 1709600
- Math proficiency
- 14% ▼ -6.00%
- Reading proficiency
- 21% ▼ -8.00%
- Median HH income
- $35,724
- Composite
- 14.45/100
- National rank
- #9429
- State rank
- #489 of 620 in IL
Livability — Charleston
- Score
- 73/100
- State rank
- #293
- US rank
- #5627
Category grades
Schools grade is shown separately in the Schools card above.
Census & demographics
- Census place
- Charleston, IL
- County
- Coles County · 41,301 people
- City population
- 20,951
- Metro
- Charleston-Mattoon, IL
- Population (ZIP)
- 20,951
- Household income
- $52,429
- Rent vs Own
- Severe rent burden
- 1209.0
Population outlook (Coles County) Hauer SSP2
- Today (2025)
- 53,967 people
- By 2030
- 53,829 · -0.3%
- By 2040
- 52,332 · -3.0%
- By 2050
- 49,989 · -7.4%
- By 2075
- 42,226 · -21.8%
- By 2100
- 34,675 · -35.7%
Race, ethnicity, and origin ACS 2023
- Neighborhood character
- Predominantly White (84%)
- Race & ethnicity
- White 84% Black 6% Hispanic / Latino 4% Two or more races 3% Asian 2%
- Common ancestry
- Italian 2% Romanian 2% Iranian 2%
- Foreign-born
- 4% · Canada, Jamaica
- Languages at home
- 95% English-only · Spanish 1% Other Indo-European 1%
Political lean MEDSL · Coles
- 2024 margin
- Strong R (+28.5) · D 34.9% · R 63.4% · Other 1.7%
- 2008→2024 swing
- -31.7pp toward R · 2008: 3.2pp · 2024: -28.5pp
- All cycles
- 2024: R+28.5 2020: R+26.4 2016: R+26.4 2012: R+11.1 2008: D+3.2
Not yet ingested
- Civics
- —
Market trends
- HPI YoY
- ▼ -59.97%
- Current HPI
- 153.8607
- Rent YoY
- —
- Metro
- Charleston-Mattoon, IL
- State GDP YoY
- ▲ 1.59%
- F500 in state
- 60
Industry mix (Fortune 500 HQ in IL)
| Industry | F500 HQs | Revenue |
|---|---|---|
| Insurance | 4 | $201B |
|
||
| Consumer Goods | 4 | $87B |
|
||
| Industrial Machinery | 3 | $64B |
|
||
| Healthcare | 2 | $55B |
|
||
| Retail / Pharmacy | 1 | $148B |
|
||
| Agriculture / Food | 1 | $86B |
|
||
Price history
2 events — show timeline
- 2026-05-07 Contingent — CIBR
- 2026-03-28 Listed $75,000 CIBR
Property tax history
-0.1%/yrLatest (2024): $1,886 · +4.0% YoY. Source: county tax records.
Cash-flow waterfall
monthlySold comps — $/sqft
last 12 mo · ≤1 miLoading sold comps…