 🏷️ Likely Rental
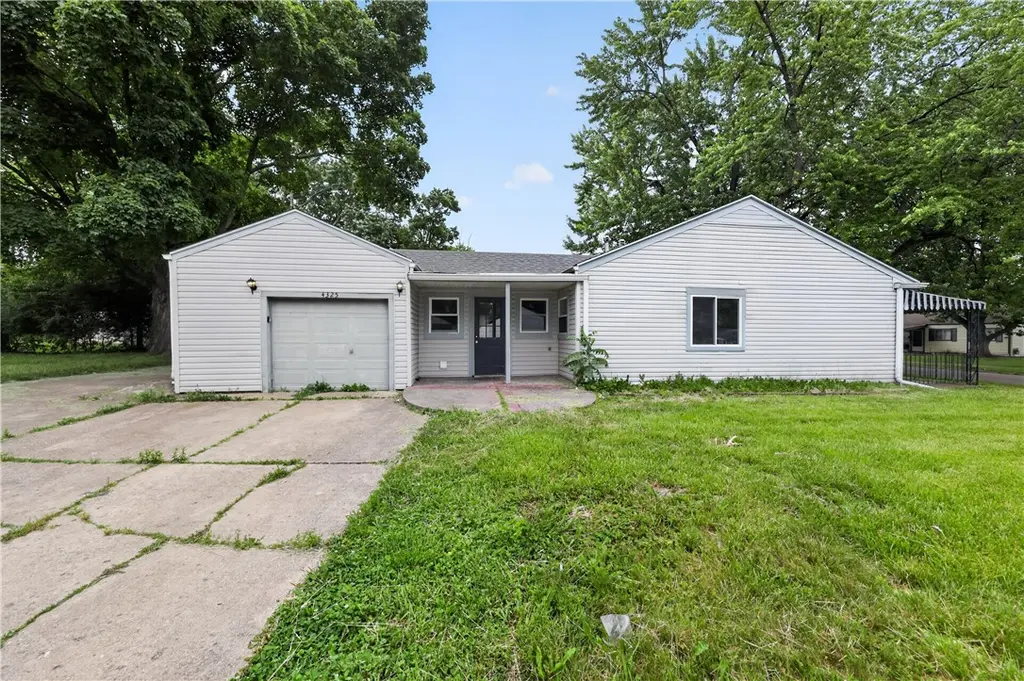
4325 Redonda Ln · Trotwood, OH
Flood risk 1/10 · Minimal
- FEMA flood zone
- X (unshaded)
- Chance of flooding over 30 yrs
- 0.0%
- Est. flood insurance / yr
- $507 – $1,088
Fire risk 1/10 · Minimal
- Est. fire insurance / yr
- $713 – $1,323
Heat risk 3/10 · Minor
- Hot days now (above 103°F)
- 7 days/yr
- Hot days in 30 yrs
- 19 days/yr
Wind risk 2/10 · Minimal
- Chance of severe wind over 30 yrs
- 0.0%
Air-quality risk 3/10 · Minor
- Unhealthy air days now
- 3 days/yr
- Unhealthy air days in 30 yrs
- 4 days/yr
Risk factors via First Street. Map © Google.
Why this score? — see what drove the B grade
The composite is a weighted blend of 9 inputs, each scored 0–100. Each bar is that input's sub-score; the figure is the points it added to the 100-point composite (weight × sub-score).
- Cash flow +30.0/30.0
- ARV discount +15.0/15.0
- DSCR +10.0/10.0
- 1% rule +8.7/10.0
- Livability +3.0/5.0
- Rent growth +2.5/5.0
- Condition / age +2.5/5.0
- Schools +1.3/10.0
- Appreciation +0.0/10.0
$99,900
🖨 Deal sheet (PDF) 📄 Offer letter ✓ Due diligence
Listing remarks MLS
If you're looking in Dayton for a nice investment property don't miss out on this one! 3 Bed and 1 bath with 1 car garage. Already renting at $530/monthly but w/ a long term and paying tenant. Additional room includes fireplace (not warranted). Owner pays water. Drive by only until offer accepted. Please do not approach tenant.
Key facts
- 7,549 sq ft lot
- Garage
- Built 1954
Property features AI
Finance
- Financial info: Offered for sale
Exterior
- Parking: Attached one-car garage
- Utilities: Public water; Sewer available
- Home design: Single-story home; Entry at level 1
- Construction: Aluminum siding, vinyl siding, brick and frame construction
- Exterior features: Front porch; Patio
Interior
- Kitchen: Range; Refrigerator
- Bedrooms: Main-level bedrooms (2): 11 x 9 and 9 x 8
- Bathrooms: One full bathroom (main level)
- Heating & cooling: Forced air heating; Central air conditioning
- Interior features: Double-hung insulated vinyl windows; Two fireplaces
Neighborhood map
What this means for you Summary
Snapshot
- This is a 3-bed/1.0-bath single-family listed at $100k.
Deal economics
- At list price, monthly cash flow is $416 ($5k/yr) — positive.
- The deal already cash-flows at list — no discount required.
- Meets the 1% rule at list price ($1k rent vs $100k).
- Cap rate 11.3% vs local median 6.5% in Trotwood — top-decile yield for the area; either an underpriced asset or a hidden risk that comps aren't pricing in. Stress-test before assuming the spread holds.
Location & tenants
- Location reads 59/100 on livability (#1,014 in OH) — a working-class tenant base; expect higher turnover. Strengths: cost of living A+, housing A; Watch: employment D, schools F, crime F.
- Dayton City (urban): math 12% / reading 21% proficiency, ranked #641 of 656 in OH (top 98%) — low school quality limits family demand, transient renter base, plan for 1-2y turnover; 74% free/reduced lunch — lower-income household profile, screen leases tightly.
- Market conditions: 29 active listings in the ZIP; 15 comparable units currently listed for rent nearby; rentals at typical pace (median 22d on market — plan ~3-4 weeks tenant-placement turnaround); 907 units permitted in Montgomery County in 2024 (416 in 5+ unit buildings).
- This rent runs 36% of the median local income ($46k/yr) — at the standard rent-burdened threshold; future hikes will face affordability resistance.
Forward outlook
- Local home prices are declining (-3.0%/yr); year-one equity from $691 of loan paydown is wiped out by about $3k of value loss. Plan a longer hold.
- Montgomery County population projected at -10% by 2050 — secular population decline; favor cash flow + early exit over multi-decade hold.
- At projected returns (-3.0% appreciation + 3.0% rent growth), your $28k cash investment doubles in ~7 years — after that, you're playing with house money.
Negotiation context
- Only 7 days on market — expect competitive offers; lowballing is unlikely to land.
- 3 sale attempts since 5y ago with the ask held roughly flat each time — persistent listings suggest the price (not the market) is what's stuck; bring a comps-based counter.
Risks & watch-outs
- Watch-outs: built in 1954 — expect roof / HVAC / electrical / plumbing capex.
Questions for the listing agent
- Built in 1954 — when were the roof, HVAC, electrical panel, plumbing, and water heater last replaced?
- Is there a deadline driving the sale (1031 exchange, divorce, estate, relocation)? That informs how much negotiation room exists.
- Schools are F-rated, which usually means shorter tenancies and higher turnover. Who's the typical renter profile here, and what's been the actual vacancy rate?
- Crime grade is F in this area — have there been break-ins, vandalism, or insurance claims at this property in the last 3 years? What carrier currently insures it and at what premium?
- What's the average days-on-market for RENTAL listings here right now (not sales)? A rising rental-DOM trend means longer vacancies and softer asking-rent achievability than the comps imply.
- What's the recent tenant-quality profile in this submarket — average credit score on applications, eviction rate, late-payment / NSF rate, and stable-employment percentage? A property-management company in the area should have these aggregated.
- How much new for-sale + rental construction is in the pipeline within 1–3 miles? Heavy new supply typically softens prices + rents 12–24 months out; constrained supply supports both.
Investment metrics
- 1% rule
- 1.37% ✓
- Cap rate
- 11.29%
- Cash-on-cash
- 17.83%
- DSCR
- 1.79
- GRM
- 6.1
CMA / ARV
- ARV (on-the-fly)
- $134,368
- Comps found
- 12
Show comp detail 12 sales within ~0.75 mi
| Address | Dist | Beds/Ba | Sqft | Sold | Price | $/sf | Match |
|---|---|---|---|---|---|---|---|
| 4351 Redonda Ln | 0.03mi | 3/1.0 | 1,152 (-11%) | 5mo | $54,500 | $47 | 77 |
| 3925 Haney Rd | 0.58mi | 3/1.0 | 1,280 (-1%) | 3mo | $137,000 | $107 | 69 |
| 4237 Nevada Ave | 0.16mi | 3/1.5 | 1,450 (+12%) | 4mo | $127,000 | $88 | 66 |
| 4235 Merryfield Ave | 0.14mi | 3/2.5 | 1,448 (+12%) | 5mo | $189,000 | $131 | 63 |
| 4180 Indian Ln | 0.47mi | 4/1.0 (+1) | 1,248 (-3%) | 6mo | $124,900 | $100 | 62 |
| 4856 Shadwell Dr | 0.52mi | 4/1.5 (+1) | 1,339 (+4%) | 1mo | $155,000 | $116 | 62 |
| 4616 Channing Ln | 0.60mi | 3/1.0 | 1,343 (+4%) | 5mo | $140,000 | $104 | 62 |
| 2413 Archwood Dr | 0.62mi | 3/1.0 | 1,377 (+7%) | 1mo | $100,100 | $73 | 60 |
| 4029 Brumbaugh Blvd | 0.55mi | 3/2.0 | 1,343 (+4%) | 6mo | $175,881 | $131 | 59 |
| 2521 Arlene Ave | 0.49mi | 3/1.0 | 1,176 (-9%) | 4mo | $100,500 | $85 | 59 |
| 4534 N Fairgreen Dr | 0.66mi | 3/2.0 | 1,374 (+6%) | 1mo | $198,900 | $145 | 54 |
| 3821 Denlinger | 0.68mi | 3/1.5 | 1,432 (+11%) | 4mo | $115,000 | $80 | 45 |
Match score weights: distance 35% · size 25% · config 20% · recency 20%. Top-matched comps best support the ARV.
Projected returns pro-forma
-3.0% appreciation · 3.0% rent growth · sell at horizon
- IRR
- 9.3%
- Equity multiple
- 1.37×
- Total profit
- $10,286
- Equity at exit
- $14,895
- IRR
- 18.5%
- Equity multiple
- 2.54×
- Total profit
- $43,059
- Equity at exit
- $8,638
Cash invested: $27,972 (down + closing). Projections, not guarantees.
Landlord ↔ Tenant lean methodology
- Overall (STATE)
- 73 Landlord-Friendly
- State Ohio
- 73 Landlord-Friendly · R+6
- County
- — inherits STATE
- City
- — inherits STATE
ZIP-level market 45416
- Home prices YoY
- -26.1%
- Active inventory
- 29
- Price-to-rent
- 6.1×
Monthly cashflow live
- Estimated rent
- $1,366 high interval (Pro) →
- Mortgage (P&I)
- −$524
- Tax from tax record
- −$98 /mo · $1,178/yr
- Insurance
- −$42
- HOA
- −$0
- Vacancy / Maint / Mgmt
- −$287
- Net cashflow
- $416
Break-even live
Sensitivity live
| Price | -10% $472 | -5% $444 | +0% $416 | +5% $387 | +10% $359 |
|---|---|---|---|---|---|
| Rent | -10% $308 | -5% $362 | +0% $416 | +5% $470 | +10% $524 |
| Rate | -1.0pp $466 | -0.5pp $441 | base $416 | +0.5pp $390 | +1.0pp $363 |
UW: 25.0% down · 7.5% · 30yr · 1.5% tax · 5.0% vac · 8.0% maint · 8.0% mgmt
Financing live
Cash to close
- Down payment
- $24,975
- Closing costs
- $2,997
- Reserves months
- —
- Total cash needed
- —
Loan-product check · same deal, 3 products live
Conventional
25% down · 7.5% · 30yr
- Down + closing
- —
- Monthly P&I
- —
- Monthly cashflow
- —
- DSCR
- —
- Eligible?
- —
Personal DTI + credit; lowest rate.
DSCR
20% down · 8.5% · 30yr
- Down + closing
- —
- Monthly P&I
- —
- Monthly cashflow
- —
- DSCR
- —
- Eligible?
- —
No personal income docs; deal must DSCR.
Hard money
10% down · 12.0% · 12mo
- Down + closing
- —
- Monthly P&I
- —
- Monthly cashflow
- —
- DSCR
- —
- Eligible?
- —
Short-term bridge; refi at stabilization.
Rent comps 15 comps
| Address | Beds | Baths | Sqft | Rent | $/sqft | DOM | Units | Dist |
|---|---|---|---|---|---|---|---|---|
| 4246 Redonda Ln Dayton, OH | 3.0 | 1.0 | 1600 | $1,495 | $0.93 | 44d | 1 | 0.08mi |
| 4132 Natchez Ave Dayton, OH | 3.0 | 1.5 | 991 | $1,250 | $1.26 | 4d | 1 | 0.23mi |
| 4916 Copeland Ave Dayton, OH | 3.0 | 1.5 | 1515 | $1,125 | $0.74 | 12d | 1 | 0.51mi |
| 4527 Channing Ln Dayton, OH | 3.0 | 1.0 | 946 | $1,600 | $1.69 | 44d | 1 | 0.51mi |
| 3668 Castano Dr Dayton, OH | 3.0 | 2.0 | 1608 | $1,600 | $1.00 | 3d | 1 | 0.60mi |
| 5112 W Hillcrest Ave Unit 1 Dayton, OH | 3.0 | 1.0 | 972 | $700 | $0.72 | 24d | 1 | 0.80mi |
| 4003 Whitestone Ct Dayton, OH | 3.0 | 1.0 | 1096 | $1,275 | $1.16 | 44d | 1 | 0.84mi |
| 4161 Mapleleaf Dr Dayton, OH | 3.0 | 1.0 | 960 | $1,250 | $1.30 | 3d | 1 | 0.88mi |
| 2609 Fairport Ave Dayton, OH | 3.0 | 1.0 | 1000 | $1,025 | $1.02 | 3d | 1 | 0.89mi |
| 2002 Val Vista Ct Dayton, OH | 3.0 | 1.0 | 975 | $1,095 | $1.12 | 22d | 1 | 0.98mi |
| 4446 Waymire Ave Dayton, OH | 3.0 | 1.0 | 1100 | $1,100 | $1.00 | 22d | 1 | 0.98mi |
| 4629 Queens Ave Dayton, OH | 2.0 | 1.0 | 900 | $1,100 | $1.22 | 44d | 1 | 1.15mi |
| 3031 Garvin Rd Unit C Dayton, OH | 2.0 | 2.0 | 1269 | $1,150 | $0.91 | 44d | 1 | 1.33mi |
| 5200 Greencroft Dr Dayton, OH | 2.0 | 2.0 | 1116 | $1,200 | $1.08 | 3d | 1 | 1.37mi |
| 5200 Greencroft Dr Dayton, OH | 2.0 | 2.0 | 1115 | $1,200 | $1.08 | 22d | 1 | 1.37mi |
Listing history 7 events
-
2026-06-18days on market $99,900 Active 7 DOM
-
2026-06-17days on market $99,900 Active 6 DOM
-
2026-06-16days on market $99,900 Active 5 DOM
-
2026-06-15days on market $99,900 Active 4 DOM
-
2026-06-14days on market $99,900 Active 2 DOM
-
2026-06-13remarks 435-char remark
-
2026-06-13$99,900 Active 1 DOM
ⓘ Source: listings_history table (triggers on properties + properties_extension) + one-shot
backfill from property_details.listing_events for pre-trigger history.
Tax reassessment forecast OH · Partial reset (capped growth)
- Current annual tax
- $1,178 · $98/mo
- Projected year-2 tax
- $1,368 · $114/mo
- Expected delta
- +$190/yr (+$16/mo · 16.2%)
ⓘ Screening estimate from a state-policy table — verify with the county assessor before closing.
Climate risk First Street
- Flood 1/10 Low FEMA zone X (unshaded) · 0% chance over 30 yrs
- Wildfire 1/10 Low
- Heat 3/10 Moderate 7 d/yr ≥103°F today · 19 d/yr by 30 yrs out
- Wind 2/10 Low 0% chance of damaging wind over 30 yrs
- Air quality 3/10 Moderate 3 unhealthy d/yr today · 4 by 30 yrs out
Nearby sold comps map
Loading sold comps map…
Walkable amenities ~0.75 mi
Loading nearby amenities…
Taxation est. · year 1
- Rental income
- $16,394
- − Mortgage interest
- −$5,596
- − Property taxes
- −$1,178
- − Insurance
- −$500
- − Repairs & maintenance
- −$1,312
- − Management
- −$1,312
- − Depreciation
- −$2,906
- Taxable income
- $3,591
- Est. tax owed @ 24.0%
- −$862
- After-tax cash flow
- $4,125/yr
For passive investors: Depreciation is non-cash, so a rental often shows a tax loss while cash-flowing — sheltering income. Rental losses are passive: they offset passive income freely, and up to $25,000/yr can offset ordinary (W-2) income if you actively participate and your MAGI is under $100k (phasing out to $0 by $150k); unused losses carry forward. On sale, claimed depreciation is recaptured at up to 25%, and gains may owe capital-gains tax (a 1031 exchange can defer both). Figures are a year-1 estimate at your 24.0% rate — not tax advice; consult a CPA.
Schools (NCES district)
- District
- Dayton City
- NCES district ID
- 3904384
- Math proficiency
- 12% ▼ -12.00%
- Reading proficiency
- 21% ▼ -11.00%
- Median HH income
- $28,688
- Composite
- 12.94/100
- National rank
- #9579
- State rank
- #641 of 656 in OH
Livability — Trotwood
- Score
- 59/100
- State rank
- #1014
- US rank
- #20073
Category grades
Schools grade is shown separately in the Schools card above.
Census & demographics
- Census place
- Trotwood, OH
- County
- Montgomery County · 459,541 people
- City population
- 19,754
- Metro
- Dayton-Kettering, OH
- Population (ZIP)
- 5,640
- Household income
- $46,174
- Rent vs Own
- Severe rent burden
- 172.0
Population outlook (Montgomery County) Hauer SSP2
- Today (2025)
- 523,241 people
- By 2030
- 514,948 · -1.6%
- By 2040
- 493,378 · -5.7%
- By 2050
- 469,639 · -10.2%
- By 2075
- 418,360 · -20.0%
- By 2100
- 353,315 · -32.5%
Race, ethnicity, and origin ACS 2023
- Neighborhood character
- Diverse neighborhood (Simpson 0.58)
- Race & ethnicity
- Black 62% White 18% Two or more races 15% Hispanic / Latino 5%
- Hispanic origin (detail)
- Mexican 1% Puerto Rican 2%
- Common ancestry
- Lithuanian 1%
- Foreign-born
- 2%
- Languages at home
- 95% English-only · Spanish 3% French/Haitian/Cajun 1% Other Indo-European 1%
Political lean MEDSL · Montgomery
- 2024 margin
- Toss-up / Even · D 49.8% · R 49.3%
- 2008→2024 swing
- -5.8pp toward R · 2008: 6.2pp · 2024: 0.5pp
- All cycles
- 2024: D+0.5 2020: D+2.2 2016: R+1.2 2012: D+3.1 2008: D+6.2
Not yet ingested
- Civics
- —
Market trends
- HPI YoY
- ▼ -61.27%
- Current HPI
- 173.5938
- Rent YoY
- —
- Metro
- Dayton-Kettering, OH
- State GDP YoY
- ▲ 1.98%
- F500 in state
- 48
Industry mix (Fortune 500 HQ in OH)
| Industry | F500 HQs | Revenue |
|---|---|---|
| Insurance | 3 | $145B |
|
||
| Industrial Machinery | 3 | $49B |
|
||
| Financial Services | 3 | $24B |
|
||
| Consumer Goods | 2 | $93B |
|
||
| Aerospace / Defense | 2 | $47B |
|
||
| Utilities | 2 | $33B |
|
||
Price history
+66.8% since first listed8 events — show timeline
- 2026-06-11 Listed $99,900 Dayton MLS
- 2024-10-18 Sold (Public Records) $9,179,000 Public Records
- 2021-07-07 Sold (MLS) $50,000 Dayton MLS
- 2021-07-07 Sold (MLS) $50,000 Dayton MLS
- 2021-06-14 Pending — Dayton MLS
- 2021-06-02 Relisted — Dayton MLS
- 2021-05-26 Pending — Dayton MLS
- 2021-05-25 Listed $59,900 Dayton MLS
Property tax history
+5.2%/yrLatest (2025): $1,178 · -0.2% YoY. Source: county tax records.
Cash-flow waterfall
monthlySold comps — $/sqft
last 12 mo · ≤1 miLoading sold comps…