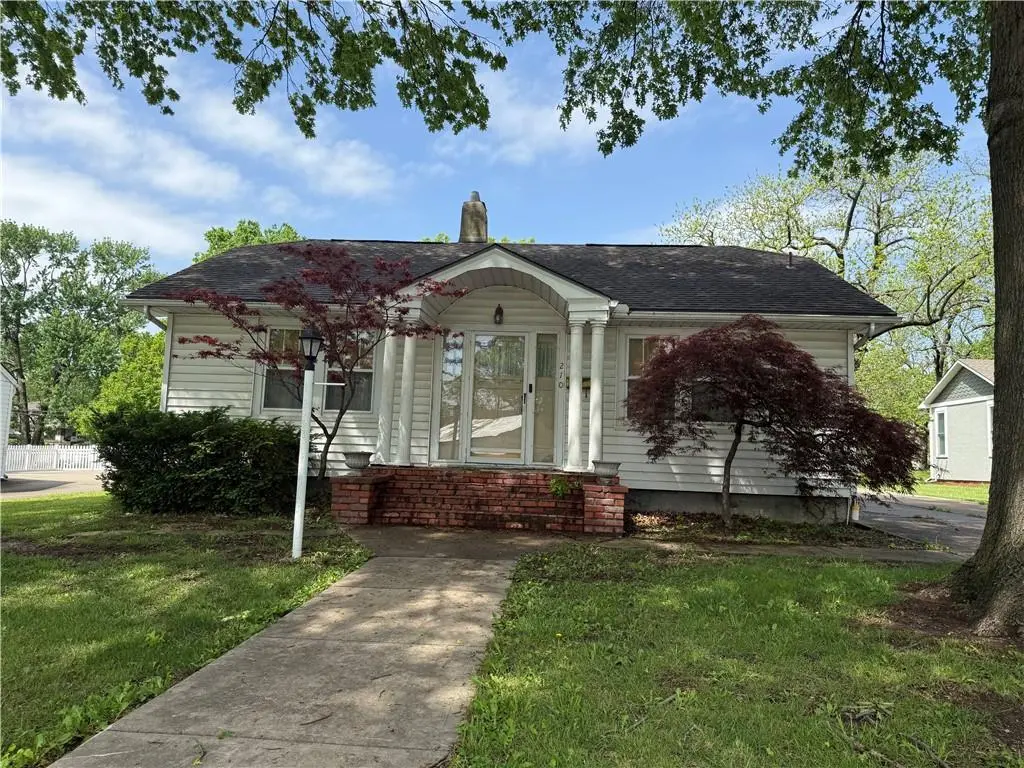
210 S Scott Ave · Belton, MO
Flood risk 1/10 · Minimal
- FEMA flood zone
- X (unshaded)
- Chance of flooding over 30 yrs
- 0.0%
- Est. flood insurance / yr
- $473 – $860
Fire risk 2/10 · Minimal
- Est. fire insurance / yr
- $1,054 – $1,958
Heat risk 4/10 · Minor
- Hot days now (above 107°F)
- 7 days/yr
- Hot days in 30 yrs
- 17 days/yr
Wind risk 2/10 · Minimal
- Chance of severe wind over 30 yrs
- —
Air-quality risk 2/10 · Minimal
- Unhealthy air days now
- 2 days/yr
- Unhealthy air days in 30 yrs
- 2 days/yr
Risk factors via First Street. Map © Google.
Why this score? — see what drove the D+ grade
The composite is a weighted blend of 9 inputs, each scored 0–100. Each bar is that input's sub-score; the figure is the points it added to the 100-point composite (weight × sub-score).
- Cash flow +14.1/30.0
- ARV discount +11.8/15.0
- DSCR +4.3/10.0
- Rent growth +3.8/5.0
- Livability +3.8/5.0
- 1% rule +3.3/10.0
- Schools +3.0/10.0
- Condition / age +2.5/5.0
- Appreciation +0.0/10.0
$285,000
🖨 Deal sheet (PDF) 📄 Offer letter ✓ Due diligence
Listing remarks MLS
Beautiful blend of old & new-all above average amenities & in pristine condition! Gourmet kitchen features Cherry cabinets & granite countertops. Numerous built-ins thru' out, wood inlay ceilings, walk-in double shower & cedar lined closet. 2 car attached garage + workshop is handy person's dream! 15'x 9'6" screened porch, 12x8 deck, 1/2 bath is in partially finished workshop-not included in SF. Subject to seller acquiring home they have chosen.
Key facts
- 9,583 sq ft lot
- 2 garage spots
- Built 1924
Property features AI
Finance
- Other: Not in a flood plain
- Financial info: Property taxes listed (see listing for current amount)
- HOA & community: No association (N/A)
Exterior
- Parking: Attached garage that faces front; 2-car garage
- Security: Smoke detectors
- Utilities: City/public water (verify); Public sewer
- Home design: Single-family residence; Ranch floor plan; Property faces east; Attached property
- Construction: Frame construction with vinyl siding; Composition roof
- Exterior features: Deck; Patio; Screened porch; City lot; Level lot; Paved road access
Interior
- Kitchen: Dishwasher; Disposal; Double oven; Exhaust fan; Electric range; Eat-in kitchen and breakfast area
- Bedrooms: 3 bedrooms
- Flooring: Wood floors
- Bathrooms: 2 full bathrooms; 1 half bathroom
- Heating & cooling: Natural gas heating; Forced air; Electric cooling (central)
- Interior features: Cedar closet; Ceiling fans; Central vacuum; Pantry; Vaulted ceilings; Walk-in closets; Wet bar; Storm doors; Window coverings; Storm windows; Wood windows
- Laundry & utility: Main-level laundry
Neighborhood map
What this means for you Summary
Snapshot
- This is a 3-bed/2.5-bath single-family listed at $285k.
Deal economics
- At list price, monthly cash flow is $43 ($518/yr) — positive.
- The deal already cash-flows at list — no discount required.
- To meet the 1% rule (rent ≥ 1% of price), the offer needs to be $235k (17.5% below list).
- Recommended offer: $235k (17.5% below list) — sets the bar for 1% rule.
- Cap rate 6.5% vs local median 4.7% in Belton — top-decile yield for the area; either an underpriced asset or a hidden risk that comps aren't pricing in. Stress-test before assuming the spread holds.
Location & tenants
- Location reads 76/100 on livability (#52 in MO, #3,782 nationally) — a middle-class / working-renter tenant base. Strengths: cost of living A+, housing A+, health & safety A+; Watch: crime C-, commute F.
- Belton 124 (suburban): math 28% / reading 39% proficiency, ranked #216 of 324 in MO (top 67%) — families likely to look elsewhere, expect single-tenant / working-renter base with shorter leases.
- Zoned schools: Gladden Elem. (math 22% / reading 32%, grade F, #850 of 1,115 statewide, top 78%, 382 students, 59% FRL); Belton High (math 27% / reading 59%, grade F, #211 of 521 statewide, top 41%, 1,374 students, 42% FRL).
- Market conditions: Rents rising fast (+5.2%/yr); 204 active listings in the ZIP; 4 comparable units currently listed for rent nearby; rentals at typical pace (median 22d on market — plan ~3-4 weeks tenant-placement turnaround); 588 units permitted in Cass County in 2024 (0 in 5+ unit buildings).
- This rent runs 39% of the median local income ($72k/yr) — at the standard rent-burdened threshold; future hikes will face affordability resistance.
Forward outlook
- Local home prices are declining (-3.0%/yr); year-one equity from $2k of loan paydown is wiped out by about $9k of value loss. Plan a longer hold.
- Cass County population projected to shrink 3% by 2050 — rents likely to lag national; underwrite the cash flow, not the appreciation.
Negotiation context
- Only 1 days on market — expect competitive offers; lowballing is unlikely to land.
- 2 sale attempts since 22y ago with the ask held roughly flat each time — persistent listings suggest the price (not the market) is what's stuck; bring a comps-based counter.
Risks & watch-outs
- Watch-outs: built in 1924 — expect roof / HVAC / electrical / plumbing capex.
Questions for the listing agent
- Built in 1924 — when were the roof, HVAC, electrical panel, plumbing, and water heater last replaced?
- Is there a deadline driving the sale (1031 exchange, divorce, estate, relocation)? That informs how much negotiation room exists.
- Schools are D-rated, which usually means shorter tenancies and higher turnover. Who's the typical renter profile here, and what's been the actual vacancy rate?
- The area grade is low — what's the realistic commute time and amenity access for the typical tenant pool here? Any planned neighborhood developments (good or bad) we should know about?
- What's the average days-on-market for RENTAL listings here right now (not sales)? A rising rental-DOM trend means longer vacancies and softer asking-rent achievability than the comps imply.
- What's the recent tenant-quality profile in this submarket — average credit score on applications, eviction rate, late-payment / NSF rate, and stable-employment percentage? A property-management company in the area should have these aggregated.
- How much new for-sale + rental construction is in the pipeline within 1–3 miles? Heavy new supply typically softens prices + rents 12–24 months out; constrained supply supports both.
Investment metrics
- 1% rule
- 0.83% ✗
- Cap rate
- 6.47%
- Cash-on-cash
- 0.65%
- DSCR
- 1.03
- GRM
- 10.1
CMA / ARV
- ARV (on-the-fly)
- $315,248
- Comps found
- 12
Show comp detail 12 sales within ~0.75 mi
| Address | Dist | Beds/Ba | Sqft | Sold | Price | $/sf | Match |
|---|---|---|---|---|---|---|---|
| 210 S Scott Ave | 0.00mi | 3/2.5 | 2,584 (0%) | 1mo | $285,000 | $110 | 100 |
| 104 London Way | 0.54mi | 3/3.0 | 2,487 (-4%) | 1mo | $299,000 | $120 | 66 |
| 311 Berry Ave | 0.57mi | 3/3.0 | 2,484 (-4%) | 7mo | $300,000 | $121 | 59 |
| 211 Dawn Ave | 0.48mi | 3/3.0 | 2,476 (-4%) | 13mo | $339,000 | $137 | 58 |
| 101 London Way | 0.52mi | 3/2.5 | 2,424 (-6%) | 16mo | $289,900 | $120 | 52 |
| 505 Concord St | 0.64mi | 3/2.5 | 2,480 (-4%) | 16mo | $295,000 | $119 | 50 |
| 209 Hillcrest Rd | 0.60mi | 4/2.5 (+1) | 2,437 (-6%) | 12mo | $325,000 | $133 | 47 |
| 102 London Way | 0.55mi | 3/3.0 | 2,327 (-10%) | 14mo | $325,000 | $140 | 44 |
| 306 Hawthorne Ct | 0.57mi | 4/3.0 (+1) | 2,350 (-9%) | 10mo | $320,000 | $136 | 43 |
| 306 Sunset Ln | 0.57mi | 3/2.0 | 2,370 (-8%) | 19mo | $310,000 | $131 | 42 |
| 524 Oxford Ct | 0.73mi | 4/3.0 (+1) | 2,436 (-6%) | 12mo | $297,000 | $122 | 40 |
| 601 Eldorado Cir | 0.67mi | 4/3.0 (+1) | 2,970 (+15%) | 8mo | $300,000 | $101 | 31 |
Match score weights: distance 35% · size 25% · config 20% · recency 20%. Top-matched comps best support the ARV.
Projected returns pro-forma
-3.0% appreciation · 5.17% rent growth · sell at horizon
- IRR
- -13.1%
- Equity multiple
- 0.52×
- Total profit
- $-38,249
- Equity at exit
- $42,494
- IRR
- -1.3%
- Equity multiple
- 0.91×
- Total profit
- $-7,510
- Equity at exit
- $24,642
Cash invested: $79,800 (down + closing). Projections, not guarantees.
Landlord ↔ Tenant lean methodology
- Overall (STATE)
- 81 Strongly Landlord-Friendly
- State Missouri
- 81 Strongly Landlord-Friendly · R+10
- County
- — inherits STATE
- City
- — inherits STATE
ZIP-level market 64012
- Rents YoY
- 5.2%
- Active inventory
- 204
- Price-to-rent
- 10.1×
Monthly cashflow live
- Estimated rent
- $2,351 medium interval (Pro) →
- Mortgage (P&I)
- −$1,495
- Tax from tax record
- −$201 /mo · $2,415/yr
- Insurance
- −$119
- HOA
- −$0
- Vacancy / Maint / Mgmt
- −$494
- Net cashflow
- $43
Break-even live
Sensitivity live
| Price | -10% $204 | -5% $124 | +0% $43 | +5% $-38 | +10% $-118 |
|---|---|---|---|---|---|
| Rent | -10% $-143 | -5% $-50 | +0% $43 | +5% $136 | +10% $229 |
| Rate | -1.0pp $187 | -0.5pp $116 | base $43 | +0.5pp $-31 | +1.0pp $-106 |
UW: 25.0% down · 7.5% · 30yr · 1.5% tax · 5.0% vac · 8.0% maint · 8.0% mgmt
Financing live
Cash to close
- Down payment
- $71,250
- Closing costs
- $8,550
- Reserves months
- —
- Total cash needed
- —
Loan-product check · same deal, 3 products live
Conventional
25% down · 7.5% · 30yr
- Down + closing
- —
- Monthly P&I
- —
- Monthly cashflow
- —
- DSCR
- —
- Eligible?
- —
Personal DTI + credit; lowest rate.
DSCR
20% down · 8.5% · 30yr
- Down + closing
- —
- Monthly P&I
- —
- Monthly cashflow
- —
- DSCR
- —
- Eligible?
- —
No personal income docs; deal must DSCR.
Hard money
10% down · 12.0% · 12mo
- Down + closing
- —
- Monthly P&I
- —
- Monthly cashflow
- —
- DSCR
- —
- Eligible?
- —
Short-term bridge; refi at stabilization.
Rent comps 4 comps
| Address | Beds | Baths | Sqft | Rent | $/sqft | DOM | Units | Dist |
|---|---|---|---|---|---|---|---|---|
| 214 Lacy Ln Belton, MO | 3.0 | 2.5 | 2562 | $2,455 | $0.96 | 22d | 1 | 0.32mi |
| 117 Monroe Ave Belton, MO | 3.0 | 2.5 | 1972 | $1,950 | $0.99 | 8d | 1 | 0.91mi |
| 805 Emerson Dr Belton, MO | 4.0 | 3.0 | 1942 | $2,355 | $1.21 | 13d | 1 | 0.91mi |
| 610 Winter Dr Belton, MO | 4.0 | 3.0 | 1959 | $2,673 | $1.36 | 24d | 1 | 1.01mi |
Listing history 4 events
-
2026-05-08status Pending
-
2026-05-08$285,000 Active
-
2004-05-27soldstatus 478-char remark
Show marketing remark (478 chars)
Beautiful blend of old & new-all above average amenities & in pristine condition! Gourmet kitchen features Cherry cabinets & granite countertops. Numerous built-ins thru' out, wood inlay ceilings, walk-in double shower & cedar lined closet. 2 car attached garage + workshop is handy person's dream! 15'x 9'6" screened porch, 12x8 deck, 1/2 bath is in partially finished workshop-not included in SF. Subject to seller acquiring home they have chosen.
-
2004-04-17$159,950 478-char remark
Show marketing remark (478 chars)
Beautiful blend of old & new-all above average amenities & in pristine condition! Gourmet kitchen features Cherry cabinets & granite countertops. Numerous built-ins thru' out, wood inlay ceilings, walk-in double shower & cedar lined closet. 2 car attached garage + workshop is handy person's dream! 15'x 9'6" screened porch, 12x8 deck, 1/2 bath is in partially finished workshop-not included in SF. Subject to seller acquiring home they have chosen.
ⓘ Source: listings_history table (triggers on properties + properties_extension) + one-shot
backfill from property_details.listing_events for pre-trigger history.
Tax reassessment forecast MO · Resets to sale price
- Current annual tax
- $2,415 · $201/mo
- Projected year-2 tax
- $2,764 · $230/mo
- Expected delta
- +$350/yr (+$29/mo · 14.5%)
ⓘ Screening estimate from a state-policy table — verify with the county assessor before closing.
Climate risk First Street
- Flood 1/10 Low FEMA zone X (unshaded) · 0% chance over 30 yrs
- Wildfire 2/10 Low
- Heat 4/10 Moderate 7 d/yr ≥107°F today · 17 d/yr by 30 yrs out
- Wind 2/10 Low
- Air quality 2/10 Low 2 unhealthy d/yr today · 2 by 30 yrs out
Nearby sold comps map
Loading sold comps map…
Walkable amenities ~0.75 mi
Loading nearby amenities…
Taxation est. · year 1
- Rental income
- $28,218
- − Mortgage interest
- −$15,964
- − Property taxes
- −$2,415
- − Insurance
- −$1,425
- − Repairs & maintenance
- −$2,257
- − Management
- −$2,257
- − Depreciation
- −$8,291
- Taxable loss
- −$4,392
- Est. tax savings @ 24.0%
- +$1,054
- After-tax cash flow
- $1,572/yr
For passive investors: Depreciation is non-cash, so a rental often shows a tax loss while cash-flowing — sheltering income. Rental losses are passive: they offset passive income freely, and up to $25,000/yr can offset ordinary (W-2) income if you actively participate and your MAGI is under $100k (phasing out to $0 by $150k); unused losses carry forward. On sale, claimed depreciation is recaptured at up to 25%, and gains may owe capital-gains tax (a 1031 exchange can defer both). Figures are a year-1 estimate at your 24.0% rate — not tax advice; consult a CPA.
Schools (NCES district)
- District
- Belton 124
- NCES district ID
- 2904620
- Math proficiency
- 28% ▼ -9.00%
- Reading proficiency
- 39% ▼ -9.00%
- Median HH income
- $56,946
- Composite
- 29.73/100
- National rank
- #6446
- State rank
- #216 of 324 in MO
Livability — Belton
- Score
- 76/100
- State rank
- #52
- US rank
- #3782
Category grades
Schools grade is shown separately in the Schools card above.
Census & demographics
- Census place
- Belton, MO
- County
- Cass County · 65,358 people
- City population
- 29,304
- Metro
- Kansas City, MO-KS
- Population (ZIP)
- 29,304
- Household income
- $71,814
- Rent vs Own
- Severe rent burden
- 1081.0
Population outlook (Cass County) Hauer SSP2
- Today (2025)
- 105,292 people
- By 2030
- 106,109 · +0.8%
- By 2040
- 105,786 · +0.5%
- By 2050
- 102,062 · -3.1%
- By 2075
- 88,569 · -15.9%
- By 2100
- 68,293 · -35.1%
Race, ethnicity, and origin ACS 2023
- Neighborhood character
- Predominantly White (80%)
- Race & ethnicity
- White 80% Two or more races 7% Hispanic / Latino 7% Black 6% Asian 1%
- Hispanic origin (detail)
- Mexican 5%
- Common ancestry
- Italian 2% Lithuanian 2% Portuguese 2%
- Foreign-born
- 2% · Canada
- Languages at home
- 96% English-only · Spanish 2% German/W. Germanic 1% Other Asian/Pacific 1%
Political lean MEDSL · Cass
- 2024 margin
- Solid R (+32.1) · D 33.3% · R 65.4% · Other 1.3%
- 2008→2024 swing
- -12.5pp toward R · 2008: -19.6pp · 2024: -32.1pp
- All cycles
- 2024: R+32.1 2020: R+31.6 2016: R+35.9 2012: R+28.4 2008: R+19.6
Not yet ingested
- Civics
- —
Market trends
- HPI YoY
- ▼ -244.76%
- Current HPI
- 214.6157
- Rent YoY
- ▲ 5.17%
- Metro
- Kansas City, MO-KS
- State GDP YoY
- ▲ 1.84%
- F500 in state
- 20
Industry mix (Fortune 500 HQ in MO)
| Industry | F500 HQs | Revenue |
|---|---|---|
| Healthcare | 1 | $163B |
|
||
| Insurance | 1 | $21B |
|
||
| Industrial Technology | 1 | $17B |
|
||
| Retail | 1 | $16B |
|
||
| Industrial Distribution | 1 | $10B |
|
||
| Utilities | 1 | $9B |
|
||
Price history
+78.2% since first listed4 events — show timeline
- 2026-05-08 Pending — Heartland MLS as Distributed by MLS Grid
- 2026-05-08 Listed $285,000 Heartland MLS as Distributed by MLS Grid
- 2004-05-27 Sold (MLS) — Heartland MLS as Distributed by MLS Grid
- 2004-04-17 Listed $159,950 Heartland MLS as Distributed by MLS Grid
Property tax history
+3.7%/yrLatest (2025): $2,415 · +0.1% YoY. Source: county tax records.
Cash-flow waterfall
monthlySold comps — $/sqft
last 12 mo · ≤1 miLoading sold comps…