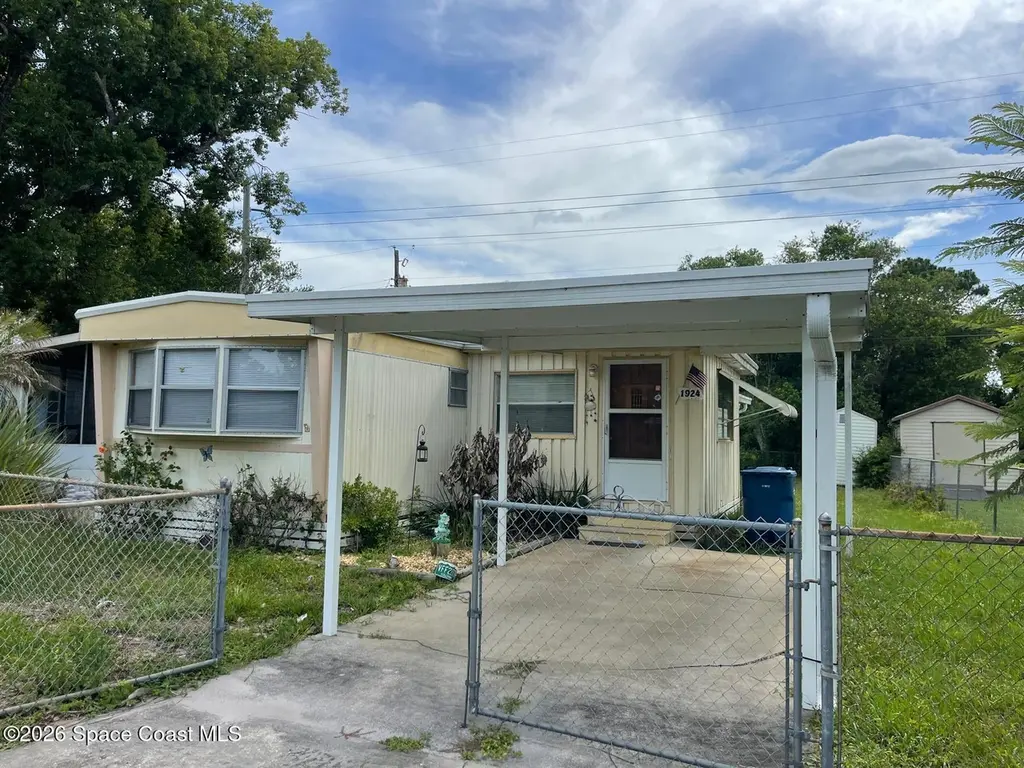
1924 Sunny Palm Dr · Ormond Beach, FL
Flood risk 1/10 · Minimal
- FEMA flood zone
- X (unshaded)
- Chance of flooding over 30 yrs
- 0.0%
- Est. flood insurance / yr
- $507 – $1,088
Fire risk 4/10 · Minor
- Est. fire insurance / yr
- $947 – $1,759
Heat risk 10/10 · Severe
- Hot days now (above 105°F)
- 7 days/yr
- Hot days in 30 yrs
- 20 days/yr
Wind risk 10/10 · Severe
- Chance of severe wind over 30 yrs
- 99.0%
Air-quality risk 3/10 · Minor
- Unhealthy air days now
- 3 days/yr
- Unhealthy air days in 30 yrs
- 3 days/yr
Risk factors via First Street. Map © Google.
Why this score? — see what drove the B grade
The composite is a weighted blend of 9 inputs, each scored 0–100. Each bar is that input's sub-score; the figure is the points it added to the 100-point composite (weight × sub-score).
- Cash flow +30.0/30.0
- 1% rule +10.0/10.0
- DSCR +10.0/10.0
- ARV discount +7.5/15.0
- Livability +4.2/5.0
- Schools +3.9/10.0
- Rent growth +2.9/5.0
- Condition / age +2.5/5.0
- Appreciation +0.0/10.0
$67,900
🖨 Deal sheet (PDF) 📄 Offer letter ✓ Due diligence
Listing remarks
Affordable Ormond Beach Opportunity - No Lot Rent, No HOA! Calling all investors, handymen, and savvy buyers looking for a great value! This charming 2-bedroom, 2-bath furnished home offers affordable living with the added benefit of owning your own land--no lot rent and no HOA restrictions. Recent updates include a 2019 roof and a brand-new AC installed in 2025 and Blowing ICE COLD! Whether you're looking for a primary residence, vacation getaway, rental property, or investment opportunity, this property offers excellent potential and cash-flow possibilities. Ideally located in a desirable Ormond Beach area, you'll be just 12 minutes from the Atlantic Ocean and only minutes from the newly
Key facts
- Recent updates
- No lot rent
- 2019 roof
Tags
Property features AI
Exterior
- Parking: Carport (1 space)
- Utilities: Public sewer; Cable available; Electricity connected; Sewer available and connected; Water available and connected
- Home design: Manufactured home; Faces east
- Construction: Block and other construction materials
- Exterior features: Few trees on the lot; Lot dimensions approximately 70 ft x 100 ft
Interior
- Kitchen: Kitchen
- Bedrooms: 2 bedrooms
- Bathrooms: 2 full bathrooms
- Heating & cooling: Central heating; Central air conditioning
- Interior features: Total of 4 rooms; Residential use; Furnished
Neighborhood map
What this means for you Summary
Snapshot
- This is a 2-bed/2.0-bath manufactured listed at $68k.
Deal economics
- At list price, monthly cash flow is $918 ($11k/yr) — positive.
- The deal already cash-flows at list — no discount required.
- Meets the 1% rule at list price ($2k rent vs $68k).
- Cap rate 22.5% vs local median 3.9% in Ormond Beach — top-decile yield for the area; either an underpriced asset or a hidden risk that comps aren't pricing in. Stress-test before assuming the spread holds.
Location & tenants
- Location reads 83/100 on livability (#55 in FL, #965 nationally) — a professional / high-income tenant draw. Strengths: amenities A+, housing A+, health & safety A+; Watch: commute F.
- Volusia (suburban): math 44% / reading 49% proficiency, ranked #47 of 73 in FL (top 64%) — families likely to look elsewhere, expect single-tenant / working-renter base with shorter leases.
- Market conditions: Rents rising (+1.6%/yr); 985 active listings in the ZIP; 1 comparable units currently listed for rent nearby; 3,402 units permitted in Volusia County in 2024 (681 in 5+ unit buildings).
Forward outlook
- Local home prices are declining (-3.0%/yr); year-one equity from $469 of loan paydown is wiped out by about $2k of value loss. Plan a longer hold.
- Volusia County population projected at +19% by 2050 — long-run rental-demand tailwind backs the buy-and-hold thesis.
- At projected returns (-3.0% appreciation + 1.6% rent growth), your $19k cash investment doubles in ~2 years — after that, you're playing with house money.
Negotiation context
- Only 3 days on market — expect competitive offers; lowballing is unlikely to land.
- 2 sale attempts with the ask held roughly flat each time — persistent listings suggest the price (not the market) is what's stuck; bring a comps-based counter.
- Current owner paid $32k; list at $68k implies a 112% gain — meaningful room to come down on a strong offer.
Risks & watch-outs
- Climate carrying-cost: severe wind risk, 99% chance of damaging wind over 30y; extreme-heat days projected 7→20/yr by 2055 (HVAC capex compounding) — expect insurance premiums to compound above CPI over the hold.
Questions for the listing agent
- Built in 1974 — when were the roof, HVAC, electrical panel, plumbing, and water heater last replaced?
- Is there a deadline driving the sale (1031 exchange, divorce, estate, relocation)? That informs how much negotiation room exists.
- Schools are B-rated — typically a magnet for longer-tenancy family renters. What's the average tenant stay here, and is there a school-zone premium baked into asking?
- What's the average days-on-market for RENTAL listings here right now (not sales)? A rising rental-DOM trend means longer vacancies and softer asking-rent achievability than the comps imply.
- What's the recent tenant-quality profile in this submarket — average credit score on applications, eviction rate, late-payment / NSF rate, and stable-employment percentage? A property-management company in the area should have these aggregated.
- How much new for-sale + rental construction is in the pipeline within 1–3 miles? Heavy new supply typically softens prices + rents 12–24 months out; constrained supply supports both.
Investment metrics
- 1% rule
- 2.49% ✓
- Cap rate
- 22.52%
- Cash-on-cash
- 57.97%
- DSCR
- 3.58
- GRM
- 3.3
CMA / ARV
No comps found within radius.
Projected returns pro-forma
-3.0% appreciation · 1.64% rent growth · sell at horizon
- IRR
- 55.0%
- Equity multiple
- 3.38×
- Total profit
- $45,204
- Equity at exit
- $10,124
- IRR
- 59.6%
- Equity multiple
- 6.55×
- Total profit
- $105,544
- Equity at exit
- $5,871
Cash invested: $19,012 (down + closing). Projections, not guarantees.
Landlord ↔ Tenant lean methodology
- Overall (STATE)
- 87 Strongly Landlord-Friendly
- State Florida
- 87 Strongly Landlord-Friendly · R+3
- County
- — inherits STATE
- City
- — inherits STATE
ZIP-level market 32174
- Rents YoY
- 1.6%
- Active inventory
- 985
- Price-to-rent
- 3.3×
Monthly cashflow live
- Estimated rent
- $1,691 medium interval (Pro) →
- Mortgage (P&I)
- −$356
- Tax from tax record
- −$33 /mo · $395/yr
- Insurance
- −$28
- HOA
- −$0
- Vacancy / Maint / Mgmt
- −$355
- Net cashflow
- $918
Break-even live
Sensitivity live
| Price | -10% $957 | -5% $938 | +0% $918 | +5% $899 | +10% $880 |
|---|---|---|---|---|---|
| Rent | -10% $785 | -5% $852 | +0% $918 | +5% $985 | +10% $1,052 |
| Rate | -1.0pp $953 | -0.5pp $936 | base $918 | +0.5pp $901 | +1.0pp $883 |
UW: 25.0% down · 7.5% · 30yr · 1.5% tax · 5.0% vac · 8.0% maint · 8.0% mgmt
Financing live
Cash to close
- Down payment
- $16,975
- Closing costs
- $2,037
- Reserves months
- —
- Total cash needed
- —
Loan-product check · same deal, 3 products live
Conventional
25% down · 7.5% · 30yr
- Down + closing
- —
- Monthly P&I
- —
- Monthly cashflow
- —
- DSCR
- —
- Eligible?
- —
Personal DTI + credit; lowest rate.
DSCR
20% down · 8.5% · 30yr
- Down + closing
- —
- Monthly P&I
- —
- Monthly cashflow
- —
- DSCR
- —
- Eligible?
- —
No personal income docs; deal must DSCR.
Hard money
10% down · 12.0% · 12mo
- Down + closing
- —
- Monthly P&I
- —
- Monthly cashflow
- —
- DSCR
- —
- Eligible?
- —
Short-term bridge; refi at stabilization.
Rent comps 1 comps
| Address | Beds | Baths | Sqft | Rent | $/sqft | DOM | Units | Dist |
|---|---|---|---|---|---|---|---|---|
| 1612 Montgomery Ave Daytona Beach, FL | 1.0 | 1.0 | 480 | $2,000 | $4.17 | 24d | 1 | 1.41mi |
Listing history 7 events
-
2026-06-18status $67,900 Pending 3 DOM
-
2026-06-18days on market $67,900 Active 3 DOM
-
2026-06-17days on market $67,900 Active 2 DOM
-
2026-06-15days on market $67,900 Active 1 DOM
-
2026-06-15days on market $67,900 Active 2 DOM
-
2026-06-14remarks 699-char remark
-
2026-06-14$67,900 Active 1 DOM
ⓘ Source: listings_history table (triggers on properties + properties_extension) + one-shot
backfill from property_details.listing_events for pre-trigger history.
Tax reassessment forecast FL · Resets to sale price
- Current annual tax
- $395 · $33/mo
- Projected year-2 tax
- $564 · $47/mo
- Expected delta
- +$168/yr (+$14/mo · 42.5%)
ⓘ Screening estimate from a state-policy table — verify with the county assessor before closing.
Climate risk First Street
- Flood 1/10 Low FEMA zone X (unshaded) · 0% chance over 30 yrs
- Wildfire 4/10 Moderate
- Heat 10/10 Extreme 7 d/yr ≥105°F today · 20 d/yr by 30 yrs out
- Wind 10/10 Extreme 99% chance of damaging wind over 30 yrs
- Air quality 3/10 Moderate 3 unhealthy d/yr today · 3 by 30 yrs out
Nearby sold comps map
Loading sold comps map…
Walkable amenities ~0.75 mi
Loading nearby amenities…
Taxation est. · year 1
- Rental income
- $20,290
- − Mortgage interest
- −$3,803
- − Property taxes
- −$395
- − Insurance
- −$340
- − Repairs & maintenance
- −$1,623
- − Management
- −$1,623
- − Depreciation
- −$1,975
- Taxable income
- $10,530
- Est. tax owed @ 24.0%
- −$2,527
- After-tax cash flow
- $8,494/yr
For passive investors: Depreciation is non-cash, so a rental often shows a tax loss while cash-flowing — sheltering income. Rental losses are passive: they offset passive income freely, and up to $25,000/yr can offset ordinary (W-2) income if you actively participate and your MAGI is under $100k (phasing out to $0 by $150k); unused losses carry forward. On sale, claimed depreciation is recaptured at up to 25%, and gains may owe capital-gains tax (a 1031 exchange can defer both). Figures are a year-1 estimate at your 24.0% rate — not tax advice; consult a CPA.
Schools (NCES district)
- District
- Volusia
- NCES district ID
- 1201920
- Math proficiency
- 44% ▼ -9.00%
- Reading proficiency
- 49% ▼ -3.00%
- Median HH income
- $42,946
- Composite
- 39.2/100
- National rank
- #4019
- State rank
- #47 of 73 in FL
Livability — Ormond Beach
- Score
- 83/100
- State rank
- #55
- US rank
- #965
Category grades
Schools grade is shown separately in the Schools card above.
Census & demographics
- County
- Volusia County · 556,871 people
- City population
- 69,624
- Metro
- Deltona-Daytona Beach-Ormond Beach, FL
- Population (ZIP)
- 54,783
- Household income
- $71,011
- Rent vs Own
- Severe rent burden
- 1158.0
Population outlook (Volusia County) Hauer SSP2
- Today (2025)
- 572,749 people
- By 2030
- 598,695 · +4.5%
- By 2040
- 644,880 · +12.6%
- By 2050
- 681,451 · +19.0%
- By 2075
- 759,957 · +32.7%
- By 2100
- 778,902 · +36.0%
Race, ethnicity, and origin ACS 2023
- Neighborhood character
- Predominantly White (82%)
- Race & ethnicity
- White 82% Black 6% Hispanic / Latino 5% Two or more races 5% Asian 3%
- Hispanic origin (detail)
- Puerto Rican 2%
- Common ancestry
- Romanian 4% Lithuanian 3% Slovak 3%
- Foreign-born
- 7% · Canada, China
- Languages at home
- 91% English-only · Spanish 3% Other Indo-European 1% German/W. Germanic 1%
Political lean MEDSL · Volusia
- 2024 margin
- Strong R (+21.8) · D 38.7% · R 60.5%
- 2008→2024 swing
- -27.4pp toward R · 2008: 5.7pp · 2024: -21.8pp
- All cycles
- 2024: R+21.8 2020: R+14.1 2016: R+13.1 2012: R+1.2 2008: D+5.7
Not yet ingested
- Civics
- —
Market trends
- HPI YoY
- ▼ -327.97%
- Current HPI
- 271.92
- Rent YoY
- ▲ 1.64%
- Metro
- Deltona-Daytona Beach-Ormond Beach, FL
- State GDP YoY
- ▲ 3.28%
- F500 in state
- 36
Industry mix (Fortune 500 HQ in FL)
| Industry | F500 HQs | Revenue |
|---|---|---|
| Industrial Technology | 2 | $29B |
|
||
| Insurance | 2 | $17B |
|
||
| Retail | 1 | $60B |
|
||
| Technology Distribution | 1 | $58B |
|
||
| Homebuilding | 1 | $35B |
|
||
| Technology Manufacturing | 1 | $35B |
|
||
Price history
+112.2% since first listed4 events — show timeline
- 2026-06-12 Listed $67,900 SCMLS
- 2026-06-12 Listing Removed — Stellar MLS as Distributed by MLS Grid
- 2026-06-12 Listed $67,900 Stellar MLS as Distributed by MLS Grid
- 1995-11-07 Sold (Public Records) $32,000 Public Records
Property tax history
-5.3%/yrLatest (2025): $395 · +3.0% YoY. Source: county tax records.
Cash-flow waterfall
monthlySold comps — $/sqft
last 12 mo · ≤1 miLoading sold comps…