2101 S 324th St #228 · Federal Way, WA
Flood risk 1/10 · Minimal
- FEMA flood zone
- X (unshaded)
- Chance of flooding over 30 yrs
- 0.0%
- Est. flood insurance / yr
- $473 – $860
Fire risk 1/10 · Minimal
- Est. fire insurance / yr
- $604 – $1,122
Heat risk 3/10 · Minor
- Hot days now (above 87°F)
- 7 days/yr
- Hot days in 30 yrs
- 15 days/yr
Wind risk 1/10 · Minimal
- Chance of severe wind over 30 yrs
- —
Air-quality risk 7/10 · Major
- Unhealthy air days now
- 10 days/yr
- Unhealthy air days in 30 yrs
- 11 days/yr
Risk factors via First Street. Map © Google.
Why this score? — see what drove the B- grade
The composite is a weighted blend of 9 inputs, each scored 0–100. Each bar is that input's sub-score; the figure is the points it added to the 100-point composite (weight × sub-score).
- Cash flow +24.4/30.0
- ARV discount +15.0/15.0
- DSCR +7.9/10.0
- 1% rule +6.3/10.0
- Condition / age +4.0/5.0
- Schools +3.9/10.0
- Livability +3.6/5.0
- Rent growth +3.1/5.0
- Appreciation +0.0/10.0
$199,000
🖨 Deal sheet 📄 Offer letter ✓ Due diligence
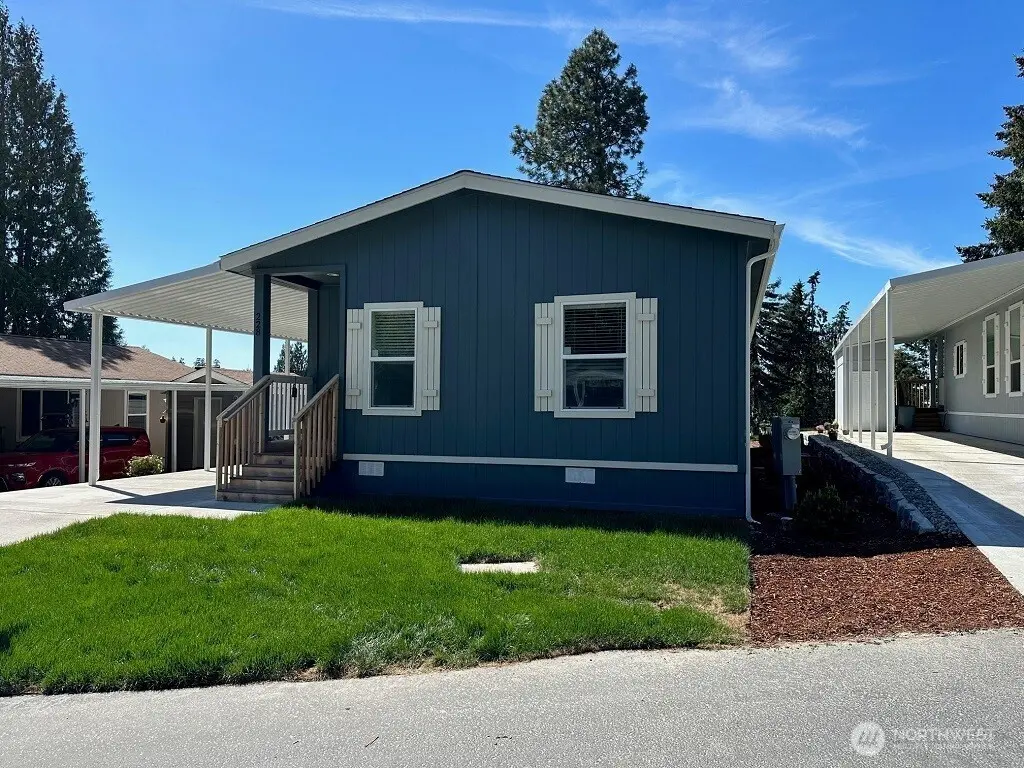
Listing remarks
Belmor Park has a beautiful home for sale with a golf course view! This 2 bed, 2 bath upgraded home has much to offer. Stainless steel kitchen appliances, open concept living space, quartz counters, and large master w/ closet. Irrigation/Landscaping/Awnings and shed all included. We are a 55+ Community. 10.1% Sales tax applies on all new homes.
Key facts
- Quartz counters
- Golf course view
- Shed included
Tags
Neighborhood map
What this means for you Summary
Snapshot
- This is a 2-bed/2.0-bath manufactured listed at $199k. Condition is rated good.
Deal economics
- At list price, monthly cash flow is $403 ($5k/yr) — positive.
- The deal already cash-flows at list — no discount required.
- Meets the 1% rule at list price ($2k rent vs $199k).
- Recommended offer: $175k (12.0% below list) — sets the bar for market timing.
- Cap rate 8.7% vs local median 2.7% in Federal Way — top-decile yield for the area; either an underpriced asset or a hidden risk that comps aren't pricing in. Stress-test before assuming the spread holds.
Location & tenants
- Location reads 71/100 on livability (#221 in WA) — a middle-class / working-renter tenant base. Strengths: commute A+, housing A+, health & safety A+; Watch: schools C-, crime F, cost of living F.
- Federal Way School District (suburban): math 35% / reading 47% proficiency, ranked #207 of 291 in WA (top 71%) — families likely to look elsewhere, expect single-tenant / working-renter base with shorter leases.
- Market conditions: Rents rising (+2.3%/yr); 231 active listings in the ZIP; 24 comparable units currently listed for rent nearby; rentals leasing fast (median 5d on market — plan ~1-2 weeks tenant-placement turnaround); solid renter incomes; 10,555 units permitted in King County in 2024 (7,119 in 5+ unit buildings).
- This rent runs 36% of the median local income ($75k/yr) — at the standard rent-burdened threshold; future hikes will face affordability resistance.
Forward outlook
- Local home prices are declining (-3.0%/yr); year-one equity from $1k of loan paydown is wiped out by about $6k of value loss. Plan a longer hold.
- King County population projected at +44% by 2050 — long-run rental-demand tailwind backs the buy-and-hold thesis.
Negotiation context
- It's been on market 330 days — a 12% lower offer ($175k) is reasonable based on typical stale-listing flexibility.
Questions for the listing agent
- It's been on market 330 days. Have you received any prior offers? Is the seller open to a 12% concession, seller financing, or rate buy-down credit?
- Why hasn't it sold? Are there any deal-killer items the seller is aware of (foundation, flood, title, zoning, code violations)?
- Is there a deadline driving the sale (1031 exchange, divorce, estate, relocation)? That informs how much negotiation room exists.
- Crime grade is F in this area — have there been break-ins, vandalism, or insurance claims at this property in the last 3 years? What carrier currently insures it and at what premium?
- What's the average days-on-market for RENTAL listings here right now (not sales)? A rising rental-DOM trend means longer vacancies and softer asking-rent achievability than the comps imply.
- What's the recent tenant-quality profile in this submarket — average credit score on applications, eviction rate, late-payment / NSF rate, and stable-employment percentage? A property-management company in the area should have these aggregated.
- How much new for-sale + rental construction is in the pipeline within 1–3 miles? Heavy new supply typically softens prices + rents 12–24 months out; constrained supply supports both.
Investment metrics
- 1% rule
- 1.13% ✓
- Cap rate
- 8.72%
- Cash-on-cash
- 8.68%
- DSCR
- 1.39
- GRM
- 7.4
CMA / ARV
- ARV (median comp)
- $295,000
- List price
- $199,000
- Delta
- -32.54%
- Verdict
- UNDERPRICED
- Comps
- 15 within 1.0 mi
Show comp detail 12 sales within ~0.75 mi
| Address | Dist | Beds/Ba | Sqft | Sold | Price | $/sf | Match |
|---|---|---|---|---|---|---|---|
| 2101 S 324th St #232 | 0.00mi | 2/2.0 | 1,392 (0%) | 12mo | $199,000 | $143 | 90 |
| 2101 S 324th St #164 | 0.00mi | 3/2.0 (+1) | 1,404 (+1%) | 4mo | $300,000 | $214 | 90 |
| 32820 20th Ave S #24 | 0.17mi | 2/2.0 | 1,400 (+1%) | 3mo | $360,000 | $257 | 88 |
| 2101 S 324th St #102 | 0.00mi | 2/2.0 | 1,344 (-3%) | 10mo | $249,900 | $186 | 86 |
| 32820 20th Ave S #35 | 0.17mi | 2/2.0 | 1,344 (-3%) | 7mo | $315,000 | $234 | 81 |
| 2101 S 324th St #230 | 0.00mi | 3/2.0 (+1) | 1,440 (+3%) | 13mo | $65,000 | $45 | 79 |
| 2101 S 324th St #163 | 0.00mi | 3/2.0 (+1) | 1,458 (+5%) | 11mo | $319,000 | $219 | 78 |
| 2101 S 324th St #107 | 0.00mi | 2/2.0 | 1,248 (-10%) | 6mo | $152,500 | $122 | 77 |
| 2101 S 324th St #109 | 0.00mi | 2/2.0 | 1,250 (-10%) | 12mo | $90,000 | $72 | 73 |
| 32820 20th Ave S #18 | 0.17mi | 3/2.0 (+1) | 1,296 (-7%) | 3mo | $327,500 | $253 | 73 |
| 2101 S 324th St #185 | 0.00mi | 2/2.0 | 1,231 (-12%) | 10mo | $229,950 | $187 | 72 |
| 2101 S 324th St | 0.10mi | 2/2.0 | 1,200 (-14%) | 14mo | $225,000 | $188 | 60 |
Match score weights: distance 35% · size 25% · config 20% · recency 20%. Top-matched comps best support the ARV.
Projected returns pro-forma
-3.0% appreciation · 2.33% rent growth · sell at horizon
- IRR
- -3.9%
- Equity multiple
- 0.86×
- Total profit
- $-8,052
- Equity at exit
- $29,672
- IRR
- 5.0%
- Equity multiple
- 1.36×
- Total profit
- $20,075
- Equity at exit
- $17,206
Cash invested: $55,720 (down + closing). Projections, not guarantees.
Landlord ↔ Tenant lean methodology
- Overall (STATE)
- 28 Tenant-Leaning
- State Washington
- 28 Tenant-Leaning · D+8
- County
- — inherits STATE
- City
- — inherits STATE
ZIP-level market 98003
- Rents YoY
- 2.3%
- Active inventory
- 231
- Price-to-rent
- 7.4×
Monthly cashflow live
- Estimated rent
- $2,251 high interval (Pro) →
- Mortgage (P&I)
- −$1,044
- Tax est. 1.5%
- −$249 /mo · $2,985/yr
- Insurance
- −$83
- HOA
- −$0
- Vacancy / Maint / Mgmt
- −$473
- Net cashflow
- $403
Break-even live
UW: 25.0% down · 7.5% · 30yr · 1.5% tax · 5.0% vac · 8.0% maint · 8.0% mgmt
Financing live
Cash to close
- Down payment
- $49,750
- Closing costs
- $5,970
- Reserves months
- —
- Total cash needed
- —
Loan-product check · same deal, 3 products live
Conventional
25% down · 7.5% · 30yr
- Down + closing
- —
- Monthly P&I
- —
- Monthly cashflow
- —
- DSCR
- —
- Eligible?
- —
Personal DTI + credit; lowest rate.
DSCR
20% down · 8.5% · 30yr
- Down + closing
- —
- Monthly P&I
- —
- Monthly cashflow
- —
- DSCR
- —
- Eligible?
- —
No personal income docs; deal must DSCR.
Hard money
10% down · 12.0% · 12mo
- Down + closing
- —
- Monthly P&I
- —
- Monthly cashflow
- —
- DSCR
- —
- Eligible?
- —
Short-term bridge; refi at stabilization.
Rent comps 24 comps
| Address | Beds | Baths | Sqft | Rent | $/sqft | DOM | Units | Dist |
|---|---|---|---|---|---|---|---|---|
| 32905 19th Pl S Federal Way, WA | 1.0–3.0 | 1.0–2.0 | 937 | $2,104 | $2.24 | 1d | 17 | 0.19mi |
| 33016 17th Pl S Unit B302 Federal Way, WA | 2.0 | 1.0 | 886 | $1,785 | $2.01 | 10d | 1 | 0.41mi |
| 2100 S 336th St Unit C1 Federal Way, WA | 3.0 | 2.5 | 1460 | $4,000 | $2.74 | 43d | 1 | 0.49mi |
| 2100 S 336th St Unit P5 Federal Way, WA | 2.0 | 2.5 | 918 | $2,500 | $2.72 | 2d | 1 | 0.49mi |
| 33311 18th Ln S Federal Way, WA | 1.0–3.0 | 1.0–2.0 | 950 | $1,812 | $1.91 | 1d | 7 | 0.55mi |
| 31701 Pete Von Reichbauer Way S Federal Way, WA | 2.0 | 1.0 | 721 | $2,142 | $2.97 | 4d | 1 | 0.63mi |
| 2517 S 316th Ln Federal Way, WA | 1.0–2.0 | 1.0–2.0 | 825 | $2,010 | $2.44 | 2d | 5 | 0.71mi |
| 31408 28th Ave S Federal Way, WA | 3.0 | 2.5–3.5 | 1864 | $2,900 | $1.56 | 2d | 5 | 0.82mi |
| 1066 S 320th St Federal Way, WA | 1.0–3.0 | 1.0–2.0 | 1088 | $2,016 | $1.85 | 1d | 7 | 0.84mi |
| 32305 10th Pl S Federal Way, WA | 3.0 | 1.5 | 1320 | $3,200 | $2.42 | 43d | 1 | 0.86mi |
| 3634 S 334th St Federal Way, WA | 3.0 | 1.0 | 1540 | $2,900 | $1.88 | 43d | 1 | 0.88mi |
| 31224 Pete Von Reichbauer Way S Federal Way, WA | 1.0–2.0 | 1.0–2.0 | 822 | $2,114 | $2.57 | 2d | 4 | 0.89mi |
| 1201 S 336th St Federal Way, WA | 1.0–4.0 | 1.0–2.0 | 1094 | $2,016 | $1.84 | 2d | 11 | 0.96mi |
| 31655 Military Rd S Auburn, WA | 1.0–4.0 | 1.0–2.0 | 1032 | $1,949 | $1.89 | 1d | 10 | 1.02mi |
| 31750 7th Pl S Federal Way, WA | 3.0 | 1.0 | 1280 | $2,600 | $2.03 | 43d | 1 | 1.09mi |
| 30813 19th Pl S Federal Way, WA | 2.0 | 1.0 | 900 | $2,195 | $2.44 | 1d | 1 | 1.16mi |
| 1916 S 308th St Federal Way, WA | 3.0 | 1.0 | 1040 | $2,395 | $2.30 | 43d | 1 | 1.21mi |
| 32836 3rd Pl S Federal Way, WA | 2.0 | 2.0 | 1080 | $2,150 | $1.99 | 10d | 1 | 1.21mi |
| 1650 S 308th St Federal Way, WA | 1.0–2.0 | 1.0 | 850 | $1,495 | $1.76 | 4d | 3 | 1.27mi |
| 30602 Pacific Hwy S Federal Way, WA | 1.0–2.0 | 1.0–1.5 | 950 | $1,695 | $1.78 | 2d | 12 | 1.32mi |
| 1737 S 305th Pl Unit 4 Federal Way, WA | 2.0 | 1.0 | 950 | $2,000 | $2.11 | 43d | 1 | 1.36mi |
| 117 S 330th St Federal Way, WA | 2.0 | 1.0–2.0 | 1050 | $1,695 | $1.61 | 4d | 1 | 1.42mi |
| 33131 1st Ave SW Federal Way, WA | 1.0–2.0 | 1.0 | 797 | $2,145 | $2.69 | 1d | 9 | 1.46mi |
| 32420 1st Ln SW Federal Way, WA | 2.0 | 1.0 | 980 | $2,050 | $2.09 | 20d | 1 | 1.48mi |
Listing history 6 events
-
2026-06-04days on market $199,000 Active 330 DOM
-
2026-06-03days on market $199,000 Active 329 DOM
-
2026-06-02days on market $199,000 Active 328 DOM
-
2026-06-01days on market $199,000 Active 327 DOM
-
2026-05-31days on market $199,000 Active 326 DOM
-
2025-07-09$199,000 Active
ⓘ Source: listings_history table (triggers on properties + properties_extension) + one-shot
backfill from property_details.listing_events for pre-trigger history.
Climate risk First Street
- Flood 1/10 Low FEMA zone X (unshaded) · 0% chance over 30 yrs
- Wildfire 1/10 Low
- Heat 3/10 Moderate 7 d/yr ≥87°F today · 15 d/yr by 30 yrs out
- Wind 1/10 Low
- Air quality 7/10 Severe 10 unhealthy d/yr today · 11 by 30 yrs out
Nearby sold comps map
Loading sold comps map…
Walkable amenities ~0.75 mi
Loading nearby amenities…
Taxation est. · year 1
- Rental income
- $27,011
- − Mortgage interest
- −$11,147
- − Property taxes
- −$2,985
- − Insurance
- −$995
- − Repairs & maintenance
- −$2,161
- − Management
- −$2,161
- − Depreciation
- −$5,789
- Taxable income
- $1,773
- Est. tax owed @ 24.0%
- −$426
- After-tax cash flow
- $4,410/yr
For passive investors: Depreciation is non-cash, so a rental often shows a tax loss while cash-flowing — sheltering income. Rental losses are passive: they offset passive income freely, and up to $25,000/yr can offset ordinary (W-2) income if you actively participate and your MAGI is under $100k (phasing out to $0 by $150k); unused losses carry forward. On sale, claimed depreciation is recaptured at up to 25%, and gains may owe capital-gains tax (a 1031 exchange can defer both). Figures are a year-1 estimate at your 24.0% rate — not tax advice; consult a CPA.
Condition & rehab AI · 11 photos
This Belmor Park home offers a golf course view and is move-in ready with a good condition score and minimal repairs needed.
Value-add opportunities
- Both Paint exterior siding — Enhances curb appeal and value
- Both Replace ceiling fans with LED lights — Saves energy and looks modern
- Both Install smart home devices — Improves convenience and energy efficiency
Renovation cost estimate screening
Value-add ROI direction
- Both Paint exterior siding — Enhances curb appeal and value ↑
- Both Replace ceiling fans with LED lights — Saves energy and looks modern ↑
- Both Install smart home devices — Improves convenience and energy efficiency ↑
ⓘ Cost ranges are severity-bucket heuristics (US national rule-of-thumb). Get contractor quotes + a written scope before underwriting a rehab budget.
Schools (NCES district)
- District
- Federal Way School District
- NCES district ID
- 5302820
- Math proficiency
- 35% ▬ 0.00%
- Reading proficiency
- 47% ▬ 0.00%
- Median HH income
- $61,594
- Composite
- 38.79/100
- National rank
- #8361
- State rank
- #207 of 291 in WA
Livability — Federal Way
- Score
- 71/100
- State rank
- #221
- US rank
- #6403
Category grades
Schools grade is shown separately in the Schools card above.
Census & demographics
- Census place
- Federal Way, WA
- County
- King County · 2,251,916 people
- City population
- 102,067
- Metro
- Seattle-Tacoma-Bellevue, WA
- Population (ZIP)
- 51,619
- Household income
- $75,319
- Rent vs Own
- Severe rent burden
- 2895.0
Population outlook (King County) Hauer SSP2
- Today (2025)
- 2,576,485 people
- By 2030
- 2,803,316 · +8.8%
- By 2040
- 3,255,921 · +26.4%
- By 2050
- 3,706,444 · +43.9%
- By 2075
- 4,746,063 · +84.2%
- By 2100
- 5,407,730 · +109.9%
Race, ethnicity, and origin ACS 2023
- Neighborhood character
- Highly diverse neighborhood (Simpson 0.79)
- Race & ethnicity
- White 32% Hispanic / Latino 23% Black 19% Two or more races 16% Asian 13% Pacific Islander 2%
- Hispanic origin (detail)
- Mexican 18%
- Common ancestry
- Portuguese 3% Lithuanian 2% Swedish 2%
- Foreign-born
- 32% · Canada, South Korea, Vietnam
- Languages at home
- 57% English-only · Spanish 18% Other Indo-European 3% Russian/Polish/Slavic 3%
Political lean MEDSL · King
- 2024 margin
- Solid D (+51.7) · D 74.2% · R 22.5% · Other 3.4%
- 2008→2024 swing
- +9.6pp toward D · 2008: 42.1pp · 2024: 51.7pp
- All cycles
- 2024: D+51.7 2020: D+52.7 2016: D+50.4 2012: D+39.9 2008: D+42.1
Not yet ingested
- Civics
- —
Market trends
- HPI YoY
- ▼ -623.87%
- Current HPI
- 327.5371
- Rent YoY
- ▲ 2.33%
- Metro
- Seattle-Tacoma-Bellevue, WA
- State GDP YoY
- ▲ 4.65%
- F500 in state
- 22
Industry mix (Fortune 500 HQ in WA)
| Industry | F500 HQs | Revenue |
|---|---|---|
| Retail | 2 | $269B |
|
||
| Technology / Retail | 1 | $638B |
|
||
| Technology | 1 | $245B |
|
||
| Telecommunications | 1 | $38B |
|
||
| Food / Beverage | 1 | $36B |
|
||
| Automotive / Trucks | 1 | $34B |
|
||
Price history
1 event — show timeline
- 2025-07-09 Listed $199,000 NWMLS as Distributed by MLS Grid
Cash-flow waterfall
monthlySold comps — $/sqft
last 12 mo · ≤1 miLoading sold comps…