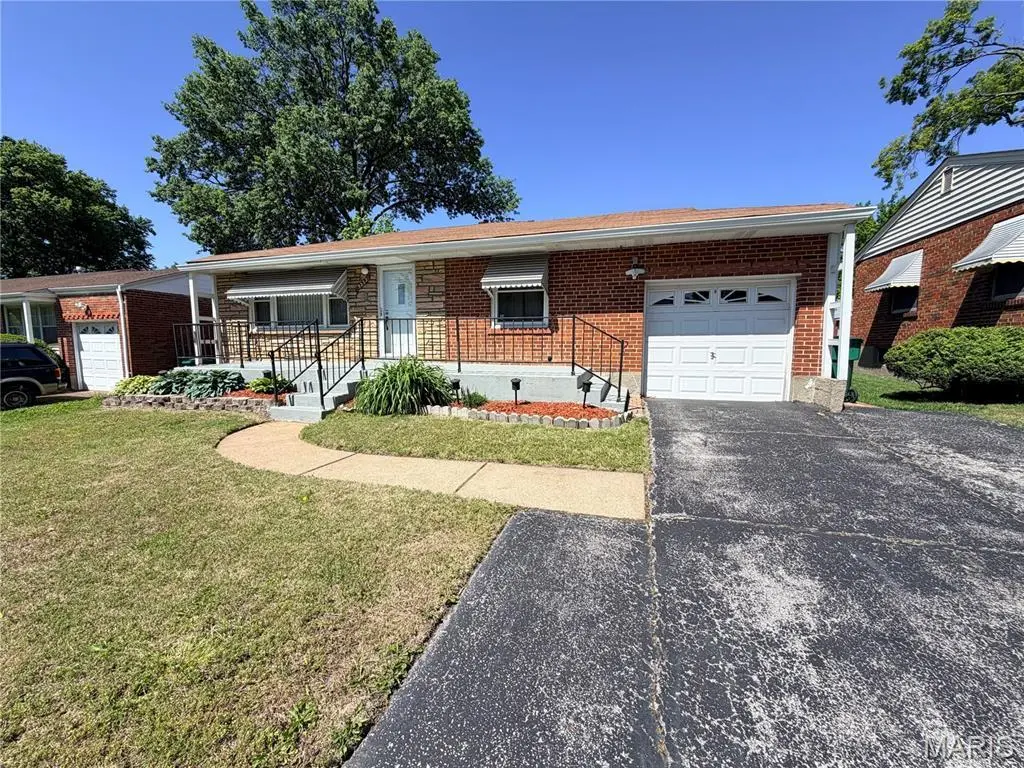
9233 Edna St · Bellefontaine Neighbors, MO
Flood risk 1/10 · Minimal
- FEMA flood zone
- X (unshaded)
- Chance of flooding over 30 yrs
- 0.0%
- Est. flood insurance / yr
- $473 – $860
Fire risk 1/10 · Minimal
- Est. fire insurance / yr
- $1,054 – $1,958
Heat risk 5/10 · Moderate
- Hot days now (above 107°F)
- 7 days/yr
- Hot days in 30 yrs
- 21 days/yr
Wind risk 2/10 · Minimal
- Chance of severe wind over 30 yrs
- 1.0%
Air-quality risk 4/10 · Minor
- Unhealthy air days now
- 5 days/yr
- Unhealthy air days in 30 yrs
- 6 days/yr
Risk factors via First Street. Map © Google.
Why this score? — see what drove the C+ grade
The composite is a weighted blend of 9 inputs, each scored 0–100. Each bar is that input's sub-score; the figure is the points it added to the 100-point composite (weight × sub-score).
- Cash flow +27.3/30.0
- DSCR +9.5/10.0
- ARV discount +7.9/15.0
- 1% rule +7.7/10.0
- Rent growth +4.1/5.0
- Livability +2.9/5.0
- Condition / age +2.5/5.0
- Schools +0.4/10.0
- Appreciation +0.0/10.0
$98,000
🖨 Deal sheet (PDF) 📄 Offer letter ✓ Due diligence
Listing remarks
Beautifully maintained and move-in ready, 9233 Edna St offers the perfect blend of comfort, charm, and important updates. From the moment you walk in, you’ll appreciate the pristine hardwood floors that run throughout the home and the care that has gone into maintaining every space. Major mechanical updates include an updated electrical panel and HVAC system, giving buyers added confidence and peace of mind. The home also features an additional den complete with a cozy fireplace and dry bar, creating the perfect space for entertaining, relaxing, or hosting game nights. A partially finished basement adds even more flexible living space with endless possibilities for a recreation area,
Key facts
- Additional den
- Dry bar
- Hvac system
Tags
Property features AI
Finance
- Other: Private ownership; Residential property subtype: Single Family Residence; Above-grade finished area and living area listed (source: public records/estimated); Below-grade finished area estimated
Exterior
- Parking: Attached garage (1 car)
- Utilities: Public water; Public sewer; Ameren electric; Cable available; Natural gas connected; Phone connected; Electricity connected; Sewer connected; Water connected
- Home design: Single-family residence; One level
- Construction: Brick and vinyl siding exterior
- Exterior features: Back yard; Front yard; Landscaped lot; Few trees; Level lot; Chain link backyard fencing; Patio; Storage
Interior
- Bedrooms: 2 bedrooms on the main level
- Flooring: Carpet; Hardwood
- Bathrooms: 1 full bathroom on the main level
- Heating & cooling: Forced air heating; Central air conditioning
- Interior features: Fireplace in den; Partially finished basement with poured concrete and 8'+ ceiling
Neighborhood map
What this means for you Summary
Snapshot
- This is a 2-bed/1.0-bath single-family listed at $98k.
Deal economics
- At list price, monthly cash flow is $283 ($3k/yr) — positive.
- The deal already cash-flows at list — no discount required.
- Meets the 1% rule at list price ($1k rent vs $98k).
- Recommended offer: $95k (3.0% below list) — sets the bar for market timing.
Location & tenants
- Location reads 58/100 on livability (#592 in MO) — a working-class tenant base; expect higher turnover. Strengths: cost of living A+, housing B+; Watch: employment D+, crime F, amenities F.
- Riverview Gardens (suburban): math 2% / reading 9% proficiency, ranked #324 of 324 in MO (top 100%) — low school quality limits family demand, transient renter base, plan for 1-2y turnover; 90% free/reduced lunch — lower-income household profile, screen leases tightly.
- Zoned schools: Lewis And Clark Elem. (math 2% / reading 2%, grade F, #1,099 of 1,115 statewide, top 100%, 145 students, 98% FRL); Riverview Gardens Sr. High (math 2% / reading 18%, grade F, #501 of 521 statewide, top 97%, 1,331 students, 100% FRL).
- Market conditions: Rents rising fast (+6.6%/yr); 203 active listings in the ZIP; 32 comparable units currently listed for rent nearby; rentals at typical pace (median 25d on market — plan ~3-4 weeks tenant-placement turnaround); 41% of comp listings sitting > 30 days — soft ceiling on asking rent; lower-income renter base — watch delinquency; 920 units permitted in St. Louis County in 2024 (250 in 5+ unit buildings).
- This rent runs 35% of the median local income ($43k/yr) — at the standard rent-burdened threshold; future hikes will face affordability resistance.
Forward outlook
- Local home prices are declining (-3.0%/yr); year-one equity from $678 of loan paydown is wiped out by about $3k of value loss. Plan a longer hold.
- At projected returns (-3.0% appreciation + 6.6% rent growth), your $27k cash investment doubles in ~7 years — after that, you're playing with house money.
Negotiation context
- It's been on market 34 days — a 3% lower offer ($95k) is reasonable based on typical stale-listing flexibility.
Risks & watch-outs
- Watch-outs: built in 1950 — expect roof / HVAC / electrical / plumbing capex.
- Climate carrying-cost: extreme-heat days projected 7→21/yr by 2055 (HVAC capex compounding) — expect insurance premiums to compound above CPI over the hold.
Questions for the listing agent
- It's been on market 34 days. Have you received any prior offers? Is the seller open to a 3% concession, seller financing, or rate buy-down credit?
- Built in 1950 — when were the roof, HVAC, electrical panel, plumbing, and water heater last replaced?
- Is there a deadline driving the sale (1031 exchange, divorce, estate, relocation)? That informs how much negotiation room exists.
- Schools are F-rated, which usually means shorter tenancies and higher turnover. Who's the typical renter profile here, and what's been the actual vacancy rate?
- Crime grade is F in this area — have there been break-ins, vandalism, or insurance claims at this property in the last 3 years? What carrier currently insures it and at what premium?
- What's the average days-on-market for RENTAL listings here right now (not sales)? A rising rental-DOM trend means longer vacancies and softer asking-rent achievability than the comps imply.
- What's the recent tenant-quality profile in this submarket — average credit score on applications, eviction rate, late-payment / NSF rate, and stable-employment percentage? A property-management company in the area should have these aggregated.
- How much new for-sale + rental construction is in the pipeline within 1–3 miles? Heavy new supply typically softens prices + rents 12–24 months out; constrained supply supports both.
Investment metrics
- 1% rule
- 1.27% ✓
- Cap rate
- 9.76%
- Cash-on-cash
- 12.38%
- DSCR
- 1.55
- GRM
- 6.5
CMA / ARV
- ARV (median comp)
- $98,937
- List price
- $98,000
- Delta
- -0.95%
- Verdict
- FAIR
- Comps
- 20 within 1.0 mi
Show comp detail 12 sales within ~0.75 mi
| Address | Dist | Beds/Ba | Sqft | Sold | Price | $/sf | Match |
|---|---|---|---|---|---|---|---|
| 9240 Hathaway Dr | 0.17mi | 2/1.0 | 982 (-7%) | 2mo | $130,000 | $132 | 78 |
| 9456 Bagley Dr | 0.23mi | 2/2.0 | 982 (-7%) | 2mo | $55,000 | $56 | 72 |
| 9426 Westchester Dr | 0.35mi | 2/1.0 | 982 (-7%) | 1mo | $68,900 | $70 | 71 |
| 8845 Portland Ter | 0.42mi | 2/1.0 | 1,116 (+5%) | 2mo | $33,000 | $30 | 70 |
| 819 Portland Ter | 0.44mi | 2/1.0 | 936 (-12%) | 1mo | $60,000 | $64 | 59 |
| 1147 Jolene Dr | 0.65mi | 3/2.0 (+1) | 1,046 (-1%) | 1mo | $149,000 | $142 | 57 |
| 8930 Sides Ct | 0.64mi | 3/1.5 (+1) | 1,008 (-5%) | 1mo | $65,000 | $64 | 54 |
| 9435 Eastchester Dr | 0.41mi | 3/1.0 (+1) | 1,195 (+13%) | 2mo | $55,500 | $46 | 53 |
| 1719 Veronica Ave | 0.74mi | 2/1.0 | 984 (-7%) | 2mo | $94,500 | $96 | 52 |
| 905 Hornsby Ave | 0.61mi | 2/1.5 | 961 (-9%) | 3mo | $115,000 | $120 | 52 |
| 9468 Halls Ferry Rd | 0.57mi | 3/0.5 (+1) | 975 (-8%) | 2mo | $67,500 | $69 | 51 |
| 937 Lebon Dr | 0.70mi | 3/1.0 (+1) | 1,218 (+15%) | 1mo | $80,000 | $66 | 37 |
Match score weights: distance 35% · size 25% · config 20% · recency 20%. Top-matched comps best support the ARV.
Projected returns pro-forma
-3.0% appreciation · 6.59% rent growth · sell at horizon
- IRR
- 6.2%
- Equity multiple
- 1.25×
- Total profit
- $6,853
- Equity at exit
- $14,612
- IRR
- 18.6%
- Equity multiple
- 2.82×
- Total profit
- $49,974
- Equity at exit
- $8,473
Cash invested: $27,440 (down + closing). Projections, not guarantees.
Landlord ↔ Tenant lean methodology
- Overall (STATE)
- 81 Strongly Landlord-Friendly
- State Missouri
- 81 Strongly Landlord-Friendly · R+10
- County
- — inherits STATE
- City
- — inherits STATE
ZIP-level market 63137
- Rents YoY
- 6.6%
- Active inventory
- 203
- Price-to-rent
- 6.5×
Monthly cashflow live
- Estimated rent
- $1,249 high interval (Pro) →
- Mortgage (P&I)
- −$514
- Tax from tax record
- −$149 /mo · $1,790/yr
- Insurance
- −$41
- HOA
- −$0
- Vacancy / Maint / Mgmt
- −$262
- Net cashflow
- $283
Break-even live
Sensitivity live
| Price | -10% $338 | -5% $311 | +0% $283 | +5% $255 | +10% $228 |
|---|---|---|---|---|---|
| Rent | -10% $184 | -5% $234 | +0% $283 | +5% $332 | +10% $382 |
| Rate | -1.0pp $332 | -0.5pp $308 | base $283 | +0.5pp $258 | +1.0pp $232 |
UW: 25.0% down · 7.5% · 30yr · 1.5% tax · 5.0% vac · 8.0% maint · 8.0% mgmt
Financing live
Cash to close
- Down payment
- $24,500
- Closing costs
- $2,940
- Reserves months
- —
- Total cash needed
- —
Loan-product check · same deal, 3 products live
Conventional
25% down · 7.5% · 30yr
- Down + closing
- —
- Monthly P&I
- —
- Monthly cashflow
- —
- DSCR
- —
- Eligible?
- —
Personal DTI + credit; lowest rate.
DSCR
20% down · 8.5% · 30yr
- Down + closing
- —
- Monthly P&I
- —
- Monthly cashflow
- —
- DSCR
- —
- Eligible?
- —
No personal income docs; deal must DSCR.
Hard money
10% down · 12.0% · 12mo
- Down + closing
- —
- Monthly P&I
- —
- Monthly cashflow
- —
- DSCR
- —
- Eligible?
- —
Short-term bridge; refi at stabilization.
Rent comps 32 comps
| Address | Beds | Baths | Sqft | Rent | $/sqft | DOM | Units | Dist |
|---|---|---|---|---|---|---|---|---|
| 1225 Newark Dr Saint Louis, MO | 3.0 | 2.0 | 944 | $1,400 | $1.48 | 5d | 1 | 0.36mi |
| 9418 Pattonwood Dr Saint Louis, MO | 2.0 | 2.0 | 982 | $1,500 | $1.53 | 25d | 1 | 0.40mi |
| 960 Raford Ct St. Louis, MO | 2.0 | 1.0 | 750 | $950 | $1.27 | 25d | 1 | 0.52mi |
| 2056 Coleridge Dr Saint Louis, MO | 3.0 | 1.0 | 949 | $1,195 | $1.26 | 25d | 1 | 0.56mi |
| 2056 Coleridge Dr Saint Louis, MO | 3.0 | 1.0 | 949 | $1,195 | $1.26 | 0d | 1 | 0.56mi |
| 956 Fontaine Pl Saint Louis, MO | 2.0 | 2.0 | 1192 | $1,400 | $1.17 | 25d | 1 | 0.57mi |
| 8828 Riverview Blvd Apt 2S St. Louis, MO | 1.0 | 1.0 | 816 | $850 | $1.04 | 45d | 1 | 0.60mi |
| 605 Fremont Ave Saint Louis, MO | 2.0 | 1.0 | 750 | $995 | $1.33 | 45d | 1 | 0.62mi |
| 849 River Trail Ct Apt 201 St. Louis, MO | 1.0 | 1.0 | 700 | $825 | $1.18 | 45d | 1 | 0.69mi |
| 849 River Trail Ct #102 St. Louis, MO | 1.0 | 1.0 | 700 | $825 | $1.18 | 25d | 1 | 0.69mi |
| 8530 Lowell St Saint Louis, MO | 2.0 | 1.0 | 918 | $1,100 | $1.20 | 45d | 1 | 0.75mi |
| 8548 Drury Ln Saint Louis, MO | 3.0 | 2.0 | 1107 | $1,420 | $1.28 | 45d | 1 | 0.99mi |
| 8817 Shady Grove Ave Saint Louis, MO | 2.0 | 1.0 | 1085 | $1,075 | $0.99 | 25d | 1 | 1.04mi |
| 1942 Damato Ct Saint Louis, MO | 2.0 | 1.0 | 905 | $1,100 | $1.22 | 45d | 1 | 1.08mi |
| 1942 Damato Ct Saint Louis, MO | 2.0 | 1.0 | 905 | $1,100 | $1.22 | 0d | 1 | 1.08mi |
| 2022 McLaran Ave Saint Louis, MO | 3.0 | 2.0 | 1181 | $1,543 | $1.31 | 0d | 1 | 1.10mi |
| 9517 West Ave Unit 1F St. Louis, MO | 3.0 | 1.0 | 1300 | $1,300 | $1.00 | 45d | 1 | 1.15mi |
| 5955 Floy Ave Saint Louis, MO | 2.0 | 1.0 | 1032 | $1,050 | $1.02 | 4d | 1 | 1.21mi |
| 8527 Dianthus Ln Saint Louis, MO | 3.0 | 1.0 | 976 | $1,295 | $1.33 | 45d | 1 | 1.21mi |
| 7 Lamar Dr Saint Louis, MO | 3.0 | 1.0 | 894 | $1,200 | $1.34 | 19d | 1 | 1.22mi |
| 5932 Floy Ave Saint Louis, MO | 3.0 | 1.0 | 1080 | $1,373 | $1.27 | 21d | 1 | 1.24mi |
| 8502 Dianthus Ln Saint Louis, MO | 2.0 | 1.0 | 1072 | $1,175 | $1.10 | 25d | 1 | 1.25mi |
| 9723 Portage Dr Saint Louis, MO | 3.0 | 1.0 | 1014 | $1,450 | $1.43 | 9d | 1 | 1.25mi |
| 1130 Forest Home Dr Saint Louis, MO | 3.0 | 1.0 | 1025 | $1,275 | $1.24 | 45d | 1 | 1.27mi |
| 3 Pohlman Ln Saint Louis, MO | 2.0 | 1.0 | 704 | $1,000 | $1.42 | 17d | 1 | 1.32mi |
| 2152 Nemnich Rd Saint Louis, MO | 2.0 | 1.5 | 1030 | $1,100 | $1.07 | 45d | 1 | 1.37mi |
| 9744 Lanier Dr Saint Louis, MO | 3.0 | 1.0 | 1014 | $1,345 | $1.33 | 45d | 1 | 1.38mi |
| 2415 Shirley Ave Saint Louis, MO | 3.0 | 1.0 | 990 | $1,450 | $1.46 | 25d | 1 | 1.38mi |
| 9908 Norbridge Ln Saint Louis, MO | 2.0 | 2.0 | 1240 | $1,650 | $1.33 | 20d | 1 | 1.43mi |
| 5756 Floy Ave Saint Louis, MO | 2.0 | 1.0 | 1080 | $995 | $0.92 | 45d | 1 | 1.44mi |
| 2427 Switzer Ave Saint Louis, MO | 3.0 | 1.0 | 1008 | $1,300 | $1.29 | 45d | 1 | 1.45mi |
| 5741 Floy Ave Saint Louis, MO | 2.0 | 1.0 | 1000 | $1,100 | $1.10 | 25d | 1 | 1.48mi |
Listing history 12 events
-
2026-06-13statusdays on market $98,000 Pending 34 DOM
-
2026-06-09days on market $98,000 Active Under Contract 32 DOM
-
2026-06-08days on market $98,000 Active Under Contract 31 DOM
-
2026-06-07days on market $98,000 Active Under Contract 30 DOM
-
2026-06-05days on market $98,000 Active Under Contract 27 DOM
-
2026-06-03days on market $98,000 Active Under Contract 26 DOM
-
2026-06-02days on market $98,000 Active Under Contract 25 DOM
-
2026-06-01days on market $98,000 Active Under Contract 24 DOM
-
2026-05-31days on market $98,000 Active Under Contract 23 DOM
-
2026-05-16historical Active Under Contract 1055-char remark
-
2026-05-08$98,000 Active 1055-char remark
-
1979-09-01soldstatus
ⓘ Source: listings_history table (triggers on properties + properties_extension) + one-shot
backfill from property_details.listing_events for pre-trigger history.
Tax reassessment forecast MO · Resets to sale price
- Current annual tax
- $1,790 · $149/mo
- Projected year-2 tax
- $1,790 · $149/mo
- Expected delta
- $0/yr ($0/mo · -0.0%)
ⓘ Screening estimate from a state-policy table — verify with the county assessor before closing.
Climate risk First Street
- Flood 1/10 Low FEMA zone X (unshaded) · 0% chance over 30 yrs
- Wildfire 1/10 Low
- Heat 5/10 Major 7 d/yr ≥107°F today · 21 d/yr by 30 yrs out
- Wind 2/10 Low 100% chance of damaging wind over 30 yrs
- Air quality 4/10 Moderate 5 unhealthy d/yr today · 6 by 30 yrs out
Nearby sold comps map
Loading sold comps map…
Walkable amenities ~0.75 mi
Loading nearby amenities…
Taxation est. · year 1
- Rental income
- $14,991
- − Mortgage interest
- −$5,490
- − Property taxes
- −$1,790
- − Insurance
- −$490
- − Repairs & maintenance
- −$1,199
- − Management
- −$1,199
- − Depreciation
- −$2,851
- Taxable income
- $1,972
- Est. tax owed @ 24.0%
- −$473
- After-tax cash flow
- $2,922/yr
For passive investors: Depreciation is non-cash, so a rental often shows a tax loss while cash-flowing — sheltering income. Rental losses are passive: they offset passive income freely, and up to $25,000/yr can offset ordinary (W-2) income if you actively participate and your MAGI is under $100k (phasing out to $0 by $150k); unused losses carry forward. On sale, claimed depreciation is recaptured at up to 25%, and gains may owe capital-gains tax (a 1031 exchange can defer both). Figures are a year-1 estimate at your 24.0% rate — not tax advice; consult a CPA.
Schools (NCES district)
- District
- Riverview Gardens
- NCES district ID
- 2926670
- Math proficiency
- 2% ▼ -6.00%
- Reading proficiency
- 9% ▼ -6.00%
- Median HH income
- $32,759
- Composite
- 4.22/100
- National rank
- #10058
- State rank
- #324 of 324 in MO
Livability — Bellefontaine Neighbors
- Score
- 58/100
- State rank
- #592
- US rank
- #20944
Category grades
Schools grade is shown separately in the Schools card above.
Census & demographics
- Census place
- Bellefontaine Neighbors, MO
- County
- Saint Louis County · 888,823 people
- City population
- 19,684
- Metro
- St. Louis, MO-IL
- Population (ZIP)
- 19,684
- Household income
- $43,422
- Rent vs Own
- Severe rent burden
- 1863.0
Population outlook (St. Louis County) Hauer SSP2
- Today (2025)
- 1,025,227 people
- By 2030
- 1,028,023 · +0.3%
- By 2040
- 1,020,940 · -0.4%
- By 2050
- 1,007,280 · -1.8%
- By 2075
- 987,277 · -3.7%
- By 2100
- 921,984 · -10.1%
Race, ethnicity, and origin ACS 2023
- Neighborhood character
- Predominantly Black (82%)
- Race & ethnicity
- Black 82% White 13% Two or more races 3%
- Common ancestry
- Romanian 1% Lithuanian 1% Italian 1%
- Foreign-born
- 1%
Political lean MEDSL · St. Louis
- 2024 margin
- Strong D (+23.4) · D 60.8% · R 37.4% · Other 1.7%
- 2008→2024 swing
- +3.5pp toward D · 2008: 19.9pp · 2024: 23.4pp
- All cycles
- 2024: D+23.4 2020: D+24.0 2016: D+16.2 2012: D+13.7 2008: D+19.9
Not yet ingested
- Civics
- —
Market trends
- HPI YoY
- ▼ -96.70%
- Current HPI
- 130.6765
- Rent YoY
- ▲ 6.59%
- Metro
- St. Louis, MO-IL
- State GDP YoY
- ▲ 1.84%
- F500 in state
- 20
Industry mix (Fortune 500 HQ in MO)
| Industry | F500 HQs | Revenue |
|---|---|---|
| Healthcare | 1 | $163B |
|
||
| Insurance | 1 | $21B |
|
||
| Industrial Technology | 1 | $17B |
|
||
| Retail | 1 | $16B |
|
||
| Industrial Distribution | 1 | $10B |
|
||
| Utilities | 1 | $9B |
|
||
Price history
4 events — show timeline
- 2026-06-11 Pending — MARIS as Distributed by MLS Grid
- 2026-05-16 Contingent — MARIS as Distributed by MLS Grid
- 2026-05-08 Listed $98,000 MARIS as Distributed by MLS Grid
- 1979-09-01 Sold (Public Records) — Public Records
Property tax history
+6.0%/yrLatest (2022): $1,790 · +0.9% YoY. Source: county tax records.
Cash-flow waterfall
monthlySold comps — $/sqft
last 12 mo · ≤1 miLoading sold comps…